Смотри обучающее видео по маркету на YouTube
Как купить торгового робота или индикатор
Запусти робота на
виртуальном хостинге
виртуальном хостинге
Протестируй индикатор/робота перед покупкой
Хочешь зарабатывать в Маркете?
Как подать продукт, чтобы его покупали
Технические индикаторы для MetaTrader 4 - 36
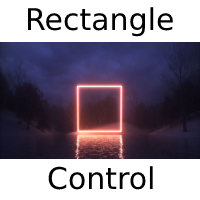
Rectangle Control простой индикатор который отображает на графике панель для рисования прямоугольников с различными настройками, будет удобен тем кто рисует на графике зоны поддержки, сопротивления. Прямоугольник можно нарисовать с заливкой или без, различной толщины и цвета. А также выбрать таймфрейм на котором нарисованный прямоугольник будет отображаться. При нажатой кнопке алерт будет срабатывать оповещение (если прямоугольник находиться ниже цены на верхнем его краю, если прямоугольник нах
FREE
Данный индикатор является одним из вариантов технического индикатора MACD. Индикатор представляет собой разность двух скользящих средних с разным периодом сглаживания. Каждая скользящая средняя дополнительно сглаживается адаптивным цифровым фильтром. В упрощенном понимании адаптивный цифровой фильтр - скользящая средняя с эффективным сглаживанием. Использование цифрового фильтра позволяет сгладить резкие колебания с минимальным запаздыванием сигнала.
Использование индикатора: Следует принимать
FREE
Highly configurable Volume indicator.
Features: Highly customizable alert functions (at levels, crosses, direction changes via email, push, sound, popup) Multi timeframe ability Color customization (at levels, crosses, direction changes) Linear interpolation and histogram mode options Works on strategy tester in multi timeframe mode (at weekend without ticks also) Parameters:
Volume Timeframe: You can set the lower/higher timeframes for Volume. Volume Bar Shift: you can set the offset of th
FREE
Highly configurable MFI indicator. Features: Highly customizable alert functions (at levels, crosses, direction changes via email, push, sound, popup) Multi timeframe ability Color customization (at levels, crosses, direction changes) Linear interpolation and histogram mode options Works on strategy tester in multi timeframe mode (at weekend without ticks also) Adjustable Levels Parameters:
MFI Timeframe: You can set the current or a higher timeframes for MFI. MFI Bar Shift: you can set th
FREE

Сканер показывает значения тренда на основе пересечения двух скользящих средних. Значения отображаются на нескольких символах (до 30) и 8 таймфреймах. Уведомляет о смене направления тренда в терминале MetaTrader 4, по email и push-уведомлением. Это бесплатная версия индикатора: https://www.mql5.com/ru/market/product/29159
Важная информация Для максимального использования потенциала сканера прочитайте полное описание (на английском языке): www.mql5.com/en/blogs/post/718074
Есть различные спос
FREE

Whether you are a scalper or daily trader, you will always look for bullish / bearish engulfing candles. This can be a bit tricky and stressful when you try to visually identify the engulfing candles on the chart. Not only that, you might be trading on the M15 time frame but the engulfing candle is forming or has already formed in the H4 time frame. This indicator is made to do that on your behalf. You can trade on any time frame and see Engulfing candles of another time frame, this means that y
FREE

Active Price Lines
Indicator gives you full custom control over the Bid and Ask price lines, both color and style. Color control is also customizable based on increased or decreased price by the tick.
Options include: Show both the Bid line and the Ask line Set unique color for each Set unique line style for each Set unique color for increased price (by the tick) Show only Bid line Show only Ask line
Rider Capital Group
FREE
This indicator allows to hide Volume (on all MT4 timeframes) from a date define by the user with a vertical line (Alone) or a panel (with "Hidden Candles"). The color of each bar depends if this one is higher or lower of the previous bar. Indicator Inputs: No inputs for this indicator Information on "Volume" indicator is available in this post: https://www.mql5.com/en/forum/134260 ************************************************************* Hey traders!! Give me your feeds! We are a commun
FREE

Traditional RSI is one of the most popular and must-known indicator that every traders would use. In this combination, we use two RSI period with smoothed factor to smooth the RSI lines for better results. Besides, bottom of Indicator is the Trend-filter display in different colors in order to let Traders identify the trends much easier Grey : Sideway market Light-Blue : Weak UP-Trend Blue : Strong UP-Trend Light-Red : Weak DOWN-Trend Red : Strong DOWN-Trend Signal: Blue-Arrow
FREE

Описание Цветной индикатор для раскраски настроений рынка линейного графика в окне основного финансового инструмента. Полезен для поиска линий поддержки и сопротивления. Назначение Индикатор может быть использован для ручной или автоматической торговли в составе советника. Для автоматической торговли могут быть использованы показания индикаторных буферов типа double : повышающаяся линия - буфер 0, не должен быть равным EMPTY_VALUE. понижающаяся линия - буфер 1, не должен быть равным EMPTY_
FREE

Это еще одна версия непараметрического зигзага. Его ребра идут вверх до тех пор, пока не встретится бар, максимум (high) которого ниже самого выского минимума (low) в этом ребре, а ребра вниз продолжаются до тех пор, пока не встретится бар, минимум (low) которого расположен выше самого низкого максимума (high) в этом ребре. В дополнение к самому зигзагу (отображаемому оранжевым цветом), индикатор выводит сигнальные метки на тех барах, где зигзаг меняет направление. Синяя стрелка вверх означает,
FREE

This indicator draws: . sma20 of 30 MIN - <Blue> . sma20 of 1_HOUR - <Purple> . sma20 of 4_HOURS - <Orange> in THE SAME GRAPH DE 1 MIN, 5 MIN, 15 MIN Y 30 MIN Have you ever had the moving average of 20 30-minute periods, the moving average of 20 1-hour periods and the moving average of 20 4-hour periods on the same chart? that in the Chart of 1 minute, 5 minutes, 15 minutes and 30 minutes the 3 moving averages remain in the same place? They don't run like in the normal moving stockings tutoria
FREE

Forex trading support timer: - This is an indicator that supports a trader's trading process. - Before placing a BUY or SELL order, it is advisable to observe what the current time is like, to get the best position when trading. Function of indicator: - Display information about candle closing time of different timeframes (M1,M5,M15,H1), best used when Scalping. - Show market spreads. - Show TimeZone Trading. - Displays the remaining time of a session.
FREE
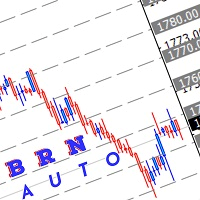
Use this indicator to draw multiple horizontal line to nearest round number Range for round number can be adjust manually depend how user want to use it Selection of colour also can be adjust manually Hope this indicator can help somebody in their trading.
How to use this: Mostly I use this indicator for break, retest and entry. example:- current price XAUUSD :1740.00 which mean the closest level are 1750.00 and 1730.00 Wait for price to break this level. then wait for retracement if price mak
FREE
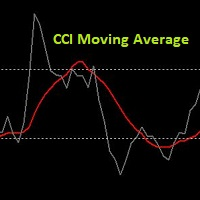
It's a very simple indicator. This is simply the CCI moving average. The CCI Moving Average Indicator allows us to reduce false signals and optimize our trading. The required indicator inputs are: CCI Period, CCI Applied Price, Period of CCI Moving Average and Method of CCI Moving Average. The chart displays the original CCI and its moving average. This is my first indicator that I publish. I hope the indicator will benefit you. The author of this indicator is Tomasz Buliński.
FREE

Aroon and Moving Average A combination of Supertrend and Moving Average to create a converging trade setup Input parameters: signal mode: set it to true if you want to plug it into STAT (Signal Tester and Trader) arrow shift: distance between fast EMA line to arrow on chart turn on price line filter turn on moving average signal for converging setup aroon period MA period MA averaging method MA pricing method upper level limit (Aroon) lower level limit (A roon ) You can find the best setting
FREE

HZZM - это адаптивный зигзаг, построенный на модификации индикатора HZZ (исходный код доступен в статье ). Наиболее важные изменения: добавлено 2 индикаторных буфера, позволяющих отслеживать построение новых отрезков зигзага - в точках, где сменяется направление зигзага, выводятся цветные крестики; диапазон зигзага (H) может автоматически определяться в движении на основе дневного диапазона; диапазон зигзага может изменяться в зависимости от времени существования текущего отрезка. Параметры: H
FREE

Что такое Squeeze? Сокращение полос Боллинджера внутри канала Кельтнера отражает перерыв и консолидацию на рынке и обычно рассматривается как потенциальный индикатор последующего направленного движения или больших колебательных движений. Когда полосы Боллинджера выходят за пределы канала Кельтнера, это означает переход рынков от низкой волатильности к высокой - информация, которую ищут все трейдеры. Различия
Squeeze FREE
Squeeze
Squeeze PRO Количество таймфреймов
1
5
10
Пользовательск
FREE

Индикатор информирует о том, когда закроется текущий бар и откроется новый бар. ВРЕМЯ является важным элементом торговых стратегий. Индикатор BarTimerLite поможет вам КОНТРОЛИРОВАТЬ ВРЕМЯ . Простой в использовании: поместите на график и если нужно задайте “будильники”. В тестере индикатор не работает. Основные Возможности
Показывает время прошедшее с момента открытия текущего бара. Обновления индикатора каждую секунду. Настройка внешнего вида (31-36) и расположения (21-24) индикатора, изме
FREE

Полная версия индикатора находится здесь .
Индикатор предназначен для торговли внутри дня. Строит канал по пробою крайних уровней которого вы можете открывать ордер на покупку или продажу. Во флетовом рынке работа ведётся на отбой от этих уровней. Для фильтрации входов используется цветная гибридная скользящая средняя. Настройки по умолчанию предназначены для терминального времени GMT +3 (подходит для большинства брокеров) и для терминалов с пятизначными котировками. Индикация канала и уровней
FREE
Данный индикатор отображает на графике цены сигналы DSS Bressert AM . Расчет значений DSS Bressert аналогичен стохастическому индикатору. Подтверждением сигнала индикатора является преодоление ценой макисмума/минимума бара на котором индикатором подан сигнал. Настройки: Price - цена по которой рассчитывается индикатор; EMA_Period - период сглаживания; Stoch_Period - период осцилятора;
OB_Level - уровень перекупленности; OS_Level - уровень перепроданности;
Show_Move - отображение моментов и
FREE

Целью этой новой версии стандартного MT4 индикатора, входящего в поставку платформы, является отображение в подокне нескольких таймфреймах одного и того же индикатора. См. пример, приведенный на рисунке ниже. Однако индикатор отражается не как простой индикатор MTF. Это реальное отображение индикатора на его таймфрейме. Доступные настройки в индикаторе FFx: Выбор таймфрейма для отображения (от M1 до MN) Установка ширины (количество баров) для каждого окна таймфрейма Всплывающее оповещение/звуков
FREE

This indicator helps you to find overbought and oversold prices based on William %R. Input Description: Wperiod: Period for %R indicator. OverBoughtLevel: Define the overbought level for %R. Must in between 0 and -50. OverSoldLevel: Define the oversold level for %R. Must in between -50 and -100. middle_value: When true, indicator also draw the middle points between upper and lower line. shift: Set an additional offset to the indicator.
Several Notes: Set 0 and -100 as Overbought and Oversold le
FREE
What is a tool ? This indicator use for forecast direction of the 28 pairs, Calculates from multiple pairs and timeframes and present by percentage as 70-79% , 80-89% , 90-100% is a little, medium and strong trend. How to use Place the indicator on any pair and any timeframe. Pair : Any Timeframe : Any Input Parameter No Visit my products Target Profit Magic Target Profit All The Profit Tracker Currency Scoring Pair Direction
FREE

Many traders use The Bull-Bear Indicator, I decided to combine the two into just one, so the visualization is better, and I am sharing it with you. the trading rules remain the same, you can adjust the period as per your preference.
The Bull-Bear Indicator is a free indicator with several versions widely published on the internet, this is just a version that I put together, I hope you like it. If you want to know the indicators of my authorship, please visit my page here .
FREE

Скалированный индикатор потрясающего осциллятора (SAO) представляет собой усовершенствованную версию индикатора потрясающего осциллятора, целью которой является установление стабильных точек опоры для выявления рыночных перегибов. В отличие от стандартного индикатора потрясающего осциллятора, который регистрирует изменения в пипсах для разных товаров, единственной неизменной точкой отсчета является нулевая линия. Это ограничение мешает инвесторам и трейдерам точно определить уровни для разворота
FREE
Данный индикатор является модификацией классического индикатора Parabolic support and resist (PSAR). Индикатор имеет два настраиваемых диапазона что позволяет идентифицировать долгосрочный и краткосрочный тренд. Индикатор имеет возможность подавать сигналы и отправлять уведомления о них на электронную почту и терминал. Проверенный временем продукт позволяющий не только определять точки входа/выхода но и обоснованные уровни для установки защитных стоп ордеров.
FREE

In physics, "Jerk" is the third time-derivative of position, with acceleration being the second derivative and velocity the first derivative. In technical analysis, the first derivative of price is the price momentum, with the second derivative,acceleration, being seldom used and the third derivative virtually unknown. The magnitude frequency response of a digital differentiator is a positive-slope straight line passing through zero frequency. Therefore, every instance of a digital signal differ
FREE
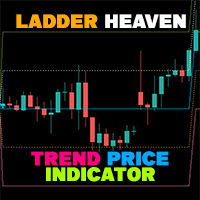
If you have difficulty determining the trend as well as entry points, stop loss points, and take profit points, "Ladder Heaven" will help you with that. The "Ladder Heaven" algorithm is operated on price depending on the parameters you input and will provide you with signals, trends, entry points, stop loss points, take profit points, support and resistance in the trend That direction.
Helps you easily identify trends, stop losses and take profits in your strategy!
MT5 Version: Click he
FREE
Индикатор показывает уровни High и Low свечей выбранных в настройках ТаймФреймов. Рекомендуется использовать на младших ТаймФреймах для определения уровней старших ТаймФреймов.
Параметры TYPE_LINE - тип линии (короткая от времени бара, либо длинная на весь график) ============= TF 1 ============= блок линий по первому ТаймФрейму TF_1 - ТаймФрейм первого блока линий Bars_1_from=1 - Бар начала линии соответствующего ТаймФрейма Bars_1_for=1 - Бар окончания линии соответствующего ТаймФрейма Co
FREE

Технический индикатор, в реальном времени осуществляет поиск свечей, которые своим размером превышают заданный в настройках и дает об этом сигналы. Как правило, такие аномально большие свечи появляются либо в начале сильных импульсов, либо на окончании направленного движения цены. В начале импульса сигнал может служить основанием для поиска точки входа, в конце движения - является признаком кульминации и может говорить о близком окончании тренда. Эталонным размером для фильтрации аномальных све
FREE

The Currency Strength Breakout indicator monitors eight currencies across M1, M5, M15, M30 & H1 time frames all in the same window.
Trade the strongest currency against the weakest with alerts for pullbacks giving you the opertunity to enter the trend. Please note: I have made the decision to give this Indicator away and many more for free with limited support so that I can concentrate on Custom EA.
View More Products - https://www.mql5.com/en/users/robots4forex/seller#!category=1
Monitoring
FREE

Support and Resistance Levels Arrow Indicator please leave 5 stars to me A support level is a level where the price tends to find support as it falls. This means that the price is more likely to "bounce" off this level rather than break through it. However, once the price has breached this level, by an amount exceeding some noise, it is likely to continue falling until meeting another support level. A resistance level is the opposite of a support level. It is where the price tends to find re
FREE
Данный индикатор представляет собой линию построенную по максимальным/минимальным значениям выходящим за пределы канала из максимальных/минимальных цен за больший период. Фактически, используются два типа канала одновременно: Первый - построенный по максимумам/минимума за выбранный период (Ind_Period); Второй - построенный по сглаженному значению максимальных/минимальных значений цены (Smoothing_Channel, Shift_Channel). Для расчета индикатора берутся наибольшее/наименьшее значение из двух канал
FREE

Данный индикатор позволяет узнать сколько цена может пройти на текущем баре. Он выискивает среднее значение ATR для предыдущих 5 баров и рисует 2 границы цены. Вы можете его использовать на любом таймфрейме любого инструмента. На основе этого индикатора можно выставлять уровни стоп лосса и и профита, а также использовать его и в других хороших стратегиях. Не забывайте пользоваться риск менеджментом во время торговли!
FREE

Индикатор R Stoploss Signals основан на тренде, следующем за экспоненциальной скользящей средней.
Этот форекс-индикатор генерирует торговые сигналы на покупку и продажу в виде синих и красных линий, нарисованных на графике активности.
Линии синего цвета указывают на то, что тренд восходящий, и это сигнал на покупку валютной пары. Красные линии указывают на то, что тренд направлен вниз, и это является сигналом к продаже валютной пары. Предлагаемая линия стоп-лосса также включена в этот индик
FREE

IntradayMagic прогнозирует характер ATR и тиковых объёмов на 1 сутки вперёд. Индикатор не перерисовывается и не отстаёт. Используя Intraday Magic вы можете значительно повысить качество торговли и избежать излишних рисков. По его показаниям можно детектировать кризисные состояния рынка и моменты разворота тренда, уточнять моменты и направления входов. Это бесплатная ознакомительная версия ограничена символами (парами) включающими GBP. Никаких иных ограничений нет. Для других пар вы можете исполь
FREE

Hello all. This indicator helps you to open a trade, when break out occurred, also you can add to your position and ride it if trend continued. I use it on 1-5 min chart, as you can use short stop loss. Also profit target should be small as well. It is better to enter few small position, so you can book some profit early and ride the rest for bigger gains. Look at the past to have a plan. Enjoy.
FREE

Wicks UpDown Target GJ
Wicks UpDown Target GJ is specialized in GJ forex pairs.
Choppy movement up and down on the opening range every day. Trading breakouts on London session and New York session is recommended.
Guideline Entry Strategy Idea:
Step 1 - Breakout Forming (Warning! Trade on London Session and New York Session) Step 2 - Breakout Starting (Take Action on your trading plan) Step 3 - Partial Close your order & set breakeven (no-risk) Step 4 - Target complete Step 5 - Don't tr
FREE
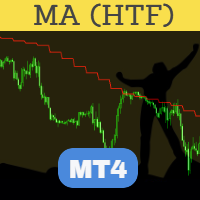
Совершенный MA (Скользящее среднее) HTF (Старший таймфрейм), пожалуй, самый продвинутый и надежный индикатор HTF. Высоко оптимизированный с точки зрения исполнения индикатор поставляется со стандартными настройками индикатора MA, который поставляется с платформой MT4. Поместите индикатор на график любого таймфрейма. Вы можете выбрать больший таймфрейм во входных данных индикатора. Один и тот же индикатор можно использовать на графике несколько раз для построения MA с разных таймфреймов или для р
FREE

Индикатор Currency Explorer позволяет вам знать с рассчитанной точностью силу и слабость каждой валюты и торговать, применяя необходимые стратегии. Наши модели машинного обучения рассчитывают силу/слабость каждой валюты на основе нескольких факторов помимо поведения цены. Индикатор предоставляет количественное значение силы восьми наиболее популярных основных валют (EUR, USD, JPY, GBP, AUD, NZD, CAD и CHF) от 0 до 100 на пяти любых таймфреймах, выбранных пользователем. Кроме таймфреймов, можно в
FREE
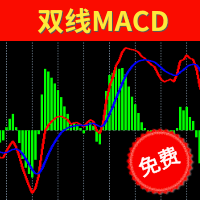
Two Lines MACD Many people who conduct technical transactions on MT4 like to use MACD to judge the turning or continuation of the market. When everyone uses the MACD indicator that comes with MT4, they find that the indicator is a single-line MACD, and the histogram seems to be similar to the past. The MACD that I understand does not match. In order to provide traders with a perfect trading experience, we especially provides free two-line MACD indicators for all traders! The single line in the
FREE

Индикатор вычисляет нарастающий итог от линейно взвешенных результатов виртуальных торгов. Это преобразует котировки в интегрированный, разностно-стационарный ряд с легко различимыми зонами покупок и продаж. Зоны покупок - синие, зоны продаж - красные. Параметры: period - количество баров для расчета линейно-взвешенной суммы; по-умолчанию - 96; smoothing - период EMA-сглаживания; по-умолчанию - 5; mode - целое число, определяющее режим расчетов: 0 - долгосрочная торговля; 1 - среднесрочная торго
FREE
Индикатор позволяет упростить интерпретацию сигналов классического индикатора ADX. Расположение толстых столбцов гистограммы относительно нуля и ее расцветка говорят о направлении движения цены определяемого по пересечению DI+ / DI-. Расположение тонких столбцов гистограммы относительно нуля и ее расцветка говорят о силе движения цены. Сигналом индикатора на покупку является преодоление ценой максимума последнего полностью сформированного бара на котором толстый столбец гистограммы выше нуля, п
FREE

Binary Options Assistant (BOA) ICE Signals Indicator provides signals based on gkNextLevel Binary Options Strategy. Indicators: 2 Bollinger Bands & Stochastic
Stop missing trades, stop jumping from chart to chart looking for trade set-ups and get all the signals on 1 chart! U se any of the BOA Signals Indicator with the Binary Options Assistant (BOA) Multi Currency Dashboard .
All BOA Signal Indicator settings are adjustable to give you more strategy combinations. The signals can be
FREE
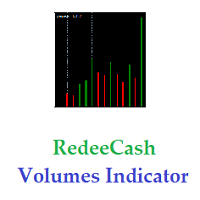
Version History : Date Version Changes 6/20/2022 1.00 Initial release 6/21/2022 1.10 Add global variables for Minimum (SYMBOL_volume_min) and Maximum (SYMBOL_volume_max) History Volumes Description : RedeeCash Volumes Indicator is the Volumes indicator that you have come to trust for market entry and exit with the added benefit of exposing key metrics as global variables. Including global variables in an indicator permits easier interaction with expert advisors (EA) and scripts. When attaching
FREE
This indicator displays the historical spread values on the chart. This is an extremely useful tool for watching the spread rise and fall, allowing you to enter the market at just the right time. This indicator will help you stay out of the market when the spread begins to rise and help you get into the market as the spread begins to fall again.
ON SALE FOR FREE, GET IT FREE FOR A LIMITED TIME ONLY
FREE

The " Candle Countdown Indicator " is a MetaTrader 4 tool that displays real-time countdowns to the next candle open. This precise timing information enhances trading decisions, making it indispensable for traders across various styles and timeframes. Customizable fonts and colors ensure seamless integration with your charts. Elevate your trading strategy with this intuitive and invaluable indicator.
FREE
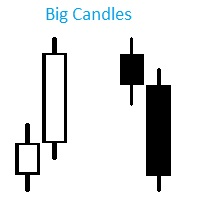
Индикатор Big Candles показывает кратное превышение размера свечи относительно среднего показателя рассчитанного за определенный период. Индикатор отмечает размер свечи на графике в пипсах и сигнализирует о появлении “большой” свечи. Описание параметров: HistoryBars - Количество баров для отображения индикатора countN - Период расчета среднего размера свечи f actor - Во сколько раз длина свечи превышает средннее значение, для отображения сигнала
FREE
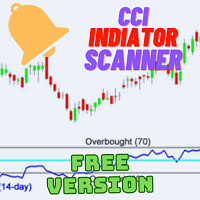
Introduction: Welcome to the world of advanced trading tools! Introducing the CCI Multicurrency Scanner, an exceptional MT4 indicator designed to revolutionize your trading experience. With its powerful features and comprehensive insights, this tool will empower you to make informed decisions and maximize your profitability. Features: Efficient Multicurrency Scanning: Our CCI Multicurrency Scanner swiftly scans multiple currencies based on your inputs. Receive instant alerts when specific condit
FREE

EMA Above Below Bid price Технический индикатор в помощь трейдеру. Данный индикатор, показывает расположение пяти ЕМА,
пяти средних скользящих, относительно цены формирующей японские свечи или бары (цена Bid ).
О понятии ЕМА.
Скользящая средняя (moving average, MA) — это дополнительная линия на графике цены актива.
Внешне она повторяет график цены, но с небольшим запозданием и более гладко, без колебаний. Основные характеристики:
1. Показывает тренды. Если скользящая устрем
FREE

Индикатор "Buy Sell zones x2" основан на принципе "остановка/разворот после сильного движения". Поэтому, как только обнаруживается сильное безоткатное движение, сразу после остановки - рисуется зона покупок/продаж. Зоны отрабатывают красиво. Или цена ретестит зону и улетает в космос, или пробивает зону насквозь и зона отрабатывается с другой стороны так же красиво. Работает на всех таймфреймах.
Лучше всего выглядит и отрабатывает на Н1.
Может использоваться как: индикатор зон, где лучше
FREE

Индикатор ищет один из наиболее эффективных свечных паттернов разворота - Three Line Strike (прорыв трех линий). По словам автора бестселлера и свечного гуру Томаса Булковски, паттерн приносит прибыль в 65-84% случаев . Эта бесплатная версия работает только на EURUSD и GBPUSD. Полная версия индикатора доступна по ссылке: Three Line Strike Scanner 30 Instruments Индикатор сканирует до 30 инструментов (форекс, индексы и товары) на 8 таймфреймах. Вы можете получать алерты в самом терминале или по э
FREE

Этот простой индикатор использует Ichimoku Kinko Hyo для поиска сильных и слабых валют в составе пары, чтобы обнаружить тренд. Индикатор также выдает сигналы на покупку и продажу на основе стандартного отклонения оборота вместе с силой валюты. Если цена выше как дневного облака (кумо), так и 26-дневной линии Kijun-sen, валюта считается сильной. Аналогично, если цена ниже как дневного облака, так и линии Kijun-sen, валюта считается слабой. Сопоставляя сильную и слабую валюты, советник ищет тренд.
FREE

Normalized indicator. It measures the relative deviation of the price from its moving average. It is extremely reliable. Accurately determine overbought and oversold price areas and divergences. Features. The indicator has a range of -100 to 100. The overbought zone is above 80 and the oversold zone is below -80. Zones of overvalue, indicate possible reversal. Mode: histogram/line. MA method: simple, exponential, smoothed, linear weighted. By default, the indicator is calculated on an SMA of
FREE

The indicator allows you to trade binary options. The recommended time frame is М1 and the expiration time is 1,2,3 minutes. The indicator suitable for auto and manual trading. A possible signal is specified as a arrows above/under a candle. You should wait until the candle closes! Arrows are not re-painted Trade sessions: TOKYO section (Half-end) Currency pairs: USD/JPY Working time frame: M1 Expiration time: 1,2,3 minutes. The indicator also shows good results when using the martingale strateg
FREE

Traders Dynamic Index (TDI) Signal Input parameters: signal mode: set it to true if you want to plug it into STAT (Signal Tester and Trader) arrow shift: distance between fast EMA line to arrow on chart middle band filter price line filter RSI period RSI price method Volatility period MA period 1 MA period 2 Averaging method You can find the best setting for 4 hour EURUSD on this video
FREE

Traditional Moving Average (SMA, EMA, SMMA, LWMA...) is very useful for identifying trends, but what will you do when you want to trade on lower timeframe, and you need to identify the bigger trend by a higher timeframe; Of course, you can make it by dividing your chart in separated windows, but your analytics will not be clear and intuitive ... That's why we build the Multi Timeframe Moving Average indicator.
With Multi Timeframe Moving Average ( MTF_Moving Average ), you can determine the M
FREE

RaysFX EMA Crossover Scopri i potenziali punti di inversione del mercato con l’indicatore di Crossover EMA di RaysFX. Questo indicatore utilizza una combinazione di due medie mobili esponenziali (EMA) - una più veloce e una più lenta - per identificare i possibili punti di ingresso e uscita. Caratteristiche principali : Due EMA : Utilizza una EMA più veloce e una più lenta per catturare i movimenti di mercato a breve e lungo termine. Segnali di crossover : Genera un segnale quando l’EMA più v
FREE

Данный индикатор является интерпретацией Индекса Среднего Направления Движения (Average Directional Movement Index, ADX), который помогает определить наличие ценовой тенденции. Его разработал и подробно описал в книге «Новые концепции технических торговых систем» Уэллс Уайлдер. Индикатор определяет точки входа в рынок, в качестве сигнала используя пересечение +/- линий индикатора ADX, а также рост или падение основной линии индикатора ADX. Пересечение индикатором нулевой линии свидетельствует о
FREE
This indicator allows to hide Bollinger Bands (on all MT4 timeframes) from a date define by the user, with a vertical line (Alone) or a panel (with "Hidden Candles"). Indicator Inputs: Period Deviations Shift Apply To Color Style Width Information on "Bollinger Bands" indicator is available here: https://www.metatrader4.com/en/trading-platform/help/analytics/tech_indicators/bollinger_bands ************************************************************* Hey traders!! Give me your feeds! We are
FREE

Just Currency Strength is a simple, and easy to use as a market analysis tool. It could helps trader to understand the broder view of the market and forcasting the movemt of each currency symbol and trend direction of each specific currency pair. Parameters Timeframe (Move Timeframe box to move the pannel) Currency (Must NOT be less than 5 currencies) Refreshtime in second Colors Strong//Weak//Neutrial Alerts setting Alert On/Off Push notification On/Off Happy Trading...
FREE

Здесь все очень просто. Никогда не понимал индикаторы без внешних параметров. И Awesome Oscillator не исключение. Теперь вы можете настраивать этот индикатор под свои потребности и стратегии. Справка: Индикатор Awesome Oscillator показывает расстояние в пунктах между двумя скользящими средними (быстрой и медленной). Индикатор AO_Robex имеет в параметрах изменение периода скользящих средних.
FREE

Панель Time End от MMD — это простой индикатор, который показывает количество секунд, оставшихся в трех выбранных интервалах. Согласно методологии MMD важен момент, когда происходит направленное движение цены. Этот индикатор позволяет более эффективно использовать эту взаимосвязь в торговле на рынке Форекс и фьючерсами.
Описание функционала:
Time Frame 1 Period - определение первого временного интервала Time Frame 1 Color - указание цвета для первого временного интервала Time Frame 1 Period
FREE

Free Scalping System представляет собой полноценную торговую систему для максимально эффективной торговли в любых рыночных условиях на всех временных масштабах.
Система состоит из двух основных блоков:
1. Блок определения тренда, рассчитывающий динамические уровни сопротивления и поддержки. Для этого блока доступна функция автооптимизации.
2. Блок определения отклонения цены от среднего значения, основанный на большом наборе линий регрессии разного периода для получения статистически достов
FREE

Just INDY is a simple, and easy to use trend and reversal indicator. It will continuously monitor the movement of the price actions searching for new trends establishing or strong reversals at extreme overbought, and oversold levels.
Parameters Signal Perios
Sent Notification Please Test it with Strategy Tester and see how it work.
Happy Trading...
FREE
D1 Free Fibo Channels with support and resistences...
Become a constantly profitable 5-star forex trader!
We offer a few indicators to support you understand and analyse the market! With our strategies you will improve your trading system and bacome an expert...
We have indicators for trend direction, market direction and others.. for multi-time frames and that covers all majors or your favorite trading symbols! Some of them offer a customizable calculation parameters... or Graph features
FREE

The RSI Basket Currency Strenght brings the RSI indicator to a new level. Expanding the boundaries of TimeFrames and mono-currency analysis, the RSI Multi Time Frame Currency Strenght take the movements of each currency that composes the cross and confront them in the whole basket of 7 crosses. The indicator works with any combination of AUD, CAD, CHF, EUR, GBP, JPY, NZD, USD pairs and with full automation takes in account every RSI value for the selected Time Frame. After that, the indic
FREE

The indicator shows your positions and orders on the chart, with the take profit and stop loss converted into order currency. You can see at a glance how big the profit or loss of your trades would be if the take profit or stop loss were reached. Metatrader displays these values when you move the mouse over the StopLoss or TakeProfit line. With the indicator you can see the numbers in large friendly digits at a glance.
Instead of using orders, the indicator can also calculate this for lines,
FREE

Introduction
"Smart money" is money invested by knowledgeable individuals at the right time, and this investment can yield the highest returns.
The concept we focus on in this indicator is whether the market is in an uptrend or downtrend. The market briefly takes a weak and reversal trend with "Minor BoS" without being able to break the major pivot.
In the next step, it returns to its main trend with a strong bullish move and continues its trend with a "Major BoS". The "order bloc
Узнайте, как легко и просто купить торгового робота в MetaTrader AppStore - магазине приложений для платформы MetaTrader.
Платежная система MQL5.community позволяет проводить оплату с помощью PayPal, банковских карт и популярных платежных систем. Кроме того, настоятельно рекомендуем протестировать торгового робота перед покупкой, чтобы получить более полное представление о нем.
Вы упускаете торговые возможности:
- Бесплатные приложения для трейдинга
- 8 000+ сигналов для копирования
- Экономические новости для анализа финансовых рынков
Регистрация
Вход
Если у вас нет учетной записи, зарегистрируйтесь
Для авторизации и пользования сайтом MQL5.com необходимо разрешить использование файлов Сookie.
Пожалуйста, включите в вашем браузере данную настройку, иначе вы не сможете авторизоваться.