Смотри обучающее видео по маркету на YouTube
Как купить торгового робота или индикатор
Запусти робота на
виртуальном хостинге
виртуальном хостинге
Протестируй индикатор/робота перед покупкой
Хочешь зарабатывать в Маркете?
Как подать продукт, чтобы его покупали
Технические индикаторы для MetaTrader 4 - 37

Перед вами самый неприхотливый в использовании индикатор, но один из самых полезных. Он оповещает о ближайшем развороте перед растущей волатильностью. Именно волатильность даёт доход трейдеру. Индикатор особенно пригодится тем, кто не хочет ждать нужного момента перед монитором. Индикатор устанавливается на графики М15 и М30. По наблюдениям на этих таймфреймах он лучше всего фиксирует приближение широких ценовых волн. Хорошо зарекомендовал себя на валютной паре USDZAR (Внимание: пара с большим
FREE

Этот эксперт предназначен для работы в паре с одноименным индикатором. https://www.mql5.com/ru/market/product/34834
Эксперт ни чего не отображет на экране и не торгует.
Он только производит вычисления для индикатора, так сделано для экономии ресурсов вашего компьютера.
Так как эксперт работает с символами из Market Watch, нет возможности протестировать его в тестере.
Инструкция по использованию: 0) Выберите необходимые символы в Market Watch, которые будут отображатся в индикаторе. (Note:
FREE

iCC in iMA - индикатор для изменения цвета iMA, когда iCCI пересекает уровень вверх (растущий тренд) или пересекает уровень вниз (падающий тренд). Это полезный инструмент для отслеживания растущего и падающего iCCI на iMA.
Параметры MA_Periods — период iMA. MA_Method — метод расчета iMA. CCI_Periods — период iCCI. CCI_ApliedPrice — цена для построения iCCI. CCI_LevelsUp — уровень iCCI для растущего тренда. CCI_LevelsDN — уровень iCCI для падающего тренда. BarsCount — количество баров для показ
FREE

Commodity Channel Index and Moving Average [CCI MA] A combination of CCI and MA to create a crossover trading setup Input parameters: signal mode: set it to true if you want to plug it into STAT (Signal Tester and Trader) arrow shift: distance between fast EMA line to arrow on chart price line filter CCI period CCI price method Moving average period Averaging method upper level lower level You can find the best setting for 4 hour EURUSD on this video
FREE
Данный индикатор отображает на графике цены сигналы высокоэффективного осциллятора - Laguerre Osc 3 AM . Индикатор отображает разницу текущей цены с ценой за предыдущий период. Подобный метод анализа рынка используется в классическом индикаторе Momentum. В то же время, представленный индикатор использует первичное сглаживание данных фильтром Laguerre, что позволяет сохранить чувствительность индикатора и минимизировать "шум". Сигналами индикатора являются: Пересечение гистограммой 0. Смена напр
FREE

Divergence Reader - индикатор который поможет Вам идентифицировать на графике дивергенцию и конвергенцию.
Настройки Type - выбор типа сигнала (дивергенция, конвергенция, оба сигнала); Minimum length of divergence (Candle) - минимальная длинна сигнала (в свечах); MACD SETTINGS - настройки индикатора МАСD; Важно! Индикатор не рисует графику на истории! Для визуальной проверки индикатора рекоммендую использовать тестер.
FREE

Stochastic RSI производит расчет стохастика на индикаторе RSI. Индекс относительной силы (RSI), разработанный Дж. Уэллсом Уайлдером, является известным импульсным осциллятором, измеряющим скорость и изменение ценового движения.
Особенности Находит ситуации перекупленности и перепроданности. Звуковое оповещение при достижении уровня перекупленности/перепроданности. Получайте уведомления по электронной почте и/или на мобильное устройство при обнаружении сигнала. Индикатор не перерисовывается. Во
FREE

Introduction
The Price Action, styled as the "Smart Money Concept" or "SMC," was introduced by Mr. David J. Crouch in 2000 and is one of the most modern technical styles in the financial world. In financial markets, Smart Money refers to capital controlled by major market players (central banks, funds, etc.), and these traders can accurately predict market trends and achieve the highest profits.
In the "Smart Money" style, various types of "order blocks" can be traded. This indicator

Индикатор сконвертирован из кода другого языка программирования программистом "sbtnc". MQL-версия упрощена, чтобы быть более полезной за счет меньшей сложности настроек.
Есть несколько подсказок от программиста по поводу индикатора:
Индикатор отслеживает и сообщает процент появления дневных вершин и низов по времени суток. В определенное время в течение торгового дня рынок разворачивается и отмечает максимум или минимум дня. Вершины и низы крайне важны при входе в сделку, поскольку они опр
FREE
Machine translation of the following: This indicator is used to close or open the price and time scales.Select true to display scale and false to close scale.After the price scale is closed and then opened, it may show that it is not at all. But it can be solved by switching time cycle.This indicator has two tags, D and P, which can be opened or closed in real time by clicking.The related parameters can be modified by user, such as the name, position and coordinates of the label.
FREE
Your attention is invited to the indicator Price Action Indicators. It doesn't need settings. And also it is not tied to more than one indicator, which makes it not vulnerable to different accounts or brokers.
Add one setting PERIOD
Regards, Mikhail
Вашему вниманию предлагается индикатор Price Action Indicators. Ему не нужны настройки. А также он не привязан не к одному индикатору, что делает его не уязвимым перед разными счетами или брокерами.
С Уважением Михаил
FREE

Hypothetical trend line display
Distance from the trend line
Can be used in all symbols
Can be used in all time frames
An interesting indicator for predicting small waves
The greater the distance from the trend line, the more likely it is to return to the trend line
Settings:
The first three(osic 1,2,3):
are the same as the settings of the zigzag indicator
The bigger these numbers are, the bigger the trend lines and the longer the trend
Back Show:
The number of candles displayed
FREE

Сбалансированный вход VArmadA
Простой, но мощный фрактальный индикатор поддержки/сопротивления
Работает с таймфреймами 1Н и выше и протестирована на всех основных парах. Обратите внимание на сигнал: Стрелка, указывающая на длинную или короткую запись.
Как это работает:
Стрелки указывают на обратную поддержку/сопротивление. Стрелка вверх означает длинную - стрелка вниз указывает на короткую сделку.
Инструкции:
- IndicatorLong/IndicatorShort: Выберите цвета для стрелок данного
FREE

Description:
This Free Indicator will allow you to monitor the Max/Min spread in a bar/candle. By running it 24h/24h will allow you to recognize which period of time having maximum spread, based on that you will understand the market more, and could develop/improve to have better trading strategy.
Parameters: limit: <specify the limit of spread, above which the indicator will mark the price, at which high spread occurs>
Note: Beside the price marked due to high spread above, the indicator
FREE
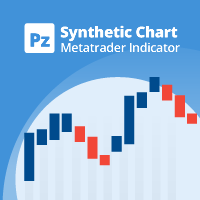
This indicator creates synthetic charts. It creates a candlestick chart plotting the price of one instrument measured against another, helping you to find hidden opportunities in the market crossing relationships between different instruments. [ Installation Guide | Update Guide | Troubleshooting | FAQ | All Products ] Find hidden trading opportunities Get a broader sense of the price of commodities Commodities range against each other and are easier to trade Correlated Indices can be traded ag
FREE

Представленный индикатор на новом уровне реализует идею, заложенную в классические индикаторы Bulls и Bears. Данный индикатор отображает разность максимальной и минимальной цен за текущий период времени и значений канала, построенного по максимальным и минимальным ценам за больший период. Рост значений индикатора выше нуля говорит о том, что максимальная цена за текущий период больше среднего значения максимальных цен за период, выбранный в качестве параметра индикатора. Такая ситуация в большин
FREE
I create this this Free Indicator to help you to plot your BUY / SELL Average and BEP level in your chart. Just drag to your chart, and you can see the level and plan better to your trade. It's usefull if you have averaging position or even hedging position, so you can plan your trade better and no need to calculate manually again. Use it for free, and please leave comment if you feel this usefull.
FREE

Trend indicator derived from T3 moving averages. The cloud is bounded by a fast T3 and slow T3 lines. Buying/Selling opportunities above/below cloud. The fast and slow T3 MA lines can also be used as dynamic support/resistance for more aggressive entries. Use default values for best settings. The number of look back bars is user defined. This indicator can be used in combination with other strategies such as price action. Suitable for all time frames. Prerequisites: T3IndiSlow and T3IndiFast in
FREE
Future WPR - будущий WPR или обратный WPR - это модификация индикатора WPR: он использует стандартную формулу, но применяет ее в обратном направлении. Индикатор вычисляет WPR справа налево, то есть из будущего в прошлое. Он 'знает' и обрабатывает будущие движения цен на всех барах, где доступная справа история содержит достаточное количество следующих баров, а именно period и более баров. Обычный WPR также отображается для справки. WPR и обратный WPR приведены к диапазону [0..1] как более удобно
FREE

Адаптивная скользящая средняя (Adaptive Moving Average, AMA) разработана Перри Кауфманом и представляет собой разновидность скользящей средней с низкой чувствительностью к рыночному шуму и волатильности в сочетании с минимальным запаздыванием для обнаружения тренда. Эти характеристики хорошо подходят для определения общего рыночного тренда, поворотных моментов и фильтрации цен. Подробности расчета AMA можно найти в справке по MetaTrader 5 ( https://www.metatrader5.com/ru/terminal/help/indicators
FREE

Abiroid Multi Slope indicator allows you to calculate a Slope Histogram for any line of any indicator . Histogram is for 1 slope line only, but slope values can be calculated for 3 lines total. To have multiple histograms, add as many Slope indicators for custom indicators as you like on chart. You just need to provide the Indicator name, buffer value, slope's period and max number of bars back. By default it has slope calculation for TDI_v4.ex4 indicator. There is no way to specify parameters f
FREE

Индикатор показывает разность цен открытия и закрытия. Индикатор в отдельном окне - это разность цен открытия текущего бара с ценой закрытия предыдущего бара. Табло в верхнем левом углу - это разность цен открытия и закрытия текущего бара.
Настройки Count_Bars - количество баров для отображения данных индикатора, при 0 отображается на всех доступных барах; display - включить отображение цифровых значений; _fontsize - размер шрифта для индикатора в отдельном окне; color_up - цвет положительных
FREE

Первым 5-ти покупателям за --> 45.99$;
The Cat Trend VZ - постоянно усовершенствующийся индикатор, обладающий точными и прибыльными сигналами на вход.
Линия индикатора The Cat Trend VZ меняет цвет в зависимости от направления тренда , а в точках разворота цены индикатор рисует стрелки. Кроме того, в индикаторе The Cat Trend VZ реализованы звуковой и текстовый алерт о появлении стрелки. ВАЖНО: ИНДИКАТОР НЕ ПЕРЕРИСОВЫВАЕТСЯ.
Основные характеристики The Cat Trend VZ : Аналитические
FREE

Fast T3 MA Trend indicator derived from T3 moving averages. This indicator is part of the T3 Cloud MA indicator and is posted here on its own. Buying/Selling opportunities above/below line. The MA line can also be used as dynamic support/resistance for more aggressive entries. Use default values for best settings. The number of look back bars is user defined. This indicator can be used in combination with other strategies such as price action. Suitable for all time frames.
FREE

O Chart Control é um indicador que permite de forma rapida e pratica alterar o timeframe e ativo do grafico, possibilitando que voce possa fazer todas as suas analises em apenas um grafico sem precisar abrir vários, além disso voce pode escolher o entre os temas claro e escuro para o qual melhor se adapta a sua preferencia.
MT5: https://www.mql5.com/pt/market/product/109444
FREE

PLEASE HELP REVIEW/ SUPPORT/ SHARE THIS OTHER INDICATOR HERE https://www.mql5.com/en/market/product/51637 AS YOU DOWNLOAD THIS ONE FOR FREE. THANKS.
The indicator was created to make trading very easy to understand. It is based on five moving average crosses and pivot points. Download the "EASY TREND" on my Product list for a more advanced and profiting trades. You can trade with this indicator alone and get the maximum out of the market. If you are a new trader, just open your chart windo
FREE

The Candle High Low Exit indicator uses the highest high and the lowest low of a range to draw trailing stop lines (orange under buys, magenta over sells) that advance with the trend until the trend changes direction. Moreover, the trailing stop lines are generated to support the order’s trend direction (long or short): In an upward trend, the long trailing stop line (orange line under buy) appears and advances upward until the close crosses under the line.
In a downward trend, the short tra
FREE

Risklimiter
Limit your risk with this dynamic stop loss indicator. It will show you exactly where to place your initial stop & subsequent stops as the price goes in your favour. Works on any time frame as well as any symbol. It is not restricted in any way nor does it need optimisation. Simply drag and drop on to a chart for it to display a stop loss. You may find at times, it shows a stop on the other side of your trade, this will change as soon as price closes above/below it.
DOES NOT RE
FREE

The “ Ticks Overcome Signal ” indicator, as outlined in your provided code, is a custom tool designed for use with MetaTrader 4 (MT4), a popular platform for Forex trading. This indicator seems to focus on tracking the momentum and direction of price movements by counting consecutive up and down ticks. Here’s an overview of the psychological aspects, logic benefits, and usage instructions for this indicator on MT4: Decision Support : Traders often face psychological challenges in decision-making
FREE

Треугольные арбитражные возможности RedeeCash показывают доступные валютные триады и настройки каждой валютной торговой позиции в виде глобальной переменной в формате
ААА/ВВВ, ССС/ААА, ССС/ВВВ: ААА/ВВВ -1|0|1
ААА/ВВВ, ССС/ААА, ССС/ВВВ: ССС/ААА -1|0|1
ААА/ВВВ, ССС/ААА, ССС/ВВВ: ССС/ВВВ -1|0|1
где значение представляет собой направление сделки OP_BUY или OP_SELL. Если направление торговли указывает -1, то для этой валютной пары не должно происходить никаких сделок.
Треугольная арбитражн
FREE
Данный индикатор - реализация принципа "Один выстрел - одно попадание". В ходе работы по созданию данного продукта сделана попытка достичь максимального баланса между чувствительностью индикатора и результативностью его сигналов. Данный инструмент надежен и результативен как револьвер 45 калибра, но точно так же требует от своего пользователя дисциплины и понимания условий и цели применения. Индикатор имеет лишь один настраиваемый параметр, определяющий его чувствительность, что сильно упрощает
FREE
Представленный индикатор на новом уровне реализует идею, заложенную в классические индикаторы Bulls и Bears. Данный индикатор отображает разность максимальной и минимальной цен за текущий период времени и значений канала, построенного по максимальным и минимальным ценам, сглаженным по методу Лягерра. Рост значений индикатора выше нуля говорит о том, что максимальная цена за текущий период больше среднего значения максимальных цен. Такая ситуация в большинстве случаев говорит о росте стоимости ак
FREE

Индикатор iSTOCH in iMA применяет изменения стохастика к iMA. Изменения отражаются соответствующим цветом скользящей средней. Индикатор позволяет легко увидеть верхние и нижние стороны стохастика.
Параметры MA_Periods - период iMA. MA_Method - метод iMA. K_Period - период линии K. D_Period - период линии D. Slowind - замедление. STOCH_MA_METHOD - метод усреднения для MA. PriceField - цена (Low/High или Close/Close). STOCH_LevelUp - уровень восходящего тренда. STOCH_LevelDn - уровень нисходящег
FREE

Индикатор рассчитывает угол наклона между ближайшими максимумами, минимумами и закрытиями (по high/low/close соседних баров). Измерение угла возможно в градусах или в радианах. В подокне рисуется линейный график или гистограмма. Можно указать масштаб для расчета — плавающий или фиксированный. Для использования в советниках или других индикаторах обязательно указывать фиксированный масштаб.
Параметры Angular measure — измерение угла в градусах или радианах. Scale mode for calculation — режим ма
FREE
Индикатор ADR ST patterns является модификацией классического индикатора ADR . Этот простой индикатор соответствует параметрам ST patterns Strategy ( https://stpatterns.com/ ) . Structural Target patterns по своей сути и есть сам рынок, последовательно разделенный на составляющие. Для формирования ST patterns не нужны линии тренда, геометрические пропорции самой модели, объем торгов или открытый рыночный интерес. Они легко распознаются и строятся только на основании факта пробития фрактальных у
FREE

The Sextet is an MT4 indicator that displays 6 levels of Moving Averages, where the second is the moving average of the first, the third of the second, and so on. It gives a signal when all the moving average levels align in order. Get a Free Sextet EA, and read discussions about using The Sextet Indicator on Forex Factory:
The Sextet EA @ Forex Factory Check out the The Sextet Scalper Pro for a more elaborate scalping strategy also with Free EA . Key Features: Is a Moving Average of a Movi
FREE
Highly configurable Force Index indicator. Features: Highly customizable alert functions (at levels, crosses, direction changes via email, push, sound, popup) Multi timeframe ability Color customization (at levels, crosses, direction changes) Linear interpolation and histogram mode options Works on strategy tester in multi timeframe mode (at weekend without ticks also) Adjustable Levels Parameters:
Force Index Timeframe: You can set the current or a higher timeframes for Force Index. Force In
FREE
Представленный индикатор подает сигналы о выходе цены за пределы Donchian channel, а также о возращении цены в канал. Donchian channel - технический индикатор, разработанный Ричардом Дончяном, является вариацией правила пробоя торгового интервала. Строится взятием самой высокой (максимума из High) и самой низкой (минимума из Low) цены за предыдущие n периодов с последующим обозначением области между ними на графике. Дончян рекомендовал использовать свой индикатор для дневных таймфреймов с интерв
FREE

This indicator does not process the price chart data and does not provide trading signals. Instead, it is an application to compute and display the frequency response of many conventional indicators. Moving averages like the SMA, LWMA and EMA, and oscillators like the MACD, CCI, Awsome Osc, all have the form of digital filters. Electronic engineers use a special method to characterise the performance of these filters by studying their frequency response. Two important quantities of the frequ
FREE

This creative simple indicator will provide a precise framework for market sentiment within technical analysis of different timeframes. For instance, for traders like me that uses "Mark Fisher" strategy regularly, this is a perfect indicator for having an insight to markets from short term to long term point of view, using Break points of candles' lows and highs and perfect to combine with "Price Action" . For more options and modifications you can also edit the low timeframe candles withi
FREE
This indicator displays the moment when the MFI oscillator crosses its smoothed value. If the MFI oscillator crosses its smoothed value, it is a signal of a trend change. The signal is given after the end of the formation of the candle. The signal is confirmed when the price crosses the high/low of the bar on which the signal was given. The indicator does not redraw.
Custom Parameters: MFI_Period (>1) - MFI indicator period; MA_Period - period for smoothing MFI indicator values; MA_Method - me
FREE

Volume Cross Over is an indicator that measure positive and negative volume flow in a financial instrument, such as a stock, commodity, or index. It is base on the idea of On-Balance Volume developed by Joseph Granville. However instead of trending lines, this indicator shows volume cross over. When the closing price of an asset is higher than the previous closing price, then the Bull volume is greater than zero and Bear volume is negative. It suggests that buying volume is dominating, a
FREE

This indicator is designed to find the difference in MOMENTUM price and indicator. This indicator shows the price and indicator difference on the screen. The user is alerted with the alert sending feature. Our Popular Products Super Oscillator HC Cross Signal Super Cross Trend Strong Trend Super Signal Parameters divergenceDepth - Depth of 2nd ref. point search Momentum_Period - Second calculation period indAppliedPrice - Applied price of indicator indMAMethod - MA calculation method findEx
FREE
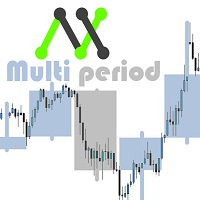
С помощью этого настраиваемого индикатора вы сможете наблюдать другие таймфреймы, кроме обычного. Таким образом, вы узнаете лучше общей среде, в которой цена движется и, вероятно, будет лучше вашей эффективности. «Важно, чтобы таймфрейм в индикаторе был больше, чем в Metatrader. Я посвясь больше показателей бесплатно в ближайшее время. Если у вас есть какие-либо конкретные идеи индикатора, который вы хотите иметь, вы можете написать мне личное сообщение напрямую. Мнения, обзоры, предложения прин
FREE

Macd Predictor Macd's main chart indicator If you like this indicator , Dinapoli Levels Expansion and Retracement Demo is a helpful tool: https://www.mql5.com/en/market/product/35884
1. You can determine the price at which the MACD will change from buy to sell, and vice versa. It is the cousin of the oscillator predictor. If you know a position at the time, then the exact price, current and next (future) columns will need to reach the MACD crossover. You can also see how far the market has t
FREE

ADR 10 mostra l'intervallo medio di pips di una coppia Forex, misurato su un numero di 10 giorni . I traders possono utilizzarlo per visualizzare la potenziale azione dei prezzi al di fuori del movimento medio giornaliero.
Quando l'ADR è al di sopra della media, significa che la volatilità giornaliera è superiore al normale, il che implica che la coppia di valute potrebbe estendersi oltre la sua norma.
L'ADR è utile anche per il trading di inversioni intraday. Ad esempio, se una coppia di
FREE

For traders, monitoring price movements is a constant activity, because each price movement determines the action that must be taken next. This simple indicator will helps traders to display prices more clearly in a larger size. Users can set the font size and choose the color that will be displayed on the chart. There are three color options that can be selected to be displayed on the chart.
FREE

This indicator works on this way: Trader should provided the n period "Number of Candle" ( the default period is 6) Then the indicator will calculate the number of pips in the last n period (not the current candle) And that is display on the chart With that the should confirmed his up trend or down trend analyse according to the number of pips in the last n candles( bullish or bearish) he has provided
FREE

This indicator determines minimum volumes needed during a candle formed so that it would be higher than current volume's average. Although you can place MAs on your volume indicator, this indicator has non-repaint characteristic so you may not to worry about sudden volume increase. This indiator also draw volume indicator for its own. Input Description: period: Period used for indicator. Must be higher than 1. Output Description: VolumeXover: This indicator's main feature. During the time the vo
FREE

Индикатор MQLTA Support Resistance Lines вычисляет исторические уровни поддержки и сопротивления и отображает их на графике в виде линий. Он также отправит оповещение, если цена находится в опасной/безопасной зоне для торговли, и покажет расстояние до следующего уровня. Индикатор идеально подходит для использования в советниках через функцию iCustom. Данная демо-версия работает только на паре AUDNZD. Полная версия доступна по ссылке: https://www.mql5.com/ru/market/product/26328
Как он работает
FREE

Индикатор MACD Multi Time Frame позволяет обнаруживать дивергенции на старших таймфреймах во время поиска точных точек входа на младших таймфреймах. Эта бесплатная версия индикатора работает только на EURUSD и GBPUSD. Полная версия здесь: MACD Multi Time Frame Загляните в мой блог REAL-TIME MACD Divergence Analysis, в котором в открытом доступе представлены советы о торговле на дивергенциях: REAL-TIME MACD Divergence Analysis (на английском).
MACD Multi Time Frame предоставляет хороший обзор си
FREE
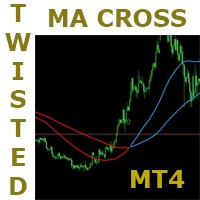
This is a very simple but very powerful strategy. It has a lot of potential. This strategy is based on the popular moving average crossover but with a very interesting twist to it. It has some mechanisms to delay signals untill direction is clear and confirmed. Follow the indication colors and arrows for trade ideas It has a potential winning rate of somewhat greater than 70%. Try it in all timeframes and determine which one is good for you. ===========
FREE

The indicator is based on the concept of price channels, which are formed by plotting the highest high and lowest low prices over a specified period of time. The Donchian Channel Indicator consists of three lines: an upper channel line, a lower channel line, and a middle channel line. The upper channel line represents the highest high over a specified period, while the lower channel line represents the lowest low. The middle channel line is the average of the two and can be used as a reference f
FREE

Supertrend Moving Average A combination of Supertrend and Moving Average to create a converging trade setup Input parameters: signal mode: set it to true if you want to plug it into STAT (Signal Tester and Trader) arrow shift: distance between fast EMA line to arrow on chart turn on price line filter turn on moving average signal for converging setup k period d period s period averaging method Moving average period Averaging method upper level limit (Stochastic) lower level limit (Stochastic)
FREE

Популярный сигнальный индикатор отмечающий точки покупки/продажи. В данной версии дополнен точками оптимального SL. Рекомендуется к применению совместно с индикатором тренда, для фильтрации сигналов. Индикатор имеет лишь один настраиваемый параметр, определяющий его чувствительность, что сильно упрощает настройку индикатора к текущему рынку и стилю торговли пользователя. Сигналы индикатора подаются только после полного формирования бара. Индикатор может быть использован для торговли на любом ры
FREE

MASi Three Screens основан на торговой стратегии Доктора Александра Элдера. Данный индикатор является сборником алгоритмов. Алгоритмы основаны на анализе графиков нескольких таймфреймов. Вы можете применить любой из предоставленных.
Список версий алгоритмов ThreeScreens v1.0 - Простая реализация, с анализом MACD линии; ThreeScreens v1.1 - Простая реализация, с анализом MACD гистограммы; ThreeScreens v1.2 - Совмещение двух первых алгоритмов в одной версии; ThreeScreens v1.2.1 - В алгоритм внедр
FREE

Intro to APAMI, PROfessional edition Trace exactly how far prices trend between two price levels with fractional pip precision, while qualifying price movement between the same price levels.
Completely automate when trends change direction and volatility, without any lag . This is possible because the Accurate Price Action Measurement Indicator (APAMI) actually does what no other indicator can: measure price distance between two points and simultaneously qualify the price action that occurs

Проверьте это, и если вам это нравится, просто наслаждайтесь этим. Попробуйте различные значения, чтобы найти параметр, который лучше всего подходит для вашей торговли. Восходящий сигнал, если индикатор окрашен зеленым газоном и медвежьим сигналом, если индикатор серый. Вы можете использовать сам линию для задней остановки при открытии ордеров. Это всего лишь инструмент. Дополнение. Это не стратегия. Объедините его с собственным анализом Просто скачайте его и попробуйте, это бесплатно.
FREE

Introducing CCI Jurik—a dynamic indicator designed to elevate your forex trading experience by integrating custom moving averages based on the Commodity Channel Index (CCI) with the MetaTrader 4 indicator, CCI.
Jurik moving averages are renowned for their accuracy and reliability in analyzing price movements in the forex market. They offer traders a smoother representation of price action, reducing noise and providing clearer signals for identifying trends and potential reversals.
The Commo
FREE
Целью этой новой версии стандартного MT4 индикатора, входящего в поставку платформы, является отображение в подокне нескольких таймфреймах одного и того же индикатора. См. пример, приведенный на рисунке ниже. Однако индикатор отражается не как простой индикатор MTF. Это реальное отображение индикатора на его таймфрейме. Доступные настройки в индикаторе FFx: Выбор таймфрейма для отображения (от M1 до MN) Установка ширины (количество баров) для каждого окна таймфрейма Всплывающее оповещение/звуков
FREE
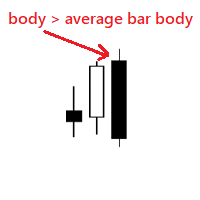
Very simple indicator that shows if body of a new bar is bigger than the average bar body. We can use the indicator to notice bars that are bigger than usual, for example this could mean a new trend. Input params: history bars to display from how many bars to get the average bar body To calculate only bars from the same type distance for the dots bull color bear color dot size
FREE

Индикатор ищет самые большие свечи с минимальными тенями за последние Х свечей. Иногда такие свечи обозначают сильного покупателя, который быстро и сильно толкает цену в нужную сторону. Но чаще всего это кульминационные свечи, особенно в конце затянувшегося тренда, когда одной большой свечой выбивают стоп-лоссы самых стойких трейдеров и цена мгновенно разворачивается. Индикатор позволяет открыть позицию на самом краю рынка, в контртренд с минимальным стопом, за кульминационную свечу. Стоп-лоссы
FREE
Highly configurable Demarker indicator.
Features: Highly customizable alert functions (at levels, crosses, direction changes via email, push, sound, popup) Multi timeframe ability Color customization (at levels, crosses, direction changes) Linear interpolation and histogram mode options Works on strategy tester in multi timeframe mode (at weekend without ticks also) Adjustable Levels Parameters:
Demarker Timeframe: You can set the lower/higher timeframes for Demarker. Demarker Bar Shift: Y
FREE

The dashboard should help to get a quick overview of the correlations of different assets to each other. For this, the value series are compared according to the Pearson method. The result is the value of the correlation (in percent). With the new single asset mode, you can immediately see which symbols have the highest positive or negative correlation. This prevents you from accidentally taking a risk on your trades with highly correlated symbols. Usage There are different methods for the corre
FREE

Smart Trend Line Alert Demo - это профессиональный индикатор трендовых линий, а также линий поддержки/сопротивления с функцией алерта. Он призван помочь трейдерам легко управлять многими графиками и символами без постоянного слежения за монитором. Примечание: данная демо-версия работает только на USDCHF . Ссылка на полную версию: https://www.mql5.com/ru/market/product/3085
Особенности Оповещение о пробое свечи, о касании ценовых линий и оповещения по времени; Превращение только что построенной
FREE

Hello. Another free indicator from Sepehr! ;) You can determine the trend with this tool. Using crosses of two Moving averages, you can say that the trend is going to be bullish or bearish; A fast-moving average and a slow one. When the fast-moving crosses up the slow-moving, it's going to be an uptrend and when it crosses down the slow-moving, it means that you are going to have a downtrend. That's easy ;) Hope to enjoy it Sepehr(Faran)
FREE

RaysFX StochRSI Presentiamo un indicatore MQL4 sviluppato da RaysFX, un rinomato sviluppatore nel campo del trading algoritmico. Questo indicatore è una combinazione semplice ma potente di due indicatori popolari: RSI e Stocastico. Caratteristiche principali: RSI : Un indicatore di momentum che misura la velocità e il cambiamento dei movimenti dei prezzi. Stocastico : Un indicatore di momentum che confronta il prezzo di chiusura di un titolo con la gamma dei suoi prezzi durante un certo periodo
FREE

Индикатор Accurate Gold - это удобный инструмент, который интуитивно понятен и прост в использовании, независимо от уровня опыта трейдера. Он предназначен для трейдеров, ищущих точные сигналы на временном интервале M5 на рынке золота. Этот индикатор использует передовые математические алгоритмы для анализа движения цен и динамики объема, генерируя точные сигналы на покупку и продажу. Отличительные особенности этого индикатора, включая его нерепейнтовый характер, предоставляют трейдерам ценные и

Мультивалютный индикатор является версией Lite индикатора Cosmic Diviner Reversal Zone Pro. Индикатор создан на основе авторских формул анализа волатильности и силы движения цены. Это позволяет гибко определять перекупленность и перепроданность торговых инструментов, и самостоятельно задавать уровни входа в сделки на покупку либо продажу, когда перекупленность либо перепроданность торгового инструмента достигает заданного пользователем процента. Огромным плюсом Reversal Zone Lite является наличи

High, Low, Open, Close — не многовато? Иногда нужно иметь однозначную историю котировок. Но, выбирая что-то одно, теряешь остальное. Без потерь не получается и при сглаживании. Причем, часто теряется один из самых важных для рынка моментов: информация об экстремумах. Именно благодаря сохранению информации и о максимумах, и о минимумах, правильным "сглаживанием" для истории котировок являются зигзаги. Но и у них есть недостаток — отсутствуют промежуточные значения. Индикатор Price Line решает эту
FREE
MetaTrader Маркет - единственный магазин, где можно скачать демоверсию торгового робота и подвергнуть его проверке и даже оптимизации на исторических данных.
Прочитайте описание и отзывы других покупателей на заинтересовавший вас продукт, скачайте его прямо в терминал и узнайте, как протестировать торгового робота перед покупкой. Только у нас вы можете получить представление о программе, не заплатив за неё.
Вы упускаете торговые возможности:
- Бесплатные приложения для трейдинга
- 8 000+ сигналов для копирования
- Экономические новости для анализа финансовых рынков
Регистрация
Вход
Если у вас нет учетной записи, зарегистрируйтесь
Для авторизации и пользования сайтом MQL5.com необходимо разрешить использование файлов Сookie.
Пожалуйста, включите в вашем браузере данную настройку, иначе вы не сможете авторизоваться.