Смотри обучающее видео по маркету на YouTube
Как купить торгового робота или индикатор
Запусти робота на
виртуальном хостинге
виртуальном хостинге
Протестируй индикатор/робота перед покупкой
Хочешь зарабатывать в Маркете?
Как подать продукт, чтобы его покупали
Технические индикаторы для MetaTrader 4 - 17

FREE UNLIMITED PM : https://linktr.ee/ARFXAUTOTRADE?utm_source=linktree_admin_share
Bagaimana Cara membaca market melalui FMCBR-W - Didalam dunia trading ini pelbagai cara digunakan oleh trader dan penganalisa market membaca dan memahami trend. - Dari sudut FMCBR permulaan trend atau permulaan pullback dikenali melalui CB1. Apa pun dari sudut FMCBR-W trend didefinasikan melalui 3 combinasi yang saya akan kupas di muka surat seterusnya nanti. - Saya amat berharap agar pengunaan FMCBR-W nanti
FREE

For some trader's charts analysis use, specially for multi timeframe trading strategies . When you need to check something of the time within different timeframe at the same symbol chart, even different symbol charts, this indicator will show the crosshair at sync moving. You just need to load this indicator into some charts, then the crosshair will shown automatic.
FREE

Индикатор PipTick Pivot автоматически рассчитывает и отображает линии уровней разворота, а также уровни поддержки и сопротивления. Уровень разворота может рассчитываться по разным формулам: классическая, Floor, Fibonacci, Woodie, Camarilla или DeMark. Можно выбрать период для расчета индикатора. Период может быть дневным, недельным, месячным или пользовательским.
Типы пивотов: Классический. Floor. Fibonacci. Woodie. Camarilla. DeMark.
Основные характеристики Индикатор показывает текущие и ис
FREE

Indicatorul MOTANO
Bună ziua!
Tocmai am terminat indicatorul MOTANO după multă muncă.
Este un indicator de săgeată.
Merge perfect pe M15, aproape orice pereche.
Săgețile indică intrările de cumpărare și vânzare, iar o țintă de profit de 5,10 sâmburi asigură un profit sigur.
Un profit și mai mare poate fi stabilit, în funcție de situație.
Dar cuvintele sunt de prisos.
Testați-l și trageți propriile concluzii. Indicatorul MOTANO nu revopsește. Rezultate foarte bune pe GBPUSD - M1.
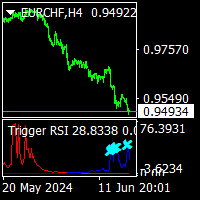
Trigger RSI is a no repaint trend indicator. it can use all pairs and all time frames. easy for use beginner and experienced tarders. it put aqua and gold point on histograms. if aqua point on the blue histogram that is buy signal. if gold point on the red histogram that is sell signal. cnt value has been set to default 1000. you can increase it to see back signals.if there is enough bars on charts. minimum value cnt is 500.
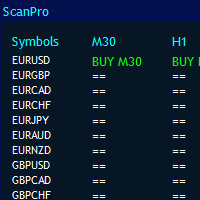
MT4 Universal Panel pro предназначен для всех индикаторов и таймфреймов, включая файлы ex4.
Он может сканировать неограниченное количество пар в зависимости от мощности вашего компьютера и до 10 временных рамок. Размер панели будет изменен автоматически.
вы можете вызвать любой индикатор по буферам.
Работает со всеми стандартными и пользовательскими индикаторами. Вы можете просто использовать его для хейкан аши, RSI, параболики, ренко, фракталов, поддержки сопротивления, спроса на пре

Equal Highs and Lows Indicator
Find and Mark Equal Highs and Lows on chart of Selected Multi Time frames. Options:
set min and max bars between Equal High's / Low's bars set max points difference between High's / Low's ( Sensitivity )
Select time frames by buttons on chart Select / Filter only High's or Low's by a button Extend Equal High's / Low's line forward for chart reference
Manual
MT4 version
MT5 version
Other Indicators

This indicator is designed to make reviews of many charts on different timescales quicker, and easier to do. Track Time and Price across multiple charts Change Symbol on one chart and all other charts of the same symbol will be changed too. Easy to use, quick to master The indicator allows you to identify the price and time where the mouse pointer is on the current chart, across all other charts open on the same Symbol. This allows you to quickly see information on multiple charts whereas normal

Измеритель силы валюты дает вам краткое наглядное представление о том, какие валюты в настоящее время сильны, а какие - слабые. Измеритель измеряет силу всех кросс-пар форекс и применяет к ним вычисления для определения общей силы для каждой отдельной валюты. Мы рассчитываем силу валюты на основе тренда 28 пар.
Зайдя в наш блог MQL5, вы можете скачать бесплатную версию индикатора. Попробуйте перед покупкой без ограничений тестера Metatrader: нажмите здесь
1. Документация Вся документа

Introducing our A.I Currency Strength Meter Forex Indicator, a state-of-the-art tool designed to provide forex traders with real-time insights into the strength of various currencies. Leveraging the latest advancements in artificial intelligence and machine learning, this innovative indicator analyzes market data in real-time, providing users with accurate and up-to-date information to inform their trading decisions. In addition to its cutting-edge algorithms, the Currency Strength Meter Forex I

Imbalance / FVG MTF Mark Imbalance on chart of Selected Multi Time frames. Trend is Manually set to filter signals in the chosen direction by a button on the chart. .
Futures Auto Mark Imbalance / FVG on chart on selected time frames
Select time frames by buttons on chart
Popup Alert, Push Notification or email when New Imbalance Form
Popup Alert, Push Notification or email when Imbalance is Taken out
Select Alert Mode to be a single or multiple Imbalance ( OR / AND option ) when Imbalan

Two Period RSI + Alerts сравнивает долгосрочные и краткосрочные линии RSI и запоняет цветом область между ними для лучшей визуализации. Цвет зависит от тренда – восходящего (краткосрочный RSI выше долгосрочного) или нисходящего (краткосрочный RSI ниже долгосрочного). Пересечение линий RSI является сильным подтверждающим сигналом. Это небольшой инструмент для визуализации и подтверждения трендов RSI. Надеемся, он будет вам полезен!
Алерты Для перечисленных ниже событий предусмотрены звуковые ал

Relative Volume or RVOL is an indicator that averages the volume of X amount of days, making it easy to compare sessions volumes.
The histogram only has 3 colors:
Green - Above average volume
Yellow - Average volume
Red - Below average volume
The default setting is 20 days, which corresponds more or less to a month of trading.
With the data obtained from this indicator you can better gauge the commitment behind a move. For example, you will be better equipped to judge if a bre
FREE

Индикатор дает сигналы на покупку или продажу по индикатору Parabolic SAR, а также в нем прописаны стратегии с Moving Average. Есть алерты и оповещения в мобильный терминал и на почту. Стрелки рисуются на графике после подтверждения сигнала. Они не перерисовываются. Рекомендую посмотреть моего советника - Night Zen EA
Чтобы быть в курсе последних моих продуктов и идей, присоединяйся к моему telegram каналу и подписывайся на профиль. Ссылка в контактах моего профиля - Мой профиль Индикатор
FREE

Дневные ровни разворота достаточно важны в торговле. Данный индикатор позволяет выбрать четыре часто используемых типа расчета пивотов.
Входные параметры Выберите тип расчета точек разворота (Method Classic, Method Camarilla, Method TomDeMark или Method Fibonacci) Выберите таймфрейм, используем для расчетов (M5, M15, H1, H4, D1, W1 и т.д.) Можно запускать на любом таймфрейме Настройте цвет пивотов
FREE

The Candle Countdown Timer for MetaTrader 4 (also available for MT5) is a vital indicator designed to help you manage your trading time effectively. It keeps you updated about market open and close times by displaying the remaining time before the current candle closes and a new one forms. This powerful tool enables you to make well-informed trading decisions. Key Features: Asia Range: Comes with an option to extend the range. Broker Time, New York, London Time: Displays the current broker time
FREE

Динамический канал. Ширина канала автоматически изменяется в зависимости от движения цены. Чем сильнее отклонение от середины канала, тем шире становятся границы. Индикатор подстраивается под движения на заданном вами участке графика (параметр "Bars for calculations"). Соответственно если цена сделала резкое колебание на заданном промежутке, то канал расширится, ожидая дальнейшие сильные колебания. То есть его параметры всегда будут соответствовать текущей ситуации на рынке. Канал не предназначе
FREE

Индикатор технического анализа Turbo Trend, который определяет направление и силу тренда, а также сигнализирует об изменении тренда. Индикатор показывает точки потенциального разворота рынка. Интеллектуальный алгоритм индикатора точностью определяет тренд. Использует всего один параметр для настроек. Индикатор построен для простого и эффективного визуального обнаружения тренда с дополнительным фильтром сглаживания. Индикатор не перерисовывается и не запаздывает. Тейк-профит больше стоп-лосса в

updated hidden market support and resistance. this indicator is made for new current market that has new support and resistance that some traders struggle to see. The indicator works on all timeframes from the 1-minute timeframe to the monthly One Trading tip to use When price is at resistance and the indicator appears wait for a bearish candle to close then enter a sell trade. Same applies for a buy trade when price reaches support level, and the indicator appears wait for the bullish candle
FREE

BinaryFortune - индикатор, разработан и адаптирован специально для торговли краткосрочными бинарными опционами. Алгоритм индикатора, прежде чем выдать сигнал анализирует множество факторов. Устанавливается индикатор обычным способом. Сам индикатор состоит из информационного окна, где отображается имя торгового инструмента, уровни поддержки и сопротивления, непосредственно сам сигнал ( BUY , SELL или WAIT ). Появление торгового сигнала сопровождается также звуковым сигналом и окном Alert. Преиму
FREE

Индикатор First RSI level создан для анализа и отображения на ценовом графике уровня, на котором произошло первое пересечение максимального или минимального значения стандартного индикатора RSI, для последующего определения сильных тенденций. Индикатор позволяет отслеживать начало тенденции, не подчиняющейся сигналам стандартной стратегии торговли по индикатору RSI. Когда, к примеру, после достижения уровня перепроданности, цена идет не вверх, а устремляется вниз, тем самым как бы "продавливая"
FREE

A Swing Failure Pattern ( SFP ) is a trade setup in which big traders hunt stop-losses above a key swing high or below a key swing low for the purpose of generating the liquidity needed to push price in the opposite direction. When price 1) pierces above a key swing high but then 2) closes back below that swing high, we have a potential bearish SFP . Bearish SFPs offer opportunities for short trades. When price 1) dumps below a key swing low but then 2) closes back above that swing low, we have

MT4. Многофункциональный индикатор автоматически определяет и рисует волновые каналы, а также линии поддержки и сопротивления. Показывает тренд младшего периода и границу пробоя старшего. Это не стандартный канал. Работает совершенно по новому принципу. В алгоритм построения канала заложен принцип закона золотого сечения. Работает на графиках любого инструмента. Для лучшего восприятия каналы окрашены в разные цвета. канал с синим фоном - основной вверх. канал с красный фоном - основной канал

This indicator is used to measure bullish and bearish candles on each time frame and I provide notifications for reminders
Indikator ini digunakan untuk mengukur bullish dan bearish candle pada setiap time frame dan saya berikan notifikasi untuk pengingat
This indicator is used to measure bullish and bearish candles on each time frame and I provide notifications for reminders
FREE

PipTick Heiken Ashi - это наша версия индикатора Heiken Ashi. В отличие от конкурирующих продуктов, этот индикатор предлагает широкие возможности для расчета свечей Heiken Ashi. Он может отображаться в классическом или сглаженном виде. Данный индикатор рассчитывает Heiken Ashi со скользящей средней четырьмя способами: SMA - простая скользящая средняя SMMA - сглаженная скользящая средняя EMA - экспоненциальная скользящая средняя LWMA - линейно-взвешенная скользящая средняя
Основные характеристи
FREE

Based on famous and useful indicator - Super Trend, we add some features to make this Indicator much easier to use and powerful. Ease to identify the trend of any chart. Suitable for both Scalping & Swing Better to use in the trending market be careful in sideway market, it might provide some fake signals Setting: ATR Multiplier ATR Period ATR Max Bars (Max 10.000) Show UP/DOWN node Nodes size Show Pull-back signals Pull-back filter ratio Period of MA1 Mode of MA1 Period of MA2 Mode of MA2 A
FREE

TrendExpert Indicator Overview
The TrendExpert indicator is designed to identify and visualize trend zones in financial markets. It utilizes zigzag high and low points to determine support and resistance levels, providing insights into potential market reversals and continuation patterns.
Features - Detection of support and resistance zones based on price action. - Strength categorization (Proven, Verified, Untested, Turncoat, Weak) based on historical testing. - Adjustable parameters fo
FREE

Индикатор отображает в виде стрелок пересечение индикатора Скользящая Средняя Осциллятора (Moving Average of Oscillator, OsMA) нулевого уровня. Индикатор является мультитаймфреймовым и отображает сигналы с других временных интервалов В индикаторе есть уведомление при появлении сигнала - всплывающее окно (Alert), отправка на EMail.
Параметры Time-frame - Выбор временного интервала для отображения сигналов индикатора. Fast EMA Period - Быстрое EMA – скользящая средняя от цены, экспоненциального
FREE

Asesor Experto "Sniper FX": Precisión Milimétrica para Tus Operaciones El asesor experto "Sniper FX" redefine la precisión en el trading automatizado al ofrecer un enfoque estratégico centrado en pocas, pero extraordinariamente precisas, entradas en el mercado. Inspirado por la agudeza de un francotirador, este asesor experto utiliza algoritmos avanzados para identificar oportunidades óptimas de compra y venta, maximizando el potencial de beneficios mientras minimiza la exposición al mercado.
FREE

Это усредненный указатель класса, основанный на пользовательском алгоритме алгоритма, в соответствии с диапазоном цветов, помеченных вверх и вниз, может быть открыт или закрыт, чтобы подсказать, что в настоящее время следует повесить покупку или продажу.
описание списка параметров:
Extern int Price = 0; / / indicator начальный расчет средней цены
Extern int Length = 20; / / indicator вычисляет средний период, эквивалентный среднему периоду MA.
Extern int Displace = 0;
FREE
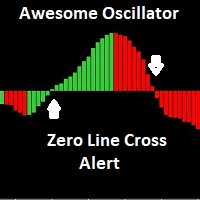
The Awesome Oscillator (AO) is an indicator used to measure market momentum. AO calculates the difference between a 34 Period and 5 Period Simple Moving Average. The Simple Moving Averages that are used are not calculated using closing price but rather each bar's midpoints. This indicator has email and pushup "mobile" features Alert, for any suggestions, please don't hesitate, thanks
FREE

This indicator is a professional Trend identifier, it measures the angle or slope of moving averages with different methods. As this indicator calculate angles you can identify the strength of trend by magnitude of angle. It also shows if angle is increasing or decreasing which gives you the opportunity to make more information about current trend. You can combine this indicator with your strategy as a filter or you can use it alone to make your trading system. This is not a repainting indicator
FREE

Существует огромное количество свечных моделей, но действительно знать нужно только некоторые из них. Индикатор Candlestick Pattern Filter распознает и выделяет наиболее надежные свечные паттерны. Учтите, что эти паттерны могут быть полезны, только если вы понимаете, что происходит в каждом из них. Для наилучших результатов их следует использовать совместно с другими формами технического анализа. Включены следующие модели: Молот / Повешенный Перевернутый молот / Падающая звезда Бычье / медвежье
FREE

*This is tradingview indicator converted to mql5*
The Trend Magic Indicator is a popular technical analysis tool used to identify the direction of a market trend and potential trend reversals. It is a versatile indicator that can be applied to various financial instruments and timeframes. The Trend Magic Indicator consists of a combination of moving averages and a volatility-based filter. It aims to smooth out price fluctuations and provide a clearer visualization of the underlying trend. He
FREE

Highly configurable Macd indicator.
Features: Highly customizable alert functions (at levels, crosses, direction changes via email, push, sound, popup) Multi timeframe ability Color customization (at levels, crosses, direction changes) Linear interpolation and histogram mode options Works on strategy tester in multi timeframe mode (at weekend without ticks also) Adjustable Levels Parameters:
Stochastic RSI Timeframe: You can set the lower/higher timeframes for Stochastic RSI. Stochastic RSI
FREE
Easily track and trade with the trend using this indicator. Uses a circle and line to indicate the trend direction. Excellent for channels. Features alert function.
Parameter TrendPeriod can be changed to your preference. How to use: Simply attach to any chart. Blue circle plus blue line cross below price = Buy. Red circle plus red line cross above price = Sell. Best results when taking higher time frames into consideration before entering a trade. (Hint: Wait for the radar/circle to appear on
FREE

Attention!!! Do not try to test an Indicator in Tester, this is very difficult and mathematical calculation will consume all your Memory of computer. Test can be provide only on high performance computers. In Forward trading Indicator run without any problems. Better is rent product and test this calculation. After buy this indicator - BOILERMAKER, we will give for FREE our another indicator - Keltner MTF , contact us - after buy. PLEASE ONLY BUY LIFETIME LICENSE NO RENT!!! We add on MQL ma

Линейный график Volume Percentage Line Graph — это индикатор, предназначенный для предоставления информации об объеме данных. Он извлекает информацию об общем объеме для каждой свечи и представляет ее в процентах от общего объема. Индикатор отображает эти данные в виде линий графика в отдельном окне, что позволяет пользователям легко визуализировать битву между покупателями и продавцами. Одной из ключевых особенностей этого индикатора является его способность отображать объем в процентах в в
FREE
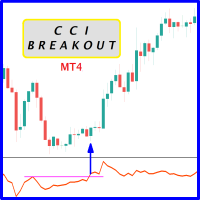
Probability emerges to record higher prices when CCi oscillator breaks out oscillator historical resistance level when exhibit overbought values. Since, oscillator breakout of support and resistance have similar effect as price breaks support and resistance levels, therefore, its highly advised to confirm price breakout with oscillator breakout; certainly, will have the same output in short trades. Concept is based on find swing levels which based on number of bars by each side of peak or trough
FREE

BIG CANDLE ALERT https://www.mql5.com/en/users/earobotkk/seller#products P/S: If you like this indicator, please rate it with 5 stars in the review section, this will increase its popularity so that other users will be benefited from using it. This indicator draws a bullish and bearish vertical line inside a candle whenever the size of a candle body exceeds the minimum size specified in the input. INPUT Bullish Candle Color: choose the color of your choice. Bearish Candle Color: choose the co
FREE

This indicator shows the breakeven line level for the total number of open positions of the current symbol with P/L value and total volume. This indicator is helpful to decide the exit level when using a trading grid strategy. The style of the breakeven line is customizable to choose the color, line shape and font size of the positions description. Send mobile notification when crossing a positive P/L target
FREE

Introduction To Time Box Indicator Time Box Indicator is a must have indicator for any trader. It will display daily, weekly and Monthly box according to your preferences. Yet, you can extend any important price levels in your chart automatically. You can use them as the significant support and resistance levels. It is very simple but effective tool for your trading.
Graphic Setting Use White Chart Line Style for Current Open price
Daily Setting Update Timeframe for daily box Number of days
FREE

Индикатор предназначен для обнаружения высоковероятностных моделей разворота: двойная вершина/дно с ложными прорывами . Это бесплатная версия индикатора: https://www.mql5.com/ru/market/product/26371 Бесплатная версия работает только на EURUSD и GBPUSD! Концепция индикатора Ultimate Double Top/Bottom и профессиональный способ его применения подробно описаны в блоге (на английском языке): Professional Trading With Double Tops/Bottoms And Divergences! Представленное видео показывает максимальную пр
FREE

"IF YOU'RE LOOKING FOR A UNIQUE TRADING APPROACH TO TRADING…AT AN AFFORDABLE PRICE…YOU'VE COME TO THE RIGHT PLACE!" Buy DayTradingArrow v1 Indicator And You Will Get Forex Trend Commander Indicator for FREE !
In forex trading, like any business, there are some rules that must be followed, which are disturbing for now, many adhere to the rule that if a system has losses, it is not profitable. To create the PERFECT strategy, the Perfect one for you, you need to experiment with all ways and for

Индикатор R 3MA Cross — это популярный трендовый индикатор с предупреждениями, основанными на пересечении трех скользящих средних, он состоит из более быстрой, средней и более медленной скользящих средних.
Ключевые моменты Предупреждение о покупке появится, когда более быстрая скользящая средняя пересечет среднюю и более медленную скользящую среднюю вверх.
Оповещение о продаже возникает, когда более быстрая скользящая средняя пересекает среднюю и более медленную скользящую среднюю вниз.
К
FREE
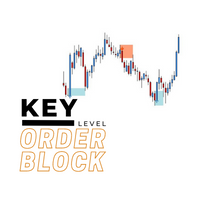
The key level order block indicator automatically draws order-blocks for you on the chart. The indicator compliments any strategy and can also be used as an independent tool. It can work with smart money concepts, harmonic patterns, supply and demand, flag patterns, Quasimodo strategy and many more.
Advantages
The key level order block DOES NOT RE-PAINT, giving you confidence when a signal appears and also helps when looking back. The key level order block includes an on/off button on th

MACD divergence Simple edition 原始MACD计算方式,升级为双线MACD,使判断更加直观更加贴合大宗交易平台的研究习惯,同时还会自动用实线标出背离,不用再从0开始苦学钻研。
同时,我还提供了提醒服务,在你忙于家务无暇顾及的时候只需要打开音响,一旦达成背离,第一时间就会让你知晓。
这是一款简单版的看背离指标,MACD的九天均线被称为“信号线”,然后绘制在MACD线的顶部,它可以作为买入和卖出信号的触发器。当MACD越过信号线时,交易员可以买入操作,当MACD穿过信号线以下时,交易者可以卖出或做空操作。移动平均收敛-发散(MACD)指标可以用几种方法解释,但更常见的方法是交叉、散度和快速上升/下降。
FREE

We Trade Live Trend Levels This indicator is a fantastic addition to the We Trade Live Trend Max this helps filter out noise and helps with better entries into a trade this add on is a must have and we use it all the time along side We Trade Live Trend Max this is a fantastic tool to help with entering a trade and exiting a trade, This indicator Calculates Volume strength indicating levels of support and resistance for a trade, measures momentum in a market making buying or selling into the
FREE
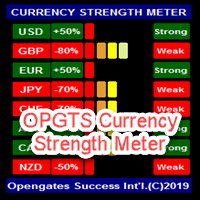
OPGTS Currency Strength Meter is an indicator created to measure and analyze the currency strength and pass the information to the trader through a graphical display of each currency group's strength rates by percentage. Each bar it shows represents the currency's strength or weakness.
USAGE:
It is useful in two ways for trading:
1. Solo Trading
2. Basket Trading (Currency Group Trading)
HOW TO USE IT EFFECTIVELY
Solo trading: It can be used for solo trading by analyzing the

Индикатор, отображает на одном графике две различных пары, предназначен для упрощения отображаемой информации, Способен работать практически со всеми доступными в терминале инструментами (не только валютными парами, но и металлами, сырьем). Особенность использования для визуального метода корреляции для любых валютных пар SubSymbol. Валютная пара выводится на экран цветными свечами. Это та самая коррелируемая пара. Mirroring. Вспомогательная валюта. Средствами индикатора отражается два тип
FREE

This simple indicator paints with a darker color on the volume bar when the quantity traded is above the average of select number of periods of the volume itself, highlighting the moments when there was a large volume of deals above the average. It is also possible to use a configuration of four colors where the color tone shows a candle volume strength. The indicator defaults to the simple average of 20 periods, but it is possible to change to other types of averages and periods. If you like
FREE

Если вам нравится этот проект, оставьте 5-звездочный обзор. Следуйте на instagram: borelatech Как институционалы торгуют большими объемами, для них не должно пытаться
защищать свою позицию на определенных процентных уровнях. Эти уровни будут служить естественной поддержкой и устойчивостью, которую вы
можете использовать
либо войти в торговлю или быть в курсе возможных опасностей против вашей
позиции. Пример общего используемого процента составляет 0,25% и 0,50% на EURUSD для
неделя, вы мо
FREE

Этот индикатор позволяет определять собственные паттерны, а не только широко распространенные и всеми используемые свечные модели как, например, свечи Doji. Как только вы покажете индикатору, какой паттерн вы ищете, он сразу же пройдется по всем предыдущим и будущим барам вашего графика, покажет выбранные модели и соберет статистику. Эта статистика включает в себя процент бычьих и медвежьих свечей, которые подходят по выбранную модель. Таким образом, пользователь будет иметь статистическое преим
FREE

Эта программа сделает анализ нескольких таймфреймов более удобным.
Это поможет синхронизировать все графики на разных графиках синхронизации таймфреймов, чтобы отображать один и тот же символ, тот же определенный период времени и синхронизация объектов чертежа Показать на всех диаграммах одновременно
Поддержка синхронизации объектов: вертикальная/горизонтальная линия, линия тренда, прямоугольник, стрелка, коррекция Фибоначчи
Дополнительная функция: оповещение о линии тренда
Как им польз
FREE
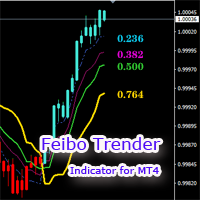
The Feibo Trender is a trend tracking indicator based on the Feibo section calculation. 1.The price is in an upward trend and candles turn blue .The price is in a downward trend and candles turn red . 2.The segmented areas of the channel are identified by lines of different colors that can as support or pressure reference locations . 3.The price broke through the yellow line, which marked the trend reversal. The indicator parameters can be customized and the settings are simple. If you have any

Time Range Separator - полезный инструмент для отображения разделителей периодов в платформе. Нужно только открыть настройки индикатора, выбрать необходимый диапазон и все. На наш взгляд, это очень полезно, поэтому мы хотели бы поделиться им бесплатно со всеми нашими подписчиками.
Входные параметры: TimeFrame Period Separator - таймфрейм
VLine_Color - цвет вертикальной линии VLine_Style - стиль вертикальной линии VLine_Width - ширина вертикальной линии Удачной торговли и до скорых встреч.
FREE

Broken Trends - индикатор для скальперов и интрадейщиков. В режиме реального времени он подбирает и показывает на графике трендовые линии. Индикатор реагирует на импульсы цены: поиски трендов начинаются как только амплитуда импульса превысит порог, задаваемый специальным параметром. Также индикатор может подавать звуковые сигналы при пересечении ценой актуальной трендовой линии. В обычном режиме индикатор показывает только по одному (последнему найденному) восходящему и нисходящему тренду, но им
FREE

YOU CAN NOW DOWNLOAD FREE VERSIONS OF OUR PAID INDICATORS . IT'S OUR WAY OF GIVING BACK TO THE COMMUNITY ! >>> GO HERE TO DOWNLOAD Most of the time, market reversals / pull backs usually follow volume and price spikes thus these spikes could be the first indication of an exhaustion and possible reversal/pullback. High volume Turns is an indicator that scans the market for price and volume spikes around over-bought/over-sold market conditions. These spikes when spotted serves as the first ind
FREE

Description:
This indicator (with its algorithm) marks relative highs and lows, which have an array of useful applications.
This indicator will never repaint.
Features:
Marks relative highs and lows Use this to determine points of trend continuation i.e. where the trend may pull back before continuing higher or lower, past this point Or use this to determine potential points of reversal, particularly in ranging markets, or with other price action These highs and lows can sometimes
FREE

FREE TopClock Indicator: This indicator is an Analog Clock That Shows: Local Time Of Pc or Time Of Broker Server or sessions(Sydney -Tokyo London -NewYork)Time or custom Time( with GMT -Base) this can shows Candle Time Remainer with Spread live. You can run this indicator several times for different times and move it to different places on the chart. If you would like, this indicator can be customized for brokers and their IB based on customer needs. For more information contact us if you
FREE

This indicator is a simple trend line indicator.
The upper trend line is the highest price of 60 past candlesticks, the highest price of 30 past candlesticks,
The bottom line is the trend line that connects the lowest price of 60 past candlesticks and the lowest price of 30 past candlesticks.
*The color of the trend line is white.
Notes
This indicator is created with the above configuration, so if the highest and lowest prices of the past 60 candlesticks and 30 candlesticks are the s
FREE

EZ Risk Reward Ratio — это простой в использовании индикатор MT4, который позволяет пользователю автоматически изменять соотношение риска и вознаграждения для открытой сделки, просто перетаскивая линии тейк-профита или стоп-лосса в желаемые позиции на любом графике. Соотношение риска и вознаграждения отображается в любом углу, и его можно изменить, просто перетащив линии TP и SL. Сначала поместите индикатор EZ Risk Reward Ratio на график MT4, где должна быть размещена сделка. Во-вторых, откройте
FREE

M1Arrows is a MT4 trend arrows Indicator
* Smart Scalper Setup (M1) :: Signal 5 Main 20 + Signal 20 Main 80 + Fibonacci ZigArcs 20
(Screenshot1) Add the indicator with first setting,
then add it again to the same graph with other settings.
You can add as many as you want, but 2 M1Arrows in just one graph is enought
Never open orders againt the slow setting trend
Do not open more than 3 orders per slow setting trend
It will work better in Europe/USA markets, * M15 Day Trade Setup: Sig
FREE

Rsi indicator and Stochastic Combined into one indicator , the Supreme StochRsi doesnt repaint / Back-paint / delay. can be used as overbought oversold strategy , or trend following on 50 level cross. if you like this indicator please check my Supreme Trendhisto: here , and my Supreme Diamond indicator : here ========================================================================= Parameters : Stochastic K and D value , Stochastic period Rsi Period Rsi price ====================================
FREE

Индикатор линий сил валют (Currency Strength Lines, CSL) - это весьма полезный инструмент как для начинающих, так и для опытных трейдеров. Он способен рассчитывать силы одиночных валют и отображать их на графике, чтобы вы могли видеть тренд и замечать торговые возможности.
Как она работает? Индикатор CSL проводит расчеты на 28 парах, показывая общую силу по всем одиночным валютам на рынке в любой заданный момент. Вы можете использовать эти данные для определения валют, которые сильны, усиливаю
FREE

Provides instant signals on the chart in panel form. Equipped with signal description and trading analysis tools such as drawing auto trendlines, support/resistance area, regression channel, Fibonacci levels, Pivot levels and current signal price, signal time, signal expiry and stoploss recommendation. Also sending alert messages to all available mt4 alert tool. A detailed description panel provides information about where the signal comes from and what indicators are behind the signal. Includin

С помощью индикатора можно 1 Выявлять тренд и идти за большим и малым трендом прокладывая линии. Когда цена выходит из коридора линий, то с большой вероятностью цена пойдёт до следующей линии и развернётся на ней.
2 Долгострочно - Прокладывать линии по центрам фракталов, индикатор может выявлять фрактал второй точки ( Number bars analysis). Зачастую цена может приблизиться к линии даже через неделю или месяц и можно открывать сделку на разворот. Если волна прошла широкая и мы хотим поймать разв
FREE

Investment Castle Indicator has the following features: 1. Dictates the direction of the trend in different Timeframes . 2. Shows the hit rate and winning rate on the chart. 3. This indicator does not repaint the chart. 4. This indicator is built-in the Support & Resistance based Investment Castle EA which works with Psychological Key Levels "Support & Resistance" Indicator.
FREE

This indicator is the converted Metatrader 4 version of the TradingView indicator "ATR Based Trendlines - JD" by Duyck. This indicator works by automatically and continuously drawing trendlines not based exclusively on price, but also based on the volatility perceived by the ATR. So, the angle of the trendlines is determined by (a percentage of) the ATR. The angle of the trendlines follows the change in price, dictated by the ATR at the moment where the pivot point is detected. The ATR percentag
FREE

Точный торговый анализ у вас под рукой: программное обеспечение для анализа торговли нового поколения Основное программное обеспечение для анализа торговли, доступное на рынке, часто предоставляет только почасовую или еженедельную статистику коэффициента прибыли и убытков, что не отвечает требованиям более точного анализа торговли. Однако на реальном торговом рынке каждый день складываются уникальные обстоятельства. Понедельники тихие, среды активные с тройным овернайт-процентом, а пятницы искл
FREE
MetaTrader Маркет - торговые роботы и технические индикаторы для трейдеров, доступные прямо в терминале.
Платежная система MQL5.community разработана для сервисов платформы MetaTrader и автоматически доступна всем зарегистрированным пользователям сайта MQL5.com. Ввод и вывод денежных средств возможен с помощью WebMoney, PayPal и банковских карт.
Вы упускаете торговые возможности:
- Бесплатные приложения для трейдинга
- 8 000+ сигналов для копирования
- Экономические новости для анализа финансовых рынков
Регистрация
Вход
Если у вас нет учетной записи, зарегистрируйтесь
Для авторизации и пользования сайтом MQL5.com необходимо разрешить использование файлов Сookie.
Пожалуйста, включите в вашем браузере данную настройку, иначе вы не сможете авторизоваться.