Смотри обучающее видео по маркету на YouTube
Как купить торгового робота или индикатор
Запусти робота на
виртуальном хостинге
виртуальном хостинге
Протестируй индикатор/робота перед покупкой
Хочешь зарабатывать в Маркете?
Как подать продукт, чтобы его покупали
Технические индикаторы для MetaTrader 4 - 42

My Account Brokers Details This indicator displays the account data and broker terms regarding its operation. For example, broker name, account number, financial leverage, account currency, automatic trading approval, minimum lot, lot step, maximum number of lot, margin call, stop out and many other important data. It is easier to display such data on the chart in one moment with a click of the mouse, than to look for it in the contract or call the broker.
FREE

Version History Date Version Changes 07/08/2022 1.00 Initial Release Description The Aroon indicator is a technical indicator that is used to identify trend changes in the price of an asset, as well as the strength of that trend. In essence, the indicator measures the time between highs and the time between lows over a time period. The idea is that strong uptrends will regularly see new highs, and strong downtrends will regularly see new lows. The indicator signals when this is happening, and
FREE
Standard deviation with levels - модифицированный индикатор Standard deviation, который дополнен уровнями предполагаемых максимумов и минимумов. Построение уровней происходит при помощи индикатора Support and resistance bands , который определяет ближайшие к текущему значению индикатора уровни минимума и максимума на основе исторических значений экстремумов.
Параметры standard deviation period - период индикатора стандартного отклонения. extremum detector period - период детектора экстремумов.
FREE

Индикатор предназначен для внутридневной торговли. Оснащен всеми функциями оповещения для удобства в ручной торговле. Рекомендуется использовать таймфреймы м5, м15, м30. Также вы можете посмотреть и подобрать настройки для любого финансового инструмента. Подпишись на мой telegram канал, ссылка в контактах моего профиля . Настройки: Indicator period - Период индикатора Alerts - Функция включения алертов. Push notifications - Включение Push-уведомлений на мобильный терминал e-mail - Отправка с
FREE

Tibors Timer - Indikator zur Übersicht und Klarheit im Chart
Dieser Indikator wurde von mir geschrieben, da ich oftmals die wichtigsten Informationen während eines Trades bzw. im Chart mühevoll suchen musste. Bitte täglich neu in den Chart ziehen. Er zeigt folgendes an: - Akuteller Kurs - Aktuelles Handelspaar - Die Zeiteinheit - Die Restzeit zur nächsten Kerzenbildung - Die Nummer des Handelskontos - Die Frei Verfügbare Margin - Margin auf 1 Lot - Der Aktuelle Hebel - Der Aktuelle Spprea
FREE
И ндикатор ZoomChart отображает в подокне данные с других таймфреймов на текущем графике, действуя как увеличительное стекло или, наоборот, уменьшает график для отображения более крупных таймфреймов. Индикатор ZoomChar автоматически отслеживает текущий крайний бар на графике и перемещается вместе с графиком при его сдвиге. Индикатор может отображать данные другого финансового инструмента, не ограничиваясь лишь инструментом главного графика.
Индикатор несёт в себе функцию "mirroring" -
FREE

This scanner is monitoring the entire market for trade opportunities for all symbols and for all time frames. You don't have to look to all the charts, for all symbols and for all time frames. This scanner will alert you on your computer, or on your mobile, when a trade opportunity has been found. You never have to miss a trade opportunity! This indicator is designed to scan all pairs and symbols, for all time frames, to find a cross of the MACD main and signal line. MACD Definition
The
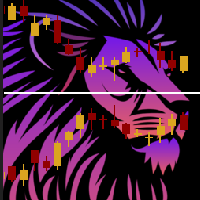
Индикатор ChartOverlay несёт в себе две основные функции 1. Oтзеркаливания - то есть к примеру из EURUSD он сделает USDEUR 2. Oтображения графика цены выбранного финансового инструмента (с выбранным периодом) в подокне основного графика. Этот инструмент позволяет трейдерам легко анализировать взаимосвязь между различными валютными парами и активами, предлагая уникальные функции настройки и визуализации. Основные функции: Отображение графика цены: Индикатор отображает график цены выбранного инстр
FREE
Buy a Coffee for Yuniesky Carralero Cuellar
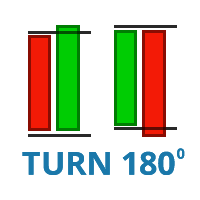
This indicator draws the RED - GREEN and GREEN - RED candlestick pattern, the green candles that close above their previous red candle, and the red candles closing below your previous green candle. https://www.youtube.com/shorts/MdJvatl_mng Input Parameters 1. RED - GREEN: Draw the green candles that close above their previous red candle. 2. GREEN - RED: Draw the red candles that close below their previous green candle. 3. PREV CANDLE: Draw previous
FREE

Здесь все очень просто. Никогда не понимал индикаторы без внешних параметров. И Awesome Oscillator не исключение. Теперь вы можете настраивать этот индикатор под свои потребности и стратегии. Справка: Индикатор Awesome Oscillator показывает расстояние в пунктах между двумя скользящими средними (быстрой и медленной). Индикатор AO_Robex имеет в параметрах изменение периода скользящих средних.
FREE

RJT SALAMANDER, the indicator as in a video game
VERSION 2
Pilot your PRICE spaceship inside the cavern and avoid the collision against the stalactites (green) and stalagmites (red), dodging these obstacles to win.
When these objects are forming (or disappearing) then you must make the decision how to move your ship (just like in a video game)
Depending on the market and the size of the candles/bars you can adjust the calculation of stalactites and stalagmites (based on the last bars) in the
FREE

***IMPORTANT: This free indicator works with the paid for Strong Weak Forex Expert Advisor. The EA also depends on the following custom indicators: Strong Weak Heiken Ashi Strong Weak Parabolic Strong Weak Values Strong Weak Symbols Download them for free in the Market. The EA will not work without it. These are all custom indicators which the Strong Weak Forex Expert Advisor relies on to generate trading signals. If you have any problems with installation send me a message.
FREE
红黄绿简明指示趋势与震荡指标升级版。 使用红黄绿三色来标示上升趋势 、震荡、下跌趋势。 红色表示空头趋势(下跌)。 绿色表示多头趋势(上涨)。 黄色表示震荡区域。 从黄色转变为红色时,行情可能从震荡转变为下跌趋势。一段连续的红色,说明下跌趋势很强。 从黄色转变为绿色时,行情可能从震荡转变为上升趋势。一段连续的绿色,说明上升趋势很强。 指标的上半部分区域和下半部分区域若同步为红色,表明下跌趋势已经形成共振,接下来大概率走出一段空头趋势。 同时,红绿黄分为上下两部分:
若上下部分同时为绿色,表明上涨趋势已经形成共振,接下来大概率走出一段多头趋势。 若上下部分同时为红色,表明下跌趋势已经形成共振,接下来大概率走出一段空头趋势。
若上下同时为黄色,表明当前行情为震荡。 升级版2.0: 新增两条快慢线。 当慢线(Blue/Red线)为蓝色时,视为多头行情。当慢线为红色时,视为空头行情。 当快线(DarkGray线)从下方向上穿过慢线时,作为参考做多信号,激进交易者可进场做多。反之亦然。
参数可调。 //+---------------------------------------------
FREE

MP Price Change Indicator is a tool to calculate the price movement by percentage. The Value of this indicator can be adjusted to look back of the percent of price change within certain timeframes. This is a powerful tool when used by other indicators as well, such as ATR and ADR, for understanding price fluctuations and tolerance in different strategies. ___________________________________________________________________________________ Disclaimer:
Do NOT trade or invest based upon the analysi
FREE

AWESOME ATR INDICATOR The Awesome ATR Indicator is a technical analysis tool developed for the MetaTrader 4 (MT4) platform. This indicator is designed to assist traders in determining stop loss and take profit levels based on the average value of the Average True Range (ATR). By leveraging the market volatility data provided by ATR, this indicator offers more accurate and dynamic guidance in setting these crucial trading levels. KEY FEATURES Dynamic Stop Loss Determination Calculates stop loss
FREE

SpreadChartOscillator — это индикатор, который отображает линию спреда символа в подокне осциллятора. В параметрах есть в озможность указать другой символ, с которого будет транслироваться линия спреда . Если параметр "Symbol" оставить пустым, линия спреда будет отображаться от текущего символа, на котором установлен индикатор. Этот инструмент идеально подходит для трейдеров, которые хотят видеть динамику спреда в формате осциллятора и использовать это для защиты от входа в рынок при больш
FREE

Having trouble marking where the various forex sessions start and end? Or perhaps your strategy requires you trade only in a specific session, then this is for you.
The session indicator shades the session you require in a certain color so that you can identify it easily. The sessions shown include: London session, New York session, Asian Session, Asian - London overlap and London - New York Overlap.
Difference source give varying time ranges for the various session, mostly differing by not mo
FREE

Покупайте и продавайте сигналы с помощью Гистограммы MACD. Интерфейс прост и прост для понимания. Вы можете перзонализировать индикатор несколькими способами в соответствии с его визуальным стилем или, что еще более важно, его настройкой параметров для обнаружения рыночных сигналов. Используя опцию Мультипликатора в меню, можно увеличить период индикатора, хотя рекомендуется использовать настройки по умолчанию.
FREE
Highly configurable OBV indicator.
Features: Highly customizable alert functions (at levels, crosses, direction changes via email, push, sound, popup) Multi timeframe ability Color customization (at levels, crosses, direction changes) Linear interpolation and histogram mode options Works on strategy tester in multi timeframe mode (at weekend without ticks also) Adjustable Levels Parameters:
OBV Timeframe: You can set the lower/higher timeframes for OBV. OBV Bar Shift: Y ou can set the offset
FREE

Индикатор рассчитывает текущий спред для каждого тика по формуле Spread=(ASK-BID)/Point. График изменения границ спреда за таймфрейм отображается в отдельном окне с момента присоединения индикатора. Выводятся две линии соответствующие минимальному и максимальному значениям спреда.
Окно индикатора самонастраивается по минимальному и максимальному значению от момента запуска. Минимальное и максимальное значения за весь период работы индикатора будут соответствовать отображаемым значениям уровней о
FREE
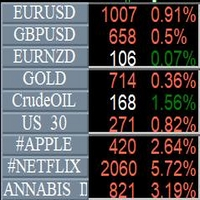
Info Symbol is an indicator that will allow you to monitor up to 9 different markets. Just enter the name of the symbols and the number of decimal places. With a single click you can switch from one market to another, it will take two clicks for a chart with an expert attached to it. With this indicator, you will know how many points or pips that the monitored markets have gained or lost since the beginning of the day and you will also have the percentage.
FREE

LyfUD指标专门 为黄金设计的趋势指标 ,也可以用于任何金融工具。用于及时反映多空力量,由U线和D线组成, 波动以0为中轴偏离运行, U线为快线D线为慢线。 LyfUD指标可以和 绝大多数策略结合使用 ,能够更加有效的把握风控。 U线和D线采用价格行为市场追踪算法,能及时反映市场方向, 可用在任意货币。 特性: 1. U线、D线在0轴上方,买入信号参考。 2. U线、D线 在0轴下方 ,卖出信号参考。 3. U线、D 线极限背离转向,行情可能出现反转。 4. 滞后性低,能及时反映趋势。 致力于结合其他指标,LyfUD和 均线、Pinbar 等搭配使用能迅速找到一些合理的关键位。 LyfUD只作为参考依据,其风险与作者无关。未经作者同意,禁止他售。
FREE

Indicator showing the breakout after at least X candles of the same sign, followed by an opposite candle. PARAMETERS: BARS TO SHOW = Story of Indicators (0 = all bars) Consecutive Bars for Breakout = How many Bars of the same direction and after a Bar with opposite direction Minimu Point between H/L = To consider a bar valid, she must have a Minimun Hi/Lw value Minimu Point between O/C = To consider a bar valid, she must have a Minimun Open/Close value Graphics are self-explanatory
FREE
CoralPage is a simple little utility to add navigation controls to your chart. You can now easily step through the symbols in the Market Watch without having to click-and-drag a symbol from the Market Watch onto your chart. It's a simple but indispensable time-saver! Click move to the first, previous, next or last symbol in the Market Watch. Shift-click to go the the previous or next symbol that has an open order. CoralPage is completely free. If you like this, please check out my other prod
FREE

O Chart Control é um indicador que permite de forma rapida e pratica alterar o timeframe e ativo do grafico, possibilitando que voce possa fazer todas as suas analises em apenas um grafico sem precisar abrir vários, além disso voce pode escolher o entre os temas claro e escuro para o qual melhor se adapta a sua preferencia.
MT5: https://www.mql5.com/pt/market/product/109444
FREE

Индикатор показывает изменения цены за те же дни в прошлые годы. Требуется таймфрейм D1. Индикатор предсказывает на основе баров D1 на тех же днях прошлых лет относительное изменение цен. Параметры: LookForward - количество дней (баров) для показа "будущих" изменений цен; по-умолчанию - 5; Offset - количество дней (баров) для сдвига назад по истории; по-умолчанию - 0; ShowAverage - переключатель режима; true - показывать среднее для всех 8 прошлых лет и границы стандартного отклонения; false - п
FREE
Highly configurable Momentum indicator.
Features: Highly customizable alert functions (at levels, crosses, direction changes via email, push, sound, popup) Multi timeframe ability Color customization (at levels, crosses, direction changes) Linear interpolation and histogram mode options Works on strategy tester in multi timeframe mode (at weekend without ticks also) Adjustable Levels Parameters:
Momentum Timeframe: You can set the lower/higher timeframes for Momentum. Momentum Bar Shift:
FREE

Этот индикатор основан на осцилляторах быков и медведей, представленных в книге доктора Александра Элдера: «Заходите в мою торговую комнату». «Elder Ray» был создан с целью выявления бычьего и медвежьего давления на рынках.
Индикатор в основном представляет собой объединение этих двух упомянутых осцилляторов, но на эффективном способе облегчения получения ценовых паттернов, расхождений и т. Д.
Параметр по умолчанию - EMA 13.
FREE
Machine translation of the following: This indicator is used to close or open the price and time scales.Select true to display scale and false to close scale.After the price scale is closed and then opened, it may show that it is not at all. But it can be solved by switching time cycle.This indicator has two tags, D and P, which can be opened or closed in real time by clicking.The related parameters can be modified by user, such as the name, position and coordinates of the label.
FREE

Индикатор представляет собой 4 скользящих средних, сдвинутых назад. Создан, как и любые индикаторы скользящих средних, для того, чтобы увидеть примерный баланс волатильности и количества быков и медведей. Отличие от других Moving Average в том, что тут сделана попытка привести к общему знаменателю разнопериодные скользящие, соответственно, привести к общему знаменателю количество трейдеров, торгующих на разных таймфреймах. Индикатор распространяется как есть. MnojitelMA1, MnojitelMA2, Mnojitel
FREE

The indicator detects market efficiencies and inefficiencies by studying price movements and marks candles where the best efficiencies occurred. The most 'efficient' candles are indicated with a vertical bar histogram. Taller bars represent these candles. The highs and lows of these candles are supply and demand areas, important levels that will be retested in the future. It can be used on all time frames with the same settings.
FREE
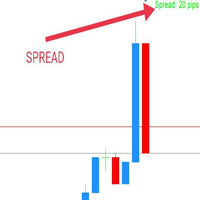
WaSpread MT4 Indicator shows the current spread in pips with color.
* Set the Spread Threshold and the color to identify when the current spread is below or above the Spread Threshold.
* Set X axis and Y axis and chose the Corner and the Anchor to position the Spread Label on the chart.
* Write the font and the font size for more confort.
* Activate alert if the current spread is above the spread threshold.
* For more precision, the user can choose to show the decimal numbers.
* The user
FREE

Todays High and Low
This indicator draws lines at the highest price of the day and at the lowest price of the day. Both lines are ended with labels with the maximum and minimum prices written. Lines and labels are moved according to the chart progress in real time. The indicator works on all chart time intervals. You can change and set colors and shift the chart. The indicator allows you to observe the price movement on the chart and not lose sight of the price maxima and minima achieved.
FREE

Introduction This Indicator Is Based On Average Price/Maximum Price Moves, And Using Moving Bollinger Bands And Moving Averages.
The Advantage Of Using It With YOUR own Analysis Will Confirm Potential Supports And Resistances While it Compliments With Your Analysis
The Indicator Is Non-Repainting
AND Along With Our Special Trend METRE that Changes With The Conditions OF A Bullish Or Bearish Trend....
Recommend Time-Frames: H1 H4 M15
Usage: The Indicator Is Very Profitable If Use
FREE
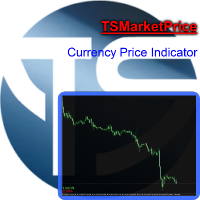
Indicator that displays the current price and the percentage of loss or gain, compared to the previous day.
The benefits you get : Possibility to choose your favorite crosses. Never redesigns, does not retreat, never recalculates. Works on forex and CFD, timeframe from M1 to monthly. Easy to use.
Parameters : FontSize = 20; font size FontType = "Tahoma"; character type Angle = Bottom_Right; angle view (top right .. top left sect ..) Show_Price = true; view the Bid Show_Var = true; see the dif
FREE
Индикатор осциллятор " AnglerSPeriod " - один из серии трёх вычислителей углового отклонения графика цены торгового инструмента.
ВХОДНЫЕ ПАРАМЕТРЫ: DRAWs =128 - Количество баров для отображения индикатора в историю графика; PeriodIND =14 - Расчётный период индикатора в количестве баров.
Значения показателей индикатора являются градусами . Наличие Сильного Движения цены начинается со значения +-45 градусов, и не может превышать +-90 градусов. Удачных Торговых Исследований!!!
FREE

This indicator draws on the chart high and low prices of different periods . And If you want, Indicator can alert you when the current price arrive these levels. Alert Options: Send Mobil Message, Send E-mail, Show Message, Sound Alert Time Periods: M1, M5, M15, M30, H1, H4, D1, W1, MN Inputs: TimeShift: You can set start hour for calculating. And that way you can see levels independently from broker server's time-zone. PipDeviation: You can set price sensibility for alert (Default: 3) Lines
FREE

Вы устали от большого количества открытых графиков и от наблюдения за многими различными валютными парами? MCTSI будет отслеживать силы 56 валютных пар и покажет лучшие пары для торговли. Вам больше не нужно гадать, какая валюта сильнее/слабее. Больше никакой торговли парой, которая еле движется. Это базовая версия. Более продвинутая версия MCTSIP доступна здесь: https://www.mql5.com/ru/market/product/20994 У вас может быть открыто множество графиков для того, чтобы определить наилучшую пару дл
FREE

Indicator with the function of catching trees should pinbar of all time frames 1. PinBar identification indicator for multi timeframe. 2. Function backtest of PinBar candlestick patterns 3. Announcements on MT4 / MT5 and on mobile phones Please watch my movie on youtube for instructions. S ubscribe my channel for free indicator. https://youtu.be/gIONGgBMqW8
#KIDsEA #indicator #Pinbar #priceaction #mt4 #mt5
FREE

Этот индикатор был модифицирован согласно 'Пути черепахи'. Он формирует канал на основе цены открытия и значений ATR текущего бара. Turtle ATR Channel можно использовать для помощи при определении состояния перекупленности и перепроданности рынка.
Расчет Верхний канал = Open + r1*ATR Нижний канал = Open - r2*ATR Где: Open - цена открытия текущего бара. ATR - значение ATR текущего бара. r1, r2 - коэффициенты ATR.
Входные параметры ATR Period - период индикатора ATR, по умолчанию - 14. ATR Up Ra
FREE

CCFp (Complex_Common_Frames percent) is a measure of currency strength.
Shows the total rate of change of “short-term moving average” and “long-term moving average” for each currency.
Supports eight major currencies: USD, EUR, JPY, CHF, GBP, AUD, CAD and NZD.
1). Displays the currency name at the right end of the graph.
2). You can change the display color of each currency.
3). Moving average smoothing type (ENUM_MA_METHOD) can be selected.
4). Price constant (ENUM_APPLIED_PRICE) can be c
FREE

Этот индикатор был модифицирован согласно 'Пути черепахи'. Индикатор ATR можно использовать в качестве опорной точки для установки стоп-лосса или тейк-профита, а также для подтверждения дневного ценового диапазона (также применимо к другим периодам).
Расчет Значение истинного диапазона рассчитывается следующим образом: TR = MAX(H-L, H-PDC, PDC-L) Где: H = максимальная цена текущего бара L = минимальная цена текущего бара PDC = цена закрытия предыдущего бара Средний истинный диапазон в "Пути чер
FREE

Оригинальный трендовый индикатор. Индикатор рисует в отдельном окне три линии, характеризующие текущую динамику цены. Может принимать значения от -1 до +1. Чем ближе значение индикатора к +1, тем сильнее восходящий тренд. Чем ближе к -1, тем сильнее нисходящий. Также может применяться в качестве осциллятора для определения перекупленности/перепроданности. Индикатор имеет один входной параметр Period, в котором указывается количество баров, используемых для расчета.
FREE

Индикатор в виде панели для отслеживания и сбора статистики по спредам из указаного списка пар. Достаточно открыть один график и установить индикатор для сбора статистики по всем указанным парам. Панель после завершения работы записывает значения в файл, что позволяет не перерывать сбор статистики после завершения работы.
Входные параметры:
-Интервал обновления спреда по парам (сек) Позволяет указывать с какой периодичностью проводить сбор статистики (позволяет снизить нагрузку) -Список пар С
FREE

The Stock Exchange One Sessions Hours version 2.00
This indicator facilitates observing the currency pair's quotations during subsequent parts of the stock exchange session live. Before the session starts, a rectangle is drawn on the chart but not filled in with color. It means the extent of the session duration. Before the first bar enters the rectangle of the session, a sound signal or pop-up window will notify us that the session will just start. When the price graph crosses the edge of the
FREE

1、能显示货币之间的强弱 0是最弱 7是最强 2、能显示28个货币以及黄金 原油的 涨跌幅度 3、能切换货币对 4、能显示持仓订单的货币对 1、能显示货币之间的强弱 0是最弱 7是最强 2、能显示28个货币以及黄金 原油的 涨跌幅度 3、能切换货币对 4、能显示持仓订单的货币对 5、能利用键盘的的上下键切换货币对,左右键切换周期 1、能显示货币之间的强弱 0是最弱 7是最强 2、能显示28个货币以及黄金 原油的 涨跌幅度 3、能切换货币对 4、能显示持仓订单的货币对 5、能利用键盘的的上下键切换货币对,左右键切换周期 5、能利用键盘的的上下键切换货币对,左右键切换周期 1、能显示货币之间的强弱 0是最弱 7是最强 2、能显示28个货币以及黄金 原油的 涨跌幅度 3、能切换货币对 4、能显示持仓订单的货币对 5、能利用键盘的的上下键切换货币对,左右键切换周期
FREE
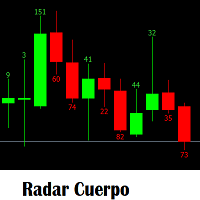
Indicador que sirve mirar el tamaño de velas segun el tamaño te genere alerta para hacer entradas manuales. Aprovechenlo al maximo que una plantea estrategia a vaces del tamñao de la vela anterior o de la misma vela actual. para entran a comprar y vender. Es un indicador que es necesario para cualquier analisis que se tome para una entrada nueva. Sera su herramienta preferida.
FREE

The indicator allows you to trade binary options. The recommended time frame is М1 and the expiration time is 1 minutes. The indicator suitable for auto and manual trading. A possible signal is specified as a arrows above/under a candle. You should wait until the candle closes! Arrows are not re-painted Trade sessions: London and New York section Currency pairs: EUR/GRB Working time frame: M1 Expiration time: 1 minute The indicator also shows good results when using the martingale strategy - "M
FREE

Индикатор Harrow Band основан на значениях поддержки и сопротивления. Индикатор отображает шесть уровней, указывающих на ближайшие уровни поддержки/сопротивления. Таким образом вы видите наиболее подходящие точки входа в сделку и выхода из нее.
Пары и таймфреймы Индикатор можно использовать на любых парах и таймфреймах. Рекомендуется XAUUSD H1.
Параметры NumCandle - количество свечей для расчета уровней поддержки/сопротивления. BandColor - цвет линий.
Авторы Copyright 2017, Priantos и Uboiz
FREE
Индикатор отображает размер бара и его направление. ---------------------------------------- Цвета гистограммы: * Красный - Медвежий бар.
* Зелёный - Бычий бар.
* Серый - Цена открытия и цена закрытия равны. * Синяя линия - скользящая средняя.
---------------------------------------- Параметры: - Type of Calculation - Тип расчёта ( Low to High, Open to Close ) - Moving Avarage - Период скользящей средней
FREE

Данный индикатор отображает значения доходности за выбранный период. Они отображаются как логарифм доходности, нежели значения цены или необработанные данные о доходности. Для малых значений доходности, показатели арифметической и геометрической доходности будут схожими. Преимущество использования значений доходности вместо цен заключается в нормализации. Это делает возможным сравнение всех переменных в сопоставимой метрике, несмотря на происхождение из ценовых рядов с разными значениями.
Входн
FREE

Представляю Вашему вниманию индикатор Profi Arrows . Индикатор построен на нестандартных индикаторах Moving Average .Представляет собой сигналы на вход в виде стрелок. Все сигналы образовываются на текущем баре. Максимально упрощен в использовании как для торговли исключительно одним индикатором, так и для использования индикатора в составе Ваших торговых систем. В индикаторе существует 2 режима работы. Вариант с перерисовкой сигнала, и без. В режиме без перерисовке, возможен вариант перерисовк
FREE
The Slope is an MT4 indicator that calculates the slope of the price, and draws a histogram so you could see when it's positive, negative, or ranging.
Key Features: Calculates Slope of the Line Chart Shows the numbers as a Histogram below the chart Choose Different Periods for calculating the slope. Sends Alerts and Push Notifications when slope changes direction Settings:
CalculationPeriod: The number of bars used to calculated the slope ( for example, if CalculationPeriod = 10, The Slope w
FREE

Индикатор RSI с сигнальными линиями, при пересечении которых будет выдаваться соответствующее уведомление, которое может быть в виде обычного алерта, либо в виде воспроизведения пользовательского звукового файла. Также индикатор имеет функцию отправки push-уведомлений и уведомлений на Email при пересечении этих уровней. Значения уровней можно задавать самостоятельно в настройках индикатора, а также при желании их можно изменять и настраивать непосредственно в окне индикатора. Данный продукт - де
FREE

The Toronto Stock Exchange Session's Hours
This indicator facilitates observing the currency pair's quotations during subsequent parts of the stock exchange session live. Before the session starts, a rectangle is drawn on the chart but not filled in with color. It means the extent of the session duration. Before the first bar enters the rectangle of the session, a sound signal or pop-up window will notify us that the session will just start. When the price graph crosses the edge of the session
FREE
CandleCloseCountdown is technically an indicator. Its purpose is to show the time a candle has left on a given timeframe before it closes. All possible time frames of MetaTrader 4 are supported. The way the remaining time is displayed depends on the selected timeframe. For M1 only the seconds are displayed. Above that at all timeframes up to H1 the remaining minutes and seconds are displayed and so on for timeframes above D1.
FREE
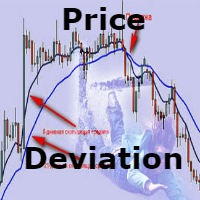
Price Deviation - Индикатор показывает отклонение цены от скользящей средней в процентах. Строиться под графиком в отдельном акне. Максимальное отклонение от скользящей средней позволяет определить перекупленность/перепроданность актива. Если актив перекуплен - рекомендуется продавать, а если перепродан - покупать. По желанию в настройках индикатора можно добавить уровни перекупленности/перепроданности. Желательно использовать на более старших таймфреймах от H4 и выше. Настройки индикатор
FREE
Индикатор осциллятор " JAngleR " - один из серии трёх вычислителей углового отклонения графика цены торгового инструмента.
ВХОДНЫЕ ПАРАМЕТРЫ: DRAWs =128 - Количество баров для отображения индикатора в историю графика; Period_IND =14 - Расчётный период индикатора в количестве баров; ma_period =1 - Период Скользящей Средней; ma_method =MODE_SMA - Метод мувинга; applied_price =PRICE_CLOSE - Применяемая Цена Скользящей Средней. Значения показателей индикатора являются градусами . Наличие Сильного
FREE
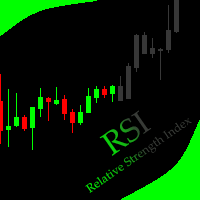
This indicator allows to hide RSI (on all MT4 timeframes) from a date define by the user with a vertical line (Alone) or a panel (with "Hidden Candles" utility). Indicator Inputs: Period Apply To Information on "Relative Strength Index" indicator is available here: https://www.metatrader4.com/en/trading-platform/help/analytics/tech_indicators/relative_strength_index ************************************************************* Hey traders!! Give me your feeds! We are a community here and we
FREE
BinaryPRO - это мультивалютный и мультитаймфреймовый сигнальный индикатор, созданный по авторскому алгоритму. Выдает качественные и своевременные торговые сигналы в виде стрелок, на любых финансовых активах, торгующихся на Мета Трейдер 4. Является хорошей альтернативой платным сигнальным сервисам. Индикатор может использоваться с любым брокером (с 4/5-значными котировками). Полученные торговые сигналы можно и нужно использовать при торговле бинарными опционами и крипто валютой.
Преимущества Bi

PRO VERSION This free indicator change timeframe of charts(up to 3) at the same time,by clicking a label. If you click the label(shown below),timeframe of charts will change. If you click again,timeframe of charts restore.
You can change the position of the label.
You can change charts up to 3 charts(a paid version enables up to15 charts). You can add second,third timeframe changer label.
This indicator is very useful for speed trading.
There is a more powerful PRO VERSION . The paid versio
FREE

InpRSIshort =13; // RSI short InpRSIPeriod =34; // RSI long PeriodRs =0; //Price 0C 4HL/2 5HLC/3 mafast =13;//mafast maslow =65;//MAslow
Double line RSI sub graph index. The parameters are adjustable. The RSI lines with two different cycles can be used to observe the trend strength effectively. Meanwhile, a short period cross long period color column image is displayed below. When the cycle (Jin Cha) is on the short cycle, the color of the column map changes from the light green to the
FREE
Highly configurable MFI indicator. Features: Highly customizable alert functions (at levels, crosses, direction changes via email, push, sound, popup) Multi timeframe ability Color customization (at levels, crosses, direction changes) Linear interpolation and histogram mode options Works on strategy tester in multi timeframe mode (at weekend without ticks also) Adjustable Levels Parameters:
MFI Timeframe: You can set the current or a higher timeframes for MFI. MFI Bar Shift: you can set the
FREE

Это демонстрационная версия PipsFactoryWeekly Этот индикатор зависит от цен High и Low валюты за последнюю неделю, использует секретные уравнения для рисования 10 линий.
Особенности: Вы будете знать по какой именно цене вам лучше войти на рынок. Вы будете знать, когда выходить из рынка. Вы будете знать, что вам следует делать в рынке: Покупка Продажа Тэйк Профит, имеются 3 уровня для фиксации прибыли Поддержка Сопротивление Риск при покупке Риск при продаже
Используемые типы сигналов и таймфре
FREE

A trend indicator showing the strength of bulls and bears in a trading range.
Consists of two lines:
The green line is a balanced overbought/oversold condition. The red line is the direction of trading activity. Does not redraw calculations.
Can be used on all Symbols/Instruments/Time Frames.
Easy to use and set up.
How to use the indicator and what it determines.
The basic rule is to follow the direction of the red line:
if it crosses the green line from the bottom up, the market is dominat
FREE
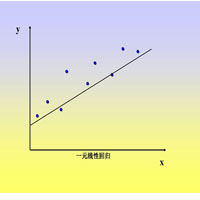
This index is used to calculate the linear regression slope of the K line in a period of time. The algorithm adopts the least square method.
1. Suitable for each cycle chart.
2. Can be used to calculate opening price, closing price, high price, low price, middle price.
3. Specify the start time and end time in the parameters.
Note that the start time and end time cannot be weekends, select the calculated price, pay attention to capital letters.
FREE
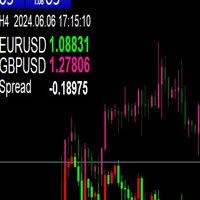
This indicator can be used to add a candle chart of another variety to the chart of the current variety.
1. The chart height will be adjusted automatically
2. If you switch the current icon period, the K of another variety will also switch to the corresponding period
3. In the upper left corner of the chart, the current cycle, the current time, and the current price and spread of the two targets will be displayed.
4. When switching cycle, due to a large number of data retrieval, it will oc
FREE

The Sentiment Ratio indicator gauges current Market Sentiment between -100% and 100%, where lower than -40% is considered Bearish and higher than 40% is Bullish. The channel between the two is considered Neutral. The indicator has been a very useful filter tool for signals within a trading system.
Example call function: int SentimentIndicator(double triggerLevel)//Return sentiment if trigger level is activated { double sentimentRatio=iCustom(NULL,0,"Sentiment Ratio",0,0,0); if(sentimentRat
FREE

Magneto Power MA - трендовый осциллятор. Основан на классическом индикаторе moving average, но при этом имеет нестандартный способ интерпретации. Здесь нет никаких фокусов с пересечениями мувингов, только гибридная работа MA и волатильности инструмента. При этом при должной настройке может составить конкуренцию дорогим и сложным аналогам. По гистограмме индикатора легко определить текущую тенденцию, а так же исчерпало себя движение цены или ещё нет. Настройки индикатора аналогичны классическому
FREE

This creative simple indicator will provide a precise framework for market sentiment within technical analysis of different timeframes. For instance, for traders like me that uses "Mark Fisher" strategy regularly, this is a perfect indicator for having an insight to markets from short term to long term point of view, using Break points of candles' lows and highs and perfect to combine with "Price Action" . For more options and modifications you can also edit the low timeframe candles withi
FREE
MetaTrader Маркет предлагает каждому разработчику торговых программ простую и удобную площадку для их продажи.
Мы поможем вам с оформлением и подскажем, как подготовить описание продукта для Маркета. Все продаваемые через Маркет программы защищаются дополнительным шифрованием и могут запускаться только на компьютере покупателя. Незаконное копирование исключено.
Вы упускаете торговые возможности:
- Бесплатные приложения для трейдинга
- 8 000+ сигналов для копирования
- Экономические новости для анализа финансовых рынков
Регистрация
Вход
Если у вас нет учетной записи, зарегистрируйтесь
Для авторизации и пользования сайтом MQL5.com необходимо разрешить использование файлов Сookie.
Пожалуйста, включите в вашем браузере данную настройку, иначе вы не сможете авторизоваться.