YouTubeにあるマーケットチュートリアルビデオをご覧ください
ロボットや指標を購入する
仮想ホスティングで
EAを実行
EAを実行
ロボットや指標を購入前にテストする
マーケットで収入を得る
販売のためにプロダクトをプレゼンテーションする方法
MetaTrader 5のためのエキスパートアドバイザーとインディケータ - 49

The indicator is getting the four most important trading sessions: New York London Sydney
Tokyo The indicator auto calculate the GMT time. The indicator has buffers that can be used to get the current session and the GMT.
You can use it as stand alone indicator and you can turn the draw off and call it from your EA. INPUTS Max Day: Max days back to get/draw. London Session On: Show/Hide London Session. New York Session On: Show/Hide New York Session. Sydney Session On: Show/Hide Sydney Sessi
FREE

SYMPHONY 8aは、8aSistemasによって開発された高度な投機システムであり、高度なフィルタリング方法を備えたインテリジェントな入出力および管理アルゴリズムを使用します。
ここでは特別なことは何もありません。聖杯のテストはありません。厳密なルールベースの取引アプローチであり、リスクを管理しながらリターンを最大化することができます。
推奨通貨ペア:EURCAD
各ペアで最適化されている限り、どの通貨ペアでも開発できます。
SYMPHONYは、市場が範囲内にあるときに機能します
各ブローカーの時間を最適化することは非常に重要です。このバージョンは、DARWINESUKサーバーで最適化されています。
推奨用語:M5
要件:
ヘッジ口座!
EAには、良好な仲介条件が必要です。つまり、ロールオーバー時間中のマージンが低く、ずれが発生します。本当に良いECNブローカーを使うことをお勧めします。あなたにアドバイスするために私に個人的に書いてください。
EAはVPSで継続的に実行されている必要があります
環境
FREE

TimeToClose The "TimeToClose" indicator is an essential tool for traders who need to monitor the remaining time before a candle closes. This indicator displays the remaining time directly on the BID line, providing a clear and precise reference during real-time trading. Key Features: Displays the remaining time for the current candle to close. Direct integration on the BID line for better visualization. Simple and user-friendly configuration. Ideal for all types of traders, from beginners to pro
FREE

A simple indicator/tool to display the current timeframe in the center of the chart. The object is automatically moved to the center of the chart whenever the chart size is changed by the user.
Input Parameters :
Font (default is Arial Black) Font Size (default is 50) Font Color (default is Silver, for light theme graphics, change to black or another dark color) Font Transparency (default is 90%)
FREE

The multi VWAP indicator will plot on your chart up to 7 different VWAPs: daily, weekly, quarterly and yearly plus up to 2 customizable intraday sessions. It will also plot the closing level of the previous period for each of the VWAPs displayed e.g. during the month of November you will see the VWAP closing level of October or during Q3 you will see the Q2's closing VWAP price. All levels can also display an optional label. Besides, in order to improve the indicator precision, it will automatic

Um Inside Bar é um dos principais sinais de continuidade de uma tendência existente e as vezes reversão, pois nos mostra locais especiais de entrada, possibilitando uma boa taxa de Risco x Retorno. É simples visualizar um Inside Candle. Esse padrão é formado por apenas dois candles. O primeiro deve ser, preferencialmente grande, e o segundo deve estar integralmente contido dentro dos limites de máxima e mínima do primeiro.

アカウント純資産保護ツールは、予期せぬ損失からアカウントの純資産を保護するための必須の実用ツールです。
このツールは、自動取引プログラムを使用するトレーダー向けに特別に設計されています。アカウントで複数の自動取引プログラムを同時に実行している場合、特に夜寝ている間にブラックスワンイベントや取引プログラムの障害が発生した場合、予想外の損失を被る可能性があります。このツールはこれらの問題を効果的に回避するのに役立ちます。
設定は非常に簡単で、保護したい金額を入力するだけです。現在のアカウントの純資産に基づいて適切な設定を行うことをお勧めします。設定が完了したら、「OK」をクリックしてプログラムのインターフェースに入り、「実行」をクリックします。右側の顔が笑顔に変わるのを確認できれば、プログラムが正常に実行されています。
プログラムが実行中の場合、アカウントの純資産が設定した保護値を下回ると、すべてのチャートが即座に閉じられ、取引プログラムも停止します。同時に、すべての注文が削除され、アカウントはもはやリスクにさらされません。
プロフェッショナル版にはさらに便利な機能が備わ
パーフェクトセコンドチャートインジケーターを使用すると、分のローソク足を秒に変換できます
1. バーを正確な時間で 100% 閉じるために任意の秒数を選択します。
2. これはレートベースのデータです。ティックが利用できない場合でも機能します。
3. 外部 DLL は不要で、VPS 上でスムーズに動作します
4. 高速で最適化されたコード
5. BInance、Kucoin、先物チャートを簡単に秒単位に変換できるその他すべての取引所などの暗号ペアをサポートします。
6. ゴールドや外国為替ペアなど、あらゆるタイプのシンボルをサポートします。
7. シンボルとレートを削除するオプション。 パーフェクトセコンドチャートインジケーターを使用すると、分のローソク足を秒に変換できます
1. バーを正確な時間で 100% 閉じるために任意の秒数を選択します。
2. これはレートベースのデータです。ティックが利用できない場合でも機能します。
3. 外部 DLL は不要で、VPS 上でスムーズに動作します
4. 高速で最適化されたコード

複数のポジション/取引を一度にオープンする必要がありますか?簡単なソリューションを作成しました。一度に複数のポジションを入力できるようになりました。ロットサイズ、ポジション数、テイクプロフィット、ストップロスを設定できます。 例: 特定のロットサイズで 3、5、10 または任意の数のポジションを購入したいとします。 「購入」ボタンをタップするだけで購入できるようになりました。 または 例: 特定のロットサイズで 3、5、10、または任意の数のポジションを売りたいとします。 「販売」ボタンをクリックするだけで販売できます。
Fukusū no pojishon/ torihiki o ichido ni ōpun suru hitsuyō ga arimasu ka? Kantan'na soryūshon o sakusei shimashita. Ichido ni fukusū no pojishon o nyūryoku dekiru yō ni narimashita. Rotto saizu, pojishon-sū, teikupurofitto, sutoppu

このインジケーターを使用すると、フィボナッチレベルのラベルを大きなフォントサイズで表示できます。
。 最大 25 のフィボナッチレベルをサポートします
- フィボナッチを描画するとすぐに、入力パラメータとして追加したレベルが、選択した色とフォントの大きなフォント サイズで表示されます。
カスタマイズ可能なオプション:
1.フィボテキストフォント
2.フィボテキストサイズ
3.フィボテキストの色
3. 各レベルに説明を追加します
4. アンカーや度数などのその他のオプション
このインジケーターを使用すると、フィボナッチレベルのラベルを大きなフォントサイズで表示できます。
。 最大 20 のフィボナッチレベルをサポートします
- フィボナッチを描画するとすぐに、入力パラメータとして追加したレベルが、選択した色とフォントの大きなフォント サイズで表示されます。
カスタマイズ可能なオプション:
1.フィボテキストフォント
2.フィボテキストサイズ
3.フィボテキストの色
3. 各レベルに説明を追加しま
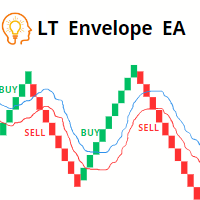
当社の革新的なLTエンベロープEAをご紹介いたします。エンベロープ指標を活用した強力なツールで、トレンド追跡を強化し、金融市場での取引を最適化することを目指しています。このエキスパートアドバイザーは、トレーダーに優れた主要機能と柔軟性のある機能を提供するよう特別に設計されており、トレンド追跡に不可欠な解決策となります。
主な特徴:
1. エンベロープ指標ストラテジー:当社のEAはエンベロープ指標に基づくすべての取引を自動化し、トレンド追跡の能力を活用して市場のエントリーと出口を正確に行います。
2. タイムフレームの多様性:複数のタイムフレームで当社のEAを使用する自由を体験し、さまざまな取引スタイルや好みに対応します。
3. カスタマイズ可能なトレード方向:EAを独自のトレード戦略に合わせて調整し、希望のトレード方向を選択することで、取引に対するより多くの制御を得ることができます。
4. スマートなマネーマネジメント:リスク管理を自分でコントロールし、独自のロット割合を設定することで、最適な資本配分を確保します。
5. 複数の取引管理:当社のEAは複数の取引

市場構造は、より高い時間枠でのブレイクアウトがトレーダーにトレンドをクリアするのに役立つ可能性があるものです.
1. このインディケータは最後の 2 つの構造 (ZigZag の前の高値と安値) のみに ZigZag を描画し、ZigZag の新しいバーは構造のブレークが発生したときにのみ形成されます。
2. 構造体の破壊時にターミナルとプッシュ通知を提供
3. [ と ] キーから ZigZag の Extdepth を増減して、スイングを調整します。
4. Line AB BC と CD の色を変える
5.多くのチャートに追加し、複数のシンボルでアラートを取得します
Break of Structure Multi ExtDepth Breakout Multi Symbol Scanner を探している場合は、この製品を使用できます。 Multi Symbol Multi ExtDepth ZigZag Breakout Scanner

1、このトラッキングシステムはローカルトラッキングシステムであり、つまり送信側と受信側は同じコンピュータで操作しなければならない。MT 4/5アカウントは複数のコンピュータで同時に登録できるので、読み取り専用アカウントのパスワードを顧客に送るだけでいい。ローカル荷為替は、ネットワークの荷為替速度に関係しないので、非常に安定しています。
2.現在は受信端末であり、グラフにロードする時は、入力パラメータの中で「senderAcceount」を髪端のmt 4/mt 5アカウントに変更すれば正常に動作できます。また、送信端をインストールする必要があります。
3.サポートとマルチフォローをお願いします。複数のMT 4/MT 5を実行すれば、いくつのインボイスを実行できますか?同じプラットフォームはコピーしてインストールしたフォルダで同時に複数のアカウントに登録することができます。
4.mt 4受信側でmt 5送信を受信し、mt 4と単mt 5を実現し、mt 5と単mt 5もサポートする。
5.機能紹介:
同プラットフォーム/クロスプラットフォームのフォローアップをサポートし
FREE
TP SL Bot is a utility that automatically sets Stop Loss and Take Profit for newly opened orders in several ways. There is also a function for calculating the volume that you need to open the trade to get the desired amount with the specified Stop Loss / Take Profit size. There are several options for calculating the size and setting parameters: 1. Setting based on the amount specified by the user as a percentage of the current deposit balance. 2. Setting as the amount entered by the user. 3. Se

Simple ATR Modern 市場のボラティリティをより明確に追跡するためのシンプルなツールで、デイトレードやスイングトレードに最適です。 取引を開始する際や初心者にとって最適なインジケーターです。
ビジュアルインジケーターの色: ATR Daily - 青 Volatility Vision インジケーターと組み合わせて分析を強化しましょう。 市場の状況の変動を正確に測定し、デイトレードやスイングトレードの意思決定に不可欠です。 基本的な14日間(設定可能)の単純移動平均の真の範囲インジケーターを利用して正確性を確保します。 取引システムにおける取引開始または終了戦略の実施に理想的で。 ATR インジケーターが他より優れている理由: 簡単に使用できる: ATR インジケーターは設定が簡単で、初心者のトレーダーでも理解しやすいです。 汎用性: デイトレードやスイングトレードのどちらにも適しており、さまざまな取引戦略に柔軟に対応できます。 信頼性: ATR は正確な市場ボラティリティデータを提供し、トレーダーがより賢明な判断を下すのに役立ちます。 カスタマイズ可能: 移動平均期

Pips Hunter PRO は数年かけて開発され、前作の改良版です。この強力なインジケーターは、マーケットと価格の履歴を分析し、売買エントリーを生成します。これらのエントリーの計算には、複雑な統計的対数だけでなく、連動する様々なインジケーターを使用し、不利なエントリーをフィルタリングして排除します / MT4バージョン 。 ストラテジーの高い効率性を維持するための絶え間ない探索により、価格は徐々に上昇し、1000ドルに達します。次回価格→ 69ドル
特徴 リペイントなし
このインディケータは、新しいデータが到着してもその値を変更しません
ラグなし このインディケータはラグがありません 取引ペア
すべてのFXペア (できればEURGBP)
時間枠
すべての時間枠
パラメータ ===== 表示
矢印の距離 // シグナル(矢印)とローソク足の距離
===== アラート
ポップアップアラート // MT4ターミナル用のアラート
プッシュ通知 // 携帯電話向けアラート
メールアラート // メールアラート
===== チャ
経済ニュースをダウンロードするためのスクリプト。履歴インジケーター付きの経済ニュースカレンダーが機能するために必要です。 https://www.mql5.com/ja/market/product/34706
サイトfxstreet.comからデータをダウンロードし、CSV形式で端末の共有フォルダーに保存します。
使用方法(デモバージョンのテスト方法については、以下のビデオをご覧ください): MT5設定で許可されるURLのリストに http://calendar.fxstreet.com/eventdate/を追加します mql5.comからスクリプトとインジケーターをダウンロードしてインストールします 目的の通貨ペアのチャートを開きます ナビゲーターパネルでスクリプトを見つけて、チャートにドラッグします。 ナビゲーターパネルでインジケーターを見つけて、チャートにドラッグします。 経済ニュースはチャートに表示されます。
FREE

The Strat を使用して取引する場合、複数の時間枠に注意することが重要です。 このインジケーターは、各時間枠の現在のローソク足の毎日、毎週、毎月、および四半期ごとの状態を示します。 円のアイコンは、その時間枠のろうそくが現在インサイド、または TheStrat 用語でタイプ 1 であることを示します。 Inside Day ローソク足が値動きを強化しており、レンジのブレイクアウトを探しています。 上向きまたは下向きの三角形のアイコンは、トレンド キャンドル、または TheStrat 用語ではタイプ 2 です。トレンドろうそくは強気または弱気のいずれかであり、以前のろうそくの範囲を突破し、現在一方向にトレンドになっていることを示します. 正方形のアイコンはアウトサイド キャンドル、またはストラト用語でタイプ 3 です。これは 2 つのことを示しています。1 つはその時間枠での方向性について価格が未定であり、おそらく非常に途切れ途切れであるということです。もう 1 つは、より短い時間枠では短い反転取引を行う良い機会がある可能性が高いということです。正方形は強気または弱気の色になり、ど

作業ロジック この指標の重要性は、「燃料が機器に残っている」量を理解できるという事実にあります。状況を想像してみてください。あなたが半分放電したバッテリーを搭載した車に残した場合、平均して、この量のエネルギーは通常250 kmの車に十分であるため、必要に応じて700kmの距離を超えることはできません。そのため、商品ごとに一定の日次価格変動があり、統計的観察の結果、資産が1日あたり1 ATRを通過する時間の95%、2以上のATRを通過する時間の5%のみであることが明らかになりました。
例、毎日のATR EURUSD = 682ピップ。トレードに参加します。たとえば、TPが500ピップのレベルのブレイクアウトの場合、正しいTPサイズを設定したように見えますが、資産がすでに1日のATRの90%を通過していることを考慮していません。取引が開始された時間、したがって、楽器にはTPを受け取るのに十分なエネルギーがない可能性があります。楽器の残りのチャージが10%しかない場合は、TPを調整するか、取引にはまったく参加しません。
パワーリザーブインジケーターは、計測器が慣性を使い果たした量を
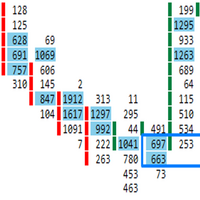
最高の価値を見つけるために 1 年間最適化する
注文フローは、ボリュームを取引するという点でユニークです。 EUR/USD で作成され、1 時間足チャートで 2021 年 11 月 11 日から 2022 年 10 月 24 日まで最適化されています。 資金管理の最適化入力が使用されます。 この EA は厳格な資金管理を使用しており、一攫千金のクイック マーチンゲールや sl のない EA ではありません。 トレーディングはギャンブルではなく、リスク管理に関するものです。 EUR/USD の 1 時間足チャートで実行するか、最適化する他の資産と時間枠を見つけたい場合は、1 年間のデータで最適化します。 最高の価値を見つけるために 1 年間最適化する
注文フローは、ボリュームを取引するという点でユニークです。 EUR/USD で作成され、1 時間足チャートで 2021 年 11 月 11 日から 2022 年 10 月 24 日まで最適化されています。 資金管理の最適化入力が使用されます。 この EA は厳格な資金管理を使用しており、一攫千金のクイック マーチンゲールや sl

VSAゴール この指標は、VSA(Volume Spread Analysis)システムを使用してチャート上のプロの買い手またはプロの売り手を識別し、これらのバー(ローソク足)および目標レベルに対す 特徴: 1. このインジケータでは、プロの買い手またはプロの売り手のみが決定され、両方のプロの参加者が同時に決定されるモードを選択することができます。 2. シンボルに任意の時間枠を設定して、サポートゾーンと目標レベルを決定することができます。 取引時には、サポートゾーンと目標レベルを決定するために大きな時間枠が設定され、取引自体はより正確な取引への参入のために小さな時間枠で実 3. インジケータ設定では、ティックボリュームが使用されている場合はティックボリュームを選択し、実際のボリュームが使用されている場合はリアルボリュームティックボリュームを選択することができます。 4. 大規模な販売者または購入者を決定するときは、ボリュームサイズとこのボリュームの検索期間を手動で選択できます。 5. 専門家を作成するために使用することができます。 説明: 緑色の点線は、購入者のサポートゾーンで

ここまでお越しいただいたということは、すでに ストラテジースキャナー の無料バージョンをご存知のことでしょう。 そして、アラート機能が必要な理由は重要です: MetaTraderでのアラート 携帯電話でのアラート メールでのアラート 音声アラート これらのアラートは、Rule Plotter Scannerのラインで異なる矢印が表示されるたびに通知されます。 音声アラート、MetaTraderでのアラート、スマートフォンでのアラート、メールでのアラートの中からお選びいただけます。 Rule Plotterのラインの力を最大限に活用し、このツールでRule Plotter Scannerからのアラートを受け取りましょう。 ご興味とご購入、誠にありがとうございます。こちらに友達として追加しておいてください。MetaTrader向けにさらに無料および有料の製品を提供する際にお知らせします: Rule Plotterの開発者 。

このツールは、ポジションにストップを配置します
Metatrade Strategy Tester ですばやくテストします。 ロング ポジションの場合、ストップは最後の底になります。 または、ショート ポジションの場合、ストップは最後のトップになります。
さらに、このツールはオープン ポジションのトレーリングを管理します。 常に最後に形成された高値または最後に形成された底にストップを置きます
上値と下値を作成するには、このリンクからダウンロードできる無料のインジケーター「サポートとレジスタンス ライン」を使用します: メタトレード 5 の無料の上下インジケーターをダウンロード
このツールは、挿入された資産のすべてのオープン ポジションのストップを移動します。

AITradeMaster is an advanced Expert Advisor (EA) system developed on the MQL5 platform, utilizing the latest advancements in neural networks and deep learning. Designed for maximum automation and ease of use, AITradeMaster requires no additional settings from the user, allowing even novice traders to benefit from its functionality.
Key Features: Automatic Settings : All trading parameters are automatically generated by the implemented neural network. The user does not need to worry about con

損益分岐点レベルを自動的に設定するためのユーティリティで、指定された距離を通過するときに取引を損益分岐点に転送します。リスクを最小限に抑えることができます。トレーダーのためにプロのトレーダーによって作成されました。ユーティリティは、トレーダーが手動で、またはアドバイザーを使用して開いたすべての成行注文で機能します。魔法数で取引をフィルタリングできます。ユーティリティは、同時に任意の数の注文を処理できます。
MT4バージョン https://www.mql5.com/en/market/product/57076
ユーティリティでできること:
1ピップから仮想ブレークイーブンレベルを設定 損益分岐点の実際のレベルを設定する 各注文を個別に処理します(ブレークイーブンレベルは注文ごとに個別に設定されます) 一方向注文のバスケットで作業します(損益分岐レベルはすべての注文に共通に設定され、購入と販売は別々に設定されます) 双方向注文のバスケットを操作します(ブレークイーブンレベルはすべての注文に共通に設定されており、一緒に購入と販売を行います) テストと作業には、チャートのボタ

ストップレベルを追跡することにより、取引を自動的に成立させるためのユーティリティ。利益を最大限に活用することができます。トレーダーのためにプロのトレーダーによって作成されました。ユーティリティは、トレーダーが手動で、またはアドバイザーを使用して開いたすべての成行注文で機能します。魔法数で取引をフィルタリングできます。ユーティリティは、同時に任意の数の注文を処理できます。
MT4バージョン https://www.mql5.com/en/market/product/56487
ユーティリティでできること:
1ピップから仮想トレーリングストップレベルを設定します 実際のトレーリングストップレベルを設定する 各注文を個別に処理します(トレーリングストップレベルは各注文に個別に配置されます) 一方向注文のバスケットで作業します(トレーリングストップレベルはすべての注文に共通に設定され、購入と販売は別々に設定されます) 双方向注文のバスケットを操作します(トレーリングストップレベルはすべての注文に共通に設定され、一緒に購入と販売を行います) テストと作業には、チャートのボタンを使

A professional line break chart which is displayed directly in the chart window thus making it possible to trade directly from the MetaTrader 5 charts. The line break chart can be displayed as the most widely used 3 line break chart or a custom variation such as 2 or 5 line break chart . Wicks can be displayed or hidden on the chart - they give a lot of additional information regarding the underlying price action. The indicator's settings include: Line break number - determines the number of lin

このユーティリティは、取引口座の取引を複製するために設計されています。プログラムは、あなたのパラメータで追加の取引を開きます。ロットの増減、ロットの追加、ストップロスやテイクプロフィットのパラメーター変更などの機能を備えています、プログラムは「Windows PC」と「Windows VPS」で動作するように設計されています。 Buy a cloner and get the second version for free
パラメータ CLONE_POSITIONS - 複製するオーダーを指定します。 MAGIC_NUMBER - マジックナンバー. DONT_REPEAT_TRADE - trueの場合、手動で決済した後、取引は繰り返されません。 REVERSE_COPY - 逆コピー。例えば、BUY の代わりに SELL をオープンします。 LOT_MULTIPLIER - PROVIDERアカウントからの数量コピー率で、=0の場合はFIXED_LOTで指定したロットでコピーします。 PLUS_LOT, MINUS_LOT - プラスとマイナスのロット。 MAXIMUM

通貨強度メーターは、現在どの通貨が強いか、どの通貨が弱いかをすばやく視覚的にガイドします。 メーターは、すべての外国為替クロスペアの強度を測定し、それらに計算を適用して、個々の通貨の全体的な強度を決定します。 28ペアのトレンドに基づいて通貨の強さに基づいて計算します。
MQL5ブログにアクセスすると、インジケーターの無料バージョンをダウンロードできます。 Metatrader Testerの制限なしで、購入する前に試してみてください: ここをクリック
1.ドキュメント すべてのトレンド通貨強度のドキュメント(手順)と戦略の詳細は、MQL5ブログのこの投稿で入手できます: ここをクリックしてください。
2.お問い合わせ ご不明な点がある場合やサポートが必要な場合は、プライベートメッセージでご連絡ください。
3.作成者 SAYADI ACHREF、フィンテックソフトウェアエンジニア、Finansyaの創設者。

Ez Channel インジケーターは、チャート内の実際のトレンドチャネルを自動的に識別するため、トレンドフォロートレーダーにとって不可欠なツールです。このインジケーターを使用すると、チャート上にトレンド ラインを手動で描くために何時間も費やす必要がなくなります。任意のシンボルと時間枠のトレンド チャネルをすばやく描画することで、時間と労力を節約します。 Ez Channel の主な機能の 1 つは、好みに応じて期間を簡単に調整できるミニ コントロール パネルです。このコントロール パネルでは、新しい市場の動きによる変化が発生する前に、識別されたチャネルを保存することもできます。この機能により、傾向線を再描画する手間をかけずに、市場の傾向を簡単に追跡および分析できます。 Ez Channel はすべてのシンボルとタイムフレームに適しているため、多用途でさまざまな取引戦略に適用できます。これにより、識別されたチャネルを将来の使用に備えて保存することができ、これらの保存されたチャネルを任意の時間枠で表示することができます。この機能により、さまざまな時間枠にわたる傾向を比較および分析できるよ

Технический индикатор "Reversal patterns" является математической интерпретацией классических разворотных паттернов: Pin Bar, Harami и Engulfing. То есть «Разворотного бара», «Харами» и «Поглощения». Данный индикатор позволяет определить момент разворота котировок на основе рыночной динамики и победителя между «быками» и «медведями». Индикатор отображает момент разворота на локальных максимумах и минимумах графика любого таймфрейма, что позволяет повысить точность сигнала. Также индикатор имеет

Introduction to GARCH Indicator GARCH is the short initial for Generalized Autoregressive Conditional Heteroskedasticity and it is the volatility prediction model commonly used in financial industry. GARCH model was first appeared in the work by Danish Economist, Tim Peter Bollerslev in 1986. The 2003 Nobel Prize winner, Robert F Engle also added much contribution for the refinement of GARCH model with Tim’s work. Our GARCH INM predictor took the original method of Nelder Mead for GARCH model bu
FREE

This indicator can help you clearly identify trend changes in both bullish and bearish markets. The indicator compares the closing price of the last candle with the closing price of the candle "X" periods ago (input parameter). In an uptrend, an initial number '1' is plotted if a candle closes higher than the closing of a candle "X" periods ago. In a downtrend, an initial number '1' is plotted if a candle closes below the closing of a candle "X" periods ago. Subsequent numbers are plotted when e
FREE

The EA does not use grid, martingale, and arbitrage. The trading system is suitable for both experienced traders and beginners. The EA includes protection against high spread. Works well with the default settings. Provides a SAFE approach towards risk management with enabled Trailing stop. Expert Advisor will only use 1% of your free margin as risk and hence results in low trade volume but LOWER Drawdown as well
Important Information Revealed By purchasing this Expert Advisor you are entit

Spike Hunter has been developed for Crash and boom markets.
Spike Hunter does not repaint.
Also please download SPIKE HUNTER(B)-boom and SPIKE HUNTER(B)-crash from the comments section to assist with extra confirmation Buy Signal ; Make sure that the trend for boom is Uptrend on 15 and 30min. Use the SPIKE HUNTER(B)-boom on your chart. Once the Up arrow comes on and the SPIKE HUNTER(B)-boom line color is blue then its the best time to trade. Sell Signal ; Make sure that the trend for crash

No Nonsense Forex メソッドのための完全なトレードパネルです。このパネルには、あなた自身のNNFXアルゴリズムを実行するために必要なほとんどすべてのものが集約されており、あなたがより速く、より簡単にトレードできるようになっています。3つの部分で構成されています。 シンボルパネル
シンボル名を押すと、チャート内の任意のシンボルに素早く切り替えることができます。 パネルには、現在開いている取引、それらの取引と他のシンボルとの相関関係(ストップロスがブレークイーブンまたはプラスの場合を除く)、今後のニュース(次の日のローソク足、ローソク足の終値で取引する場合)などの追加情報を表示できます。 ニュースはForex Factoryからインポートされ、デフォルトのフィルタリングされたニュースはVPがNo Nonsense Forexで推奨しているものとなっています。ニュースを変更したい場合は、あなたの完全なカスタムニュース(大文字と小文字を区別します)を含むニュースが表示されることを考慮してください。 タイムゾーンはEET/EEST(メタトレーダーと同じ)で、表示されるニュース

メタトレーダー用ボリュームプロファイルインジケーターで、ボリューム分析の威力を実感してください! / MT4バージョン
ベーシックボリュームプロファイルは、取引の最適化を目指すマニュアルトレーダーのために特別に設計されたインジケーターです。ボリューム・プロファイル・インジケータは、市場の動きをより深く理解したい本格的なトレーダーにとって不可欠なツールです。当社の革新的なソリューションにより、取引量が価格にどのように分布しているかを明確かつ簡潔に視覚化することができます。これにより、支持線・抵抗線、集積・分配ゾーン、重要なコントロール・ポイントなど、主要な注目エリアを特定することができます。特定の日の取引量を表示する通常の出来高インジケーターとは異なり、ベーシック・ボリューム・プロファイルは特定の価格における取引量を表示します。
当社のインジケータは、直感的でカスタマイズ可能なインターフェイスを備えており、お客様の取引の好みに合わせてカスタマイズすることができます。
特徴 価格チャート上に出来高プロフィールを明確に表示。 出来高の多いエリアと少ないエリアを素早く識別。
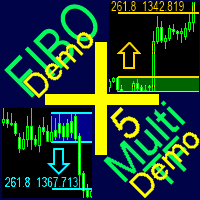
A ready-made multitimeframe trading system based on automatic plotting and tracking of Fibonacci levels for buying and selling any symbol. Demo version - calculation of the last 390 bars is not performed.
Advantages Determines the trend direction based on a complex of 14 indicators ( Cx ), extremums of ZigZag ( Z ), RSI ( R ), Impulse ( I ) Displaying the values of 14 indicators comprising the trend direction ( Cx ) Plotting horizontal levels, support and resistance lines, channels View the pl
FREE

The Market Reversal Catcher indicator looks for market reversal points or major pullback. To do this, it analyzes previous price movements and using a flexible algorithm for estimating the probability of a reversal, also gives recommendations on entry points and sets recommended profit targets for positions opened on a signal. Market Reversal Cather User Guide - Read Version for MetaTrader 4 - here The indicator is very easy to use and does not require a lot of information to understand how it

To get access to MT4 version please click here . This is the exact conversion from TradingView: "Candle body size" by "Syamay". This is a light-load processing indicator. This is a non-repaint indicator. Buffers are available for processing in EAs. All input fields are available. You can message in private chat for further changes you need. Thanks for downloading
FREE

Get all benefits of a grid strategy and none of its disadvantage | Built by a grid trader >> for grid traders.
This is MT5 version, click here for Blue Sonic Donchian MT4 (settings and logics are same in both versions) Real monitoring signal --> Sonic Gold | Sonic Fx Intro BlueSonic Donchian EA ('Sonic') is a next-gen multi-currency multi-timeframe EA base on Donchian indicator. Other than normal one-off entry, users would have option to activate grid series to maximize return f

インジケーターには 2 つの部分が含まれています。
パート I: カラーキャンドルが主要なトレンドを示す
カラーローソク足とは、ローソク足の色で相場の状態を識別することです。
スクリーンショットに示されているように、色がアクアの場合、市場はロング注文を発注するか、ショート注文を終了する必要がある状態です。色がトマトの場合は、ショート注文を行うか、ロング注文を終了する時期です。
色が変化している場合は、その完了を (現在のバーが閉じるまで) 待つことをお勧めします。
パート II: バンドを描く
内側のバンドは安全領域として定義され、外側のバンドはクローズオーダー用です。
以下のような取引戦略:
色がアクアで、価格が内側のバンド内にある場合は、ロング注文を出します。価格が外側のバンドを超えたら、注文を閉じる時期です。 色がトマトで、価格が内側のバンドにある場合は、ショート注文を出します。価格が外側のバンドを越えたら、注文を閉じる時期です。 注:価格が内側のバンドの場合のみエントリーマーケットです。これは非常に重要です。
入力パラメータ ShowC

Ultimate Breakout Scanner (Multi Pair And Multi Time Frame) : ---LIMITED TIME OFFER: NEXT 25 CLIENTS ONLY ---46% OFF REGULAR PRICE AND 2 FREE BONUSES ---SEE BELOW FOR FULL DETAILS Breakout trading is one of the most popular trading approaches used in the institutional trading world.
As it takes advantage of the never ending phenomena of price expansion and contraction (through volatility) .
And this is how institutional traders are able to take advantage of explosive moves in the market .

FRB Candle Time
Indicator showing the time left for the next candle You can edit font color and size. Very important indicator for Traders. To move time, just click on it and move the mouse to where you want to leave it. After positioning the time where you want it, click again or press "ESC" and the time will stay where you left it.
Settings font color Font size Background color
FREE

This reliable, professional trade copier system is without a doubt one of the best on the market, it is able to copy trades at very fast speeds from one master account (sender) to one or multiple slave accounts (receivers). The system works very fast and mimics the master account a full 100%. So changing stop losses, take profits, pending orders on the master account is executed on the slave accounts too, like each other action. It is a 100% full copy (unlike many other copiers who only copy ma
FREE

The indicator shows the number and ratio of ticks with the price growth and fall for each candle of the chart. The upper part of the histogram in the form of thin lines shows the number of price growth ticks (bullish strength), while the lower part shows the amount of price fall ticks (bearish strength). The thicker histogram bars is the difference between the strength of bulls and bears. A positive difference is displayed in green, and the negative one is red. The strength of bulls increases wh
FREE

Product Description: Adaptive Y-Axis Scaling is a powerful MT5 indicator designed to enhance your trading experience by providing precise control over the Y-axis (price) scaling of your charts. This innovative tool allows you to customize the price scaling by specifying the number of pips from the visible chart's highs and lows. The calculated price range from this input is then used to set the maximum and minimum prices for the open chart, ensuring an optimized and comprehensive view of market
FREE

Trade in the opposite directions with HedgeTerminal HedgeTerminal is a full-featured trading terminal inside MetaTrader 5. This is a graphic panel resembling MetaTrader 4 terminal. It allows you to track oppositely directed positions in the manner it is possible in MetaTrader 4. In other words, we can open unlimited number of positions on a single symbol even if positions are in complete or partial hedge (lock). Thus, you can maintain long and short positions simultaneously, which is impossible
FREE

Risk Optimizer is the absolute solution for applying risk management on your account. Bad risk management is the main reason that causes traders to lose money. Risk Optimizer calculates and suggests the correct lot size for each position according to your personal, customized risk profile. You can give directly your preferred risk as percentage (%) for each position or you can trust our algorithms to calculate and optimize according to your risk category selection. But it is not only that! Selec
FREE

Donchian通道(唐奇安通道指标)是用于交易突破的最古老、最简单的技术指标之一。 一般来说,唐奇安通道的宽度越宽,市场波动就越大,而唐奇安通道越窄,市场波动性也就越小 。此外,价格走势可以穿过布林带,但你看不到唐奇安通道的这种特征,因为其波段正在测量特定时期的最高价和最低价。 交易实用必备工具指标 波浪自动计算指标,通道趋势交易 完美的趋势-波浪自动计算通道计算 , MT4版本 完美的趋势-波浪自动计算通道计算 , MT5版本 本地跟单复制交易 Easy And Fast Copy , MT4版本 Easy And Fast Copy , MT5版本 本地跟单复制交易 模拟试用 Easy And Fast Copy , MT4 模拟账号运行 Easy And Fast Copy , MT5 模拟账号运行 唐奇安通道指标计算: 唐奇安上阻力线 - 由过去N天的当日最高价的最大值形成。 唐奇安下支撑线 - 由过去N天的当日最低价的最小值形成。 中心线 - (上线 + 下线)/ 2 唐奇安通道信号 唐奇安通道常用作突破指标。它提供了两种主要类型的突破信号,一个是上阻力线或下支
FREE

Smart Range Breakout EA is a fully automated time range breakout strategy, which uses calculated trailing stop-loss to trade high volume moves on the market. The strategy comes with not overly optimized default settings, however it can be experimented with. This expert advisor does not use any martingale, grid or similar techniques, therefore there are no spikes in the relative equity drawdown. LIVE PERFORMANCE : https://www.mql5.com/en/signals/1823580 The strategy works best on USDJPY and EURU

Indicator that show candlestick bars with an different sampling method than time fixed. Real time data is sourced to the indicator and it may be used as substitute of the default graph. Each bar is formed when a predefined volume of assets was dealt, showing in the graph the OHLC of this clustering. The amount of bars is proportional to the amount of negotiations instead of a sample in a fixed amount of time. If the broker doesn't show the real volume of the trades, this indicator won't work. Th
FREE
Daily Drawdown Control is most easy and effective EA to protect your account from over Daily Drawndown limit of Prop Firm. - This EA is used for MT5 only. - Initial Balance is balance at the moment of Daily Drawdown limit reseted, it doen't care about floating profit/loss. - You just input Drawdown litmit percentage and resetting time. - If actual loss is over setting value, EA will close all positons and delete all orders immediately ( Reach DD : true)
FREE

FractalEfficiencyIndicator A ratio between 0 and 1 with the higher values representing a more efficient or trending market, It is used in the calculation of Perry J. Kaufman Adaptive Moving Average (KAMA), dividing the price change over a period by the absolute sum of the price movements that occurred to achieve that change. The Fractal Efficiency or also known as Efficiency Ratio was first published by Perry J. Kaufman in his book ‘Smarter Trading‘. This is mostly considered a filter for v
FREE

Классический индикатор фракталов является запаздывающим, т.к. для подтверждения образования фрактала необходимо ждать 2 бара. Если этого избежать, то индикатор будет перерисовывающим, т.е. при обновлении максимума/минимума в течении 2-х баров фрактал будет менять своё положение на более позднее. В данном продукте максимально нивелированы оба этих недостатка, при этом совмещены достоинства обоих подходов! Индикатор показывает фрактал сразу в момент его образования, а в случае его обновления показ
FREE

Au79 is a powerful trading robot designed to help you profit from the XAUUSD market on the H4 timeframe. Using a sophisticated algorithm and advanced indicators, Au79 is optimized to deliver consistent and reliable results over time. Our backtesting and optimization process has been rigorous, testing the EA from January 1, 2019, to March 30, 2023, using real ticks with a history quality of 99%. This ensures that the EA performs well in a range of market conditions, and that its results are accur
FREE

This indicator displays fractal symbols and bars Use this indicator to show different symbols for bearish and bullish fractals: Choose from 144 symbols (refer to table below) Colors, size and offset of fractals can be modified Fractal price bar or candle color can be changed Hide fractals and show fractal price bar only Frequency in fractal calculation can be changed
How to use 1. Select which symbols to use for bearish and bullish fractals; 2. Select which colors to use for bearish and bulli
FREE

Title : Surefire Hedging Expert Advisor for MT5 Description : Introducing the Surefire Hedging Expert Advisor (EA) for MetaTrader 5, a sophisticated algorithm designed to minimize risk and maximize profits in the Forex market. This EA is perfect for traders who seek a reliable, robust, and user-friendly solution to enhance their trading experience. Key Features : Advanced Surefire Hedging Strategy : The EA employs a proven Surefire Hedging strategy, which involves opening multiple trades in

Tyrell Strategy 2 is a professional trading strategy based on the key concepts of Technical Analysis and developed by a team of traders and programmers with many years of experience.
The Expert Advisor operates by placing pending Buy Stop orders and exploits the price movements that occur following the creation of specific volatility patterns. Tyrell Strategy 2 is equipped with several risk management systems, including a trailing stop that intervenes once the market order exceeds a specific

Description. Bill Williams fractal indicator. Unlike fractals in standard delivery, this indicator allows you to select the number of candles on both sides of the fractal and displays the position of fractals with lines from the moment they appear, which is very convenient both visually and when building a trading system. Allows you to determine the points of a potential trend reversal, the position of support and resistance levels. Input-parameters:
LeftBars = 2; RightBars = 2;
FREE

The Equity Curve indicator is a simple and helpful tool that shows the development of the equity curve in real time. For precision measurement, it should be used in a separate window with a period of M1.
Main features The indicator shows the development of the equity curve in real time. High precision on the minute chart. High-speed calculation. Available for MT4 and MT5. Please visit the Equity Curve indicator product page for the input and output parameters settings.
FREE

The technical indicator Wave Vision measures the relative strength of the trend movements of the price from its average values over a certain time period. The histogram shows price movement strenght relative to the zero level line. Histogram values close to zero indicate the equality of forces between buyers and sellers. Above the zero level line - bullish trend (positive values of the bar chart). Below the zero level line - bearish trend (negative values of the bar chart).
Settings:
Smoo
FREE
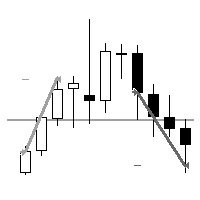
"AV Level EA MT5" is an Expert Advisor for the MetaTrader 5, which is intended exclusively for the german DAX (DE40, GE40, etc.) and is also available as a free version with MinLot to try out.
NEW: More ways to close, third entry.
Strategy:
- Level Trading, DAX M15 (also M5 or M30)
- Entry: Buy level 75, sell level 25
- Exits: TP = 25 (i.e. approx. 00 level) or TP = 50 (buy 75 level, sell 25 level)
- Second entry in the event of a reset, distance e.g. 25 or 50 (it does not ta
FREE

1. Торговая стратегия Что делает советник: Советник следит за некотоными индикаторами и при определенном условии (или условиях) помещать торговый запрос (на продажу или покупку) в зависимости от условий. Стратегия:
Используем индикатор Moving Average (скользящие средние) с периодом 8 (вы можете выбрать любой период, но в данной стратегии мы будем использовать период 8). Советник покупает, если 8-периодная скользящая средняя (далее для удобства будем называть ее MA-8) возрастает и текущая цена з
FREE

THE GOAT INDICATOR ON THE MQL5 MARKET! ️ GET THIS INDICATOR AND STOP LOOKING FOR ANOTHER INDICATOR ️ ️ GET IT NOW BEFORE PRICE INCREASE! ️ SPECIAL DISCOUNT FROM 138$ -> NOW ONLY 88$!!! 2020 Breakthrough Indicator! Imagine that indicators can move the price/market! This indicator use for predict price movement! Using special algorithm for predicting the next price movement! This indicator can be used in any timeframes and any symbols! You can use it for binary option signal

Ultimate Pinbar Scanner (Multi Pair And Multi Time Frame) : ---LIMITED TIME OFFER: NEXT 25 CLIENTS ONLY ---46% OFF REGULAR PRICE AND 2 FREE BONUSES ---SEE BELOW FOR FULL DETAILS A strong pinbar is clear evidence that the institutions are rejecting a particular price level.
And the more well defined the pinbar, the higher the probability that the institutions will
soon be taking prices in the opposite direction.
Pinbar patterns are widely used by institutional traders around the world.

MACDヒストグラムインジケーターは、トレーダーが市場のトレンドと勢いの変化を理解しやすくするために設計されたMACDインジケーターの更新版です。オリジナルのMACDとは異なり、このバージョンにはヒストグラムが含まれており、これはMACDラインとシグナルラインの2つのラインの差を示す棒グラフです。 動作の仕組みは次のとおりです。MACDラインがシグナルラインの上にある場合、強気市場を示唆し、ヒストグラムのバーは緑色で表示されます。一方、MACDラインがシグナルラインの下にある場合、弱気市場を示し、ヒストグラムのバーは赤色になります。 MACDヒストグラムインジケーターの興味深い点は、市場の勢いが変わるとバーの色も変わることです。したがって、勢いが強気から弱気に変わると、バーは緑から赤に変わり、その逆もあります。 もう1つの便利な機能は、価格の動きとMACDインジケーターの間の違いを検出しやすくし、ペアの潜在的な発散を強調し、市場の逆転の可能性を示唆することです。 このインジケーターは、ユーザーの好みに応じてMACDラインとシグナルライン、およびヒストグラムを非表示にすることもでき、イン
TrendFollowMT is a fully automated trading system which is using large time frame to determine the trend and use small time frame to find the entry point. Once the trend changed to opposite side, the system will wait for another entry point to recover with bigger lot size. Moreover, the target profit will be moved up when more position had been opened. The aim is to cover the cost of waiting time and risk.
Free version will only trade on buy signal and locked the initial Lot size (0.01). Paid
FREE

Welcome To Gold Hunt Real Account Trading Report: Click here The Gold Hunt EA is a unique, fully automatic trading program designed by a trader with 10 years of experience. It doesn't need any monitoring and is based on strategies used by hedge funds. This expert advisor relies entirely on mathematical algorithms to trade. It always aims to close trades in profit. The strategy was used manually for five years and has now been converted into this automatic trading system, which specializes in t

The tool is intended to help traders who cannot look at the chart all the time, or who use several charts, the trader can mark regions of interest as supports and resistances and as soon as the price approaches these regions an audible warning and on the screen will be presented for the trader to take some action, in addition the tool can automatically mark the highs and lows of the day and time.
FREE
MetaTraderマーケットは自動売買ロボットとテクニカル指標を販売するための最もいい場所です。
魅力的なデザインと説明を備えたMetaTraderプラットフォーム用アプリを開発するだけでいいのです。マーケットでプロダクトをパブリッシュして何百万ものMetaTraderユーザーに提供する方法をご覧ください。
取引の機会を逃しています。
- 無料取引アプリ
- 8千を超えるシグナルをコピー
- 金融ニュースで金融マーケットを探索
新規登録
ログイン