YouTubeにあるマーケットチュートリアルビデオをご覧ください
ロボットや指標を購入する
仮想ホスティングで
EAを実行
EAを実行
ロボットや指標を購入前にテストする
マーケットで収入を得る
販売のためにプロダクトをプレゼンテーションする方法
MetaTrader 5のためのエキスパートアドバイザーとインディケータ - 53

RSI Scanner, Multiple Symbols and Timeframes, Graphical User Interface An indicator that scans multiple symbols added from the market watch and timeframes and displays result in a graphical panel. Features: Multi symbol Multi timeframe Alerts and Notifications Live Monitoring Sorting modes One click to change symbol and timeframe Inputs for RSI and scanner settings
FREE

Risk Optimizer is the absolute solution for applying risk management on your account. Bad risk management is the main reason that causes traders to lose money. Risk Optimizer calculates and suggests the correct lot size for each position according to your personal, customized risk profile. You can give directly your preferred risk as percentage (%) for each position or you can trust our algorithms to calculate and optimize according to your risk category selection. But it is not only that! Selec
FREE

The Basket expert advisor can open up to 10 trades at once. It was developed for basket traders who need to open a lot of trades on many different pairs. Expert advisor allows to set a take profit and stop loss as a value in money for each basket trade. This EA is also equipped with hedge functions and allows traders to use the Classic hedge strategy or Sure-Fire strategy, also known as "Always in profit".
Main features Opening multiple trades simultaneously EA Works on any market (forex,

The price is 45 USD for a short time for promotional purposes, the next price will be 300 USD
Fair Value Gap Judge EA uses a special calculation formula between price differences and thus determines whether the parity is above or below the required price. It does not use the MA and RSI system, instead it detects sudden fomo SELLs and BUYs in prices. In this way, it enters trade only when there are HIGH opportunities.
-It is suitable for all FX parities and stock market, but I do not recomm

Nueva entrega en la familia de los Baby EAs: Baby RSI es un EA Experto basado en el indicador RSI. No usa martingala ni grilla, estrategia basada en RSI, Estrategia conservadora. La oscilación relativa del indice del precio o RSI detecta sobrecompras y sobreventas, si estas revierten o hacen Pullback Baby RSI se posicionará a favor de esa corrección de precio, solo si esto ocurre, si no, no. Baby RSI es un Ea muy simple, no necesita mucho más y es una de mis favoritas estrategias automatizadas
FREE

Idea I programmed this tool out of the necessity to be constantly informed about what is going on. Before I sometimes forgot to set a stopp loss, this is impossible with this tool. Further this tool allows you to make distributed entries, eg. with a first feeler with 0.1 contracts and when the direction is the right one you just put more contacts into the game. Money- and risk management is built in. If you use more then the predetermined number of contracts there is a warning. You are constantl
FREE

FFx Patterns Alerter gives trade suggestions with Entry, Target 1, Target 2 and StopLoss .... for any of the selected patterns (PinBar, Engulfing, InsideBar, OutsideBar) Below are the different options available: Multiple instances can be applied on the same chart to monitor different patterns Entry suggestion - pips to be added over the break for the entry 3 different options to calculate the SL - by pips, by ATR multiplier or at the pattern High/Low 3 different options to calculate the 2 TPs -

Percentile of Historical Volatility and Correlation Coefficient shows if the asset is cheap or expensive based on the volatility. It is used to determine a good entry point. It has two indicators built in: Historical Volatility is ranked percentile wise and its correlation to price action which gives an indication of the direction of a possible future move. Together the both indicators can give good entries and direction. Historical Volatility is a statistical measure of the dispersion of retu

Elevate your trading to new heights with Boom and CrashX, the advanced Expert Advisor (EA) designed with precision to enhance your trading experience. This EA leverages powerful indicators to provide accurate signals, streamline risk management, and boost profitability, ensuring a smooth operation in the ever-changing financial markets. Boom and CrashX is the perfect ally for both experienced traders looking to improve their strategies and newcomers embarking on their trading journey.
Enhanced

This product is converted form Trading View of Kivanc Ozbilgic to be used on MT5 and below are descriptions of developer on Trading View:
Anıl Özekşi's latest development on his precious OTT - Optimized Trend Tracker:
In this version, there are two lines of OTT which are derived from HIGHEST price values (HOTT) and LOVEST price values (LOTT) which were originally sourced to CLOSE values on default OTT.
Another significant difference is there is no Support Line (Moving Average) in this ver

BestPointOfInitiation是一个很好的短线交易指示器,能与 ShortBS ( https://www.mql5.com/zh/market/product/96796 )完美的配合,可以很好的指出最佳的buy和sell位置,指标不含有未来函数,不会重新绘制,不仅能够应用到自己的手动交易过程中,还能完全可以写入到自己的EA中。(如果你感觉到这个指标能够帮助你进行更准确的交易,请帮忙给个好评,希望我的作品能够帮助更多多有需要的人) ===================参数列表===================== fastPeriod: 9 slowPeriod:30 PassivationCoefficient:5 =================参考使用方法=================== 此指标可以适用于任何交易品种,能够用在任何周期。

Volality Index scalper indicator Meant for Volality pairs such as Volality 10, 25, 50, 75 and 100 The indicator works on all timeframes from the 1 minute to the monthly timeframe the indicator is non repaint the indicator has 3 entry settings 1 color change on zero cross 2 color change on slope change 3 color change on signal line cross Orange line is your sell signal Blue line is your buy signal.

Volality 75 Fractal Scalper Non-repaint The arrows appear on the current candle. momentum and trend based strategy Works on all timeframes from the 1 Minute to the Monthly timeframe Bollinger bands have been added to show the trend direction whether its bullish or bearish Blue fractal arrow is your buy entry Orange fractal arrow is your sell entry you can use the Vix 75 fractal scalper in combination with other indicators.

Эксперт - торговый помощник, созданный по одноимённой торговой стратегии Оракул в сотрудничестве с ее автором Нео. Определяет на графиках в автоматическом режиме разворотные импульсные модели и строит по ним Вилки Нео - авторский инструмент, позволяющий определять циклы движения цены и указывающий на ожидаемую цель TakeProfit . Поиск ведется на всех заданных периодах графиков одновременно с фильтрацией совпадений. Осуществляется фильтрация неверных Вилок с указанием кода ошибки. Утилита имеет

This bot uses two CCI indicators one slow and the other fast. Then there is a moving average to determine the trend (if price is above moving average then its an up trend ). If a signal is to be produced in the opposite direction of the current open trade then it closes and reverses the type of trade. An ATR indicator is used for better stop loss and take profit placement. There is a trailing stop function. This robot can be used in the H1 timeframe , other time frames should work though you wil
FREE
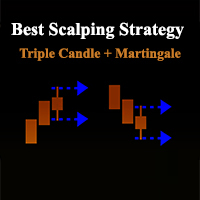
Best MT5 Scalping Strategy 3 Candle Parámetros recomentados H1 lotaje 0.01. Gestión del riesgo profesional Descubre el Robot de Scalping basado en la Estrategia de las 3 Velas. Este robot de trading de Forex ha sido desarrollado por MRBEAST como una herramienta para facilitar el trading intradía. Tenga en cuenta que el uso de este robot implica ciertos riesgos y no garantiza ganancias consistentes en el mercado de divisas. El robot de trading se basa en algoritmos y estrategias que he diseñado,

Lite Hamster Scalping (Very Fast EA no Graphics)
The Lite Hamster Scalper is a Trading Robot with no use of Classic martingale. Schedule scalping Options. it uses some Indicators as a filter to maximize Correct entries.
Please to check The version 1.4 of Hamster Pro : Hamster_PRO_MT4 && Hamster_PRO_MT5 Recommendations : Lot : 0.01. Balance : 100 USD. Pair : EURUSD. TimeFrame : 5Min. Spread : 30. Broker : Trusted Brokers Inputs descriptions : Period Indicator1 - period of the fi
FREE

Introducing the “Symbol Cost Info MT5” indicator – your ultimate tool for staying ahead in the forex market! This innovative indicator is designed to empower traders with real-time cost information, directly on their charts. Here’s why every trader needs the “Symbol Cost Info MT5” in their arsenal: Real-Time Spread Monitoring : Keep a close eye on the spread for any currency pair, ensuring you enter the market at the most cost-effective times. Pip Value at Your Fingertips : Instantly know the v
FREE

Chart Notes = MULTI LINE TEXT INPUT ON CHART FOR MT5 is finally here! # sticky notes This indicator is a powerful text editor for placing notes on chart, similarly like the feature on Tradingview.
There are 2 types of messages: anchored (on screen ) and free (on chart).
1. Anchored = stays on the same place on screen (x point, y point) -this text can be EDITED on click (first line is for dragging the message around- this line is edited via right clicking- >properties) -move the messages by

1. Why did I develop this series of indicators
I found that most traders need to use multiple time frame indicators. They usually switch time frame to see indicators. However, once the timeframe is switched, you cannot see the corresponding relationship between the price in the smaller timeframe and the indicator in the larger timeframe . For example: if your price chart is in H1 timeframe, you can see H4, D1 and W1 indicators in H1 timeframe Chart. This is more helpful for you to find t

Indicator that will show your Balance , and your Equity . Really simple to use, no specific requirements to install it. However you can deeply configure it for your own wishes. The pannel has 4 buttons. Only current will display the information of the chart you linked the indicator. If this is deselected, you will have the information of the whole account. Only Buys will display only the BUY orders and Only Sells will display only the SELL orders. Show Zero will display the 0

The Boy Plunger Gold EA is a revolutionary scalping Expert Advisor (EA) designed for the Gold and Silver markets. This EA does not require a low spread account and offers smart take profit and stop loss levels, without the need for trailing features.
The EA is intended for use and backtesting specifically in 2023.
Main EA setting: Timeframe: The timeframe used for market analysis. It is set to PERIOD_H4, which represents the 4-hour timeframe. ATR_Period: The number of bars used for calcul

Smart Copy is an Easy-to-Use EA that supports Multi Copying Metatrader4 and Metatrader5 and Local/Remote Copying. (Remote Version is coming soon)
This is Free Version and can be used on Demo accounts only. Use the Full Version for real trading.
Specifications :
Real Time, Multi Terminal - Multi Account - MT4/MT5 trade copying Copy from netting to hedge and hedge to netting is supported.
Fast and instant copy
All settings are input visually. Easy modifying symbol
FREE

New candlestick alert, the alert appears according to the timeframe it is placed on. The indicator works on any asset, the alert can be silenced at any time, without the need to remove the indicator from the graph. It's great for those who can't keep an eye on the chart all the time. You can use this tool at work, college or anywhere else. It is also possible to receive signals directly on your cell phone by connecting to the metatrader. Aurélio Machado.
FREE
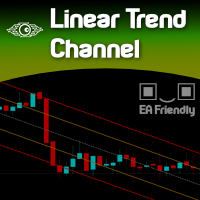
Imagine a way to automatically and clearly recognize the direction of the current market. Uptrend or Downtrend?
Forget about moving averages, there is a simple way to determine that. Welcome to the world of statistics. Welcome to the simple yet powerful world of Linear Regression. Just a complicated name for a genius and simple measurement.
Calibrating this indicator is pretty clear and obvious since the degree of freedom is total and deep.
Once calibrated to your desired Symbol/Asset,

Please, if you like this AE, I would appreciate it if you could rate it with 5 stars ️ ️ ️ ️ ️ THANK YOU!!
Expert advisor based on 3 trend indicators and a signal filter to limit market entries when there are false signals. It is recommended to test and update this signal filter once a year to adapt to changing market conditions. The Expert Advisor includes the following parameters: Magic number: Maximum slippage: Stop loss (pips): Fixed lot or Risk: Filter signal: Info pane
FREE

Non-proprietary study of Joe Dinapoli used for trend analysis. The indicator gives trend signals when the fast line penetrates the slow line. These signals remain intact until another penetration occurs. The signal is confirmed at the close of the period. It is applicable for all timeframes. Parameters Fast EMA: period of the fast moving average. Slow EMA: period of the slow moving average. Signal EMA: period of the signal line. ************************************
FREE

MT5 Version Dashboard: Free scanner to monitor All pairs and timeframes. Please contact me after purchase, i will send it to you! MT4 version indicator: https://www.mql5.com/en/market/product/59127 Tip: This is an indicator for real-time signal display. When the indicator is loaded and running on the chart, the past signal cannot be displayed Market structure changes as price reverses And filter with all import features built inside one tool. Breaker's smart algorithm detects the reverses,

Posh Sessions is indicator which displays sessions in broker time or your local time. You can set up to 5 sessions, assign name, start time, end time and color of each session. There is session's range to help you make a chart analysis.
Settings for a session: Show: To show or not the session on chart Title: The title/name of the session Timezone: Select between broker or local time to implement the session's period Start time: The session start time End time: The session end time C
FREE

This project did not reach the basic funding number, so I am abandoning it momentarily. The system is now free for other traders to continue the idea. You can follow my new project through my signals.
A tool for institutional investor, now avaliable for Home users. We equip you like banks equip their analysts!
How it works
Focused on the Forex market, it takes advantage of the need of nations to control the value of their currency and the world exchange variations to analyze, through the
FREE

The Relative Strenght Index presented to the world in 1978 by J. Welles Wilder Jr. in his book " New Concepts in Technical Trading Systems " is widely used around the world in several ways, not only with the traditional approach of Overbought and Oversold states, which in several cases and depending on the assets and timeframes it just simply doesn't work anymore . BUT, this indicator has its value when used, for instance, looking for divergences between its measuring system and the Prices appea

Modified and updated RSI indicator. Please use arrows on the chart to enter to deals and to exit from deals. The indicator is designed for all currency pairs and time-frames.
Parameters:
PeriodRSI - indicator period;
OpenLevel - level for entering to deals (range diapason 0-100);
CloseLevel - level for exiting from deals (range diapason 0-100);
FlatMode - please enable this trigger in flat mode (i.e. if there are no determined trends).
FREE

The Volume indicator is an excellent tool for measuring tick volume or real volume activity. It quickly and easily helps traders evaluate the volume's current size. The indicator for classification of the volume size uses the moving average and its multiples. Accordingly, the area where the volume is located (relative to the moving average) is labeled as ultra-low, low, average, high, very high, or ultra-high. This indicator can calculate the moving average by four methods: SMA - Simple Moving
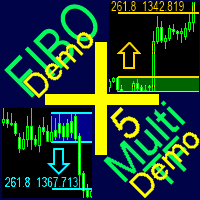
A ready-made multitimeframe trading system based on automatic plotting and tracking of Fibonacci levels for buying and selling any symbol. Demo version - calculation of the last 390 bars is not performed.
Advantages Determines the trend direction based on a complex of 14 indicators ( Cx ), extremums of ZigZag ( Z ), RSI ( R ), Impulse ( I ) Displaying the values of 14 indicators comprising the trend direction ( Cx ) Plotting horizontal levels, support and resistance lines, channels View the pl
FREE
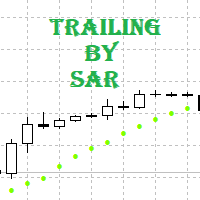
Tracking positions using trailing on the Parabolic SAR indicator. It is necessary to allow automated trading in the terminal settings. In testing mode, the utility opens Buy or Sell positions on the first ticks, which allows you to visually observe the given logic, changing the utility parameters. In real mode, the utility does not open positions. Parameters magic - magic number. If less than 0, positions with any magic number are tracked. only_this_symbol - only chart symbol. If false , posi
FREE

Trading strategy: Scalping. Trading on impulses in automatic trading has been used for a long time and the scheme is not new to traders. It is difficult to catch such moments manually, but the adviser copes instantly. Automated trading uses 2 approaches to trade in such cases: look for pullbacks after impulses. trade in the direction of momentum. The search for entry points is done like this: the adviser measures the rate of price change for which this change should occur, if the conditions for

この無料ツールが気に入ったら、5 つ星の評価を残してください。 どうもありがとう :) 「リスク管理アシスタント」エキスパートアドバイザーコレクションは、さまざまな市場状況にわたるリスクを効果的に管理することで取引戦略を強化するように設計された包括的なツールスイートです。 このコレクションは、平均化、スイッチング、ヘッジのエキスパート アドバイザーという 3 つの主要なコンポーネントで構成されており、それぞれがさまざまな取引シナリオに合わせた明確な利点を提供します。
この EA は、市場の標準的なリスク管理戦略を発展させたものです。
https://www.mql5.com/ja/blogs/post/756961
1.「平均化アシスタント」EA: MT4: https://www.mql5.com/ja/market/product/115468 MT5: https://www.mql5.com/ja/market/product/115469 2.「スイッチングアシスタント」EA: MT4: https://www.mql5.com/ja/market/produc
FREE

Background
This product is a practical tool to check the market based on the cycle theory . When you need to use multi cycle charts to analyze a symbol , manually adding charts with different cycles and applying templates is a very large cost. This product can help you quickly add multi cycle charts of one or more symbols, and uniformly apply the same template . After adding, you can drag the charts to the sub screen, which is suitable for multi screen analysis. Usage Method Apply this script t
FREE
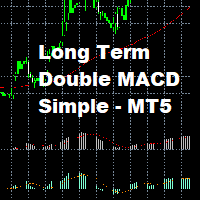
Long Term Double MACD Strategy with EMA Trend Confirmation
This strategy uses a leading and lagging MACD indicator. The leading indicator gives the entry signals, and the lagging indicator gives the exit signals. This Expert does not use any account management and as such you should make sure to set good stop losses.
Works best on longer timeframes on low volatility pairs.
FREE

The new version of MirrorSoftware 2021 has been completely rewriten and optimized.
This version requires to be loaded only on a single chart because it can detect all actions on every symbol and not only the actions of symbol where it is loaded.
Even the graphics and the configuration mode have been completely redesigned. The MirrorSoftware is composed of two components (all components are required to work): MirrorController (free indicator): This component must be loaded into the MAST
FREE

backtester buttons for testing strategies in the MT5 strategy tester.
load up strategy tester then click on visual test and once visual tester opened apply any chart template you'd like. To update the chart pause the visual tester and apply templates, colors and such like the normal chart. On the settings you can choose lot size and take profit and stop loss.
Enjoy
FREE

Introducing our cutting-edge Trade Copier Expert Advisor for MetaTrader 5 (MT5) – the ultimate solution for seamless trade replication across multiple accounts on the same server or computer. Elevate your trading experience and take control of your investment strategy like never before with our professional-grade Trade Copier. Key Features: Effortless Trade Replication: Our Trade Copier effortlessly duplicates trades from a master account to multiple slave accounts, ensuring that you never miss
FREE

For those traders who really care about Volume as an important vector information on Price Action, here is an exclusive idea & creation from Minions Labs: Volume Speed . The Volume Speed indicator shows you visually how much time (in seconds, minutes, hours, you choose) the Volume took to reach the Average Volume of the past bars. This way you can have the exact idea of "what is happening right now with the Volume of the current bar..." and take action accordingly with your strategy, having even

The volatility scanner indicator is a tool that helps traders identify and analyze volatility in all the market timeframes for the current chart. This way you can find potentially profitable trades on every timeframe for the current symbol.
What It Does? Scan all timeframes to find a volatility contraction. Color the button yellow if there is a volatility squeeze at that timeframe. Clicking on the button instantly changes timeframe.
How To Use It? Just put it on the chart and click on the y
FREE

Time to Trade Trading timing indicator is based on market volatility through 2 ATR indicators to determine the timing of a transaction. The indicator determines the times when the market has strong volatility in trend. When histogram is greater than 0 (blue) is a strong market, when histogram is less than 0 (yellow) is a weak market. Should only trade within histograms greater than 0. Based on the histogram chart, the first histogram value is greater than 0 and the second histogram appears, this
FREE
Use Day Trading Tracker to keep a record of your earnings across accounts. This indicator will show a dashboard in the Meta Trader chart to show for the profit or loss money in your account. It’s easy to see just how much money you’re making matched betting with the Forex Trading Profit Tracker. Key features: Track your profit over time Check out your stats. Track expected profits against actual profits. Export account history to Excel. MT4 version: https://www.mql5.com/en/market/product/39113
FREE

The GTradeView tool is indicator designed to visualize the position and its information, such as Reward to risk ratio, Risk percent, Profit, Target and stop-loss and recalculate the reward to risk ratio and risk% in real time on the chart. This tool useful in your trading journal. you can take screenshot of your position, entry, target and stop-loss so you have a visual representation of the trade then you can save it in the journal. And you can visualize EA's trade with associated risks and rew

'Circle Rising Point' is an indicator based on the cycle theory. No matter whether your trading cycle is short or long, you can use this indicator to find the rise and fall points of different cycles and different bands. Therefore, the signals displayed to you on charts of different cycles are different, and applicable to left side transactions. This indicator is recommended to be used together with the multi cycle window for analysis. Indicator introduction Applicable products This indicator is
FREE

Transaction Data Analysis Assistant: This is a statistical analysis tool for transaction data, and there are many data charts for analysis and reference. language: Support language selection switch (currently supports Chinese and English active recognition without manual selection) The main window shows: Balance display Total profit and loss display Now the position profit and loss amount is displayed Now the position profit and loss ratio is displayed The total order volume, total lot size, and
FREE

This is an OLD indicator which was rather efficient to be paired with MA Cross, Bollinger Bands, Dochian Channel and many other strategies and this provides you with market change of BEAR and BULL trends. Since there isn't much listed in MT5 Market, I would like to share my very own indicator for your usage. Please feel free to comment or criticize for better and improvement of the indicator listed.
FREE

Helps trader to place order seamlessly Close mulitple position at a time Place SL or TP for multiple position in a click Place hedge order same time with predefined SL and TP Place multi layer pending order in a click Place martingale layer Be informed about SL and TP in currency Get to know time remaining in current candle Get to know current spread View PnL, Balance, Equity on screen
FREE

This indicator shows when user set sessions are active and returns various tools + metrics using the closing price within active sessions as an input. Users have the option to change up to 4 session times.
The indicator will increasingly lack accuracy when the chart timeframe is higher than 1 hour.
Settings
Sessions
Enable Session: Allows to enable or disable all associated elements with a specific user set session.
Session Time: Opening and closing times of the user set session
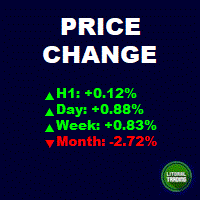
This is an informant indicator, very simple. It shows how much the price has chanded in percentage in certain period (month, week, day and actual period). It is discreet and small, does not visually posslute the chart. If your MT is not on portuguese idiom the indicator will automatically change to english. Check out our most complete tool for the market, the Trade Panel: https://www.mql5.com/en/market/product/42658 If you have any suggestion or find any bug, please, contact us. Enjoy!
This i
FREE

Media Band é um indicador que projeta 8 bandas paralelas a uma media movel de referencia. Podendo auxiliar na visualização da volatilidade do mercado financeiro. Este indicador foi inspirado na necessidade de avaliar melhor uma boa oportunidade de compra e venda dos ativos de acordo com o "seu" operacional. Não pode ser utilizado como recomendação e sim a fins de estudos do Mercado Financeiro.
FREE

Account Info EA It is a tool that presents on the graph all the positions of the account, and specific information concerning the positions, but also the account. It enables the user to have an image of his account at a glance. Use like any expert advisor. You can't attach it in the same chart with other expert advisor. It does not have the ability to open or manage positions. You can attach it on any chart and any timeframe.
FREE

*Display all text information you need on your charts.*
This will help you on displaying text on the chart, to note everything , for example: strategy.
* BUY SIGNAL
- rule 1 - rule 2 - rule 3 - etc * SELL SIGNAL
- rule 1 - rule 2 - rule 3 - etc
This will remind you to follow the discipline and trading strategy set by you.
The Discipline to Follow Rules is the Mark of a Top Trader
Safety first, then profit will come.
FREE

The Indicator indicator draws 2 clouds based on Keltner indicator values. The upper cloud is formed by the upper lines values and the lower cloud by the lowers lines values. The indicator allows to change the Keltner parameters and the clouds colors the period of the base line and the deviations of each Keltner instance. The indicator holds 5 buffer index as follow: [0] - Outer values of the upper cloud [1] - Inner values of the upper cloud [2] - Base/Center line values [3] - Inner values of
FREE

Indicator for "screenshoting" the chart at a specified interval. The files are saved in the " MQL5\Files\ScreenShots\Symbol TF\ " directory and named as the date and time the screenshot was taken ( 2017.06.20 23.56.24.png ) Settings: Width and Height — width and height of the saved screenshots, IntervalSeconds — the saving interval in seconds. Attention ! If you set a large size for screenshots and a high frequency, you may run out of space on the hard drive. Do not delete the folder where the s
FREE

Tired of adjusting the indicator settings losing precious time? Tired of the uncertainty regarding their efficiency? Afraid of the uncertainty in their profitability? Then the indicator ACI (automatically calibrateable indicator) is designed exactly for you. Launching it, you can easily solve these three issues just performing the simplest action: clicking a single Calibrate button. To achieve the highest efficiency, you should perform another additional action: move the power slider to the maxi
FREE
This is a simple indicator that shows the spread in points. It is useful for those like trade scalper, in addition to be customizable.
Functions:
Color - I don't need to explain :) Font type - I don't need to explain :) Font size - I don't need to explain :) First text - text in front of spread number Second text - aditional text after the spread number. Corner - specify the corner where the spread will be written. Horizontal distance - horizontal distance from the edge. Vertical distance -
FREE

Fibonacci and RSI.
Demo versión only works with GBPUSD. For full version, please, visit visit https://www.mql5.com/en/market/product/52101
The indicator is a combination of the Fibonacci and RSI indicators.
Every time the price touches one of the fibonacci levels and the rsi condition is met, an audible alert and a text alert are generated.
Parameters number_of_candles : It is the number of candles that will be calculated. If you put 100, the indicator will give you the maximum and min
FREE

This is the Full Version, to get the free version please contact me.
The free version works on “AUDNZD” and “XAUUSD” charts.
All symbols and time frames scanner
Head and Shoulder
One of the most popular Price Action patterns is the Head and Shoulders pattern. The pattern has three local tops that resemble the left shoulder, head, and right shoulder. The head and shoulders chart pattern appears in all kinds of markets, including Forex, cryptocurrency, commodities, stocks, and bonds. The

Forex Indicator Arrows is an arrow Indicator used as an assistant tool for your trading strategy. The indicator analyzes the standard deviation of bar close for a given period and generates a buy or sell signals if the deviation increases. It good to combo with Martingale EA to follow Trend and Sellect Buy Only/Sell Only for EA work Semi-Automatic. You can use this Indicator with any EAs in my Products.
FREE

To get access to MT4 version please click here . This is the exact conversion from TradingView: "Candle body size" by "Syamay". This is a light-load processing indicator. This is a non-repaint indicator. Buffers are available for processing in EAs. All input fields are available. You can message in private chat for further changes you need. Thanks for downloading
FREE

This is the Full Version, to get the free version please contact me. The free version works on “GBPCHF” charts. All symbols and time frames scanner. Harmonic Pattern
Harmonic patterns are used in technical analysis that traders use to find trend reversals. They are considered one of the most accurate technical analysis tools, as they allow traders to predict the future price movement direction and the potential trend targets. Also, unlike many other technical tools, the number of false signal

Demo version of the Virtual SL TP Trailing product for testing all functions https://www.mql5.com/ru/market/product/75210
ВНИМАНИЕ: ТОЛЬКО ДЛЯ ДЕМО-СЧЕТОВ !!!
Make Trailing Stop, Take Profit, Breakeven, Stop Loss levels invisible to the broker!
HIDDEN MODE (STEALTH MODE) Virtual Trailing Stop (Virtual Trailing Stop) Virtual Take Profit (Virtual Take Profit) Virtual Breakeven (Virtual Breakeven) Virtual Stop Loss (Virtual Stop Loss) Виртуальный 2-уровневый Трейлинг-стоп Virtual
FREE

The indicator is intended for recognition and marking 1-2-3 buy and sell patterns on a chart. The indicator will help a trade to determine the starting and signal fractals, and to specify the possible entry points on all timeframes in МetaTrader 5. Fibonacci lines are drawn on the chart to indicate supposed targets of moving on the basis of the wave theory. The 1-2-3 formations appear to be especially important as divergences (convergences) are formed on price tops and bottoms. The indicator has

This tool is designed to measure the distance between two points on a chart and much more.
List of measured values:
Distance in points Profit (with and without spread) Time difference Percentage price change Slope angle Number of bars (various variations) Ratio of distance in points to the reference value Features:
Snap to OHLC prices Automatic color profile setting based on chart background color Various types of pointers to choose from Display of values of selected points o
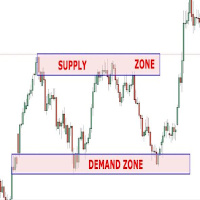
This Expert Advisor can be applied to many markets because It exploits basic supply/demand and price action concepts. It identifies the major rotation zones (PRZ), supply and demand zones and supports and resistances within major price trends. It buys at discount zones and sells at premium prices. It can and should be optimized through the Metatrader tester to find the best parameters to use for current market conditions. This is not a fixed strategy rather a full trading algo that will find whi

The indicator is getting the four most important trading sessions: New York London Sydney
Tokyo The indicator auto calculate the GMT time. The indicator has buffers that can be used to get the current session and the GMT.
You can use it as stand alone indicator and you can turn the draw off and call it from your EA. INPUTS Max Day: Max days back to get/draw. London Session On: Show/Hide London Session. New York Session On: Show/Hide New York Session. Sydney Session On: Show/Hide Sydney Sessi
FREE
MetaTraderマーケットは、他に類のない自動売買ロボットやテクニカル指標の販売場所です。
MQL5.community ユーザーメモを読んで、取引シグナルのコピー、フリーランサーによるカスタムアプリの開発、支払いシステムを経由した自動支払い、MQL5Cloud Networkなど、当社がトレーダーに対して提供するユニークなサービスについて詳しくご覧ください。
取引の機会を逃しています。
- 無料取引アプリ
- 8千を超えるシグナルをコピー
- 金融ニュースで金融マーケットを探索
新規登録
ログイン