YouTubeにあるマーケットチュートリアルビデオをご覧ください
ロボットや指標を購入する
仮想ホスティングで
EAを実行
EAを実行
ロボットや指標を購入前にテストする
マーケットで収入を得る
販売のためにプロダクトをプレゼンテーションする方法
MetaTrader 5のためのエキスパートアドバイザーとインディケータ - 42

The Cipher Hybrid-HFT Gold Trader: The Power of Probability Theory and Price Action Principles
The vast majority of technical indicators are the same age as dinosaurs. Also, many retail traders are not aware of this fact: most technical indicators are developed for the stock market - not for the forex and not for the metals market. The apparent fact that you can not achieve consistent success in the metal market with old technical indicator theories and with the tools developed for stock market

Ultimate Grid Trader - The Ultimate Gold Trading EA The Ultimate Grid Trader is a powerful, fully automated Expert Advisor (EA) designed to trade XAUUSD (Gold) using a smart combination of RSI, Bollinger Bands, Stochastic, and ATR indicators . This EA follows a grid trading strategy , allowing traders to maximize profits by dynamically reinforcing positions while maintaining effective risk management. How It Works: Utilizes multiple RSI indicators across different timeframes to confirm trend dir
FREE

The ABC Indicator analyzes the market through waves, impulses, and trends, helping identify key reversal and trend-change points. It automatically detects waves A, B, and C, along with stop-loss and take-profit levels. A reliable tool to enhance the accuracy and efficiency of your trading. This product is also available for MetaTrader 4 => https://www.mql5.com/en/market/product/128179 Key Features of the Indicator:
1. Wave and Trend Identification: - Automatic detection of waves based on mov

Colors generated according to trading volume and market direction.
The analysis is carried out following the direction of the price and volume traded if the traded value exceeds the calculation base the system changes the color to green, informing you that the price direction is strong to buy, if the traded value is less than the calculation base the system changes to red, indicating that the price is strong for sale.
FREE

Promotional offer for today 50 USD, Next price will be 99 USD. Final price will be 999 USD. Set Files for Ihsan Plus MT5 Please just change Risk Level (1-100) No need other field change. and Risk Level 2 = 2% risk for 1000 USD or above. It's only good works on GBPUSD Daily Timeframe. This robot is profitable. This robot requires minimum deposit of $100. You can get good results with it. You can test it first . It will increase the volume in a certain ratio as the equity increases. You don't

Gmail to MT5 is a tool that automates the process of transferring trading signals from your Gmail inbox directly to your MetaTrader 5 trading platform. It's a bridge that connects these two platforms, allowing you to receive and execute trades based on information sent via email. No DLL, no .exe, and no external software
Can receive TradingView signals Would you like more features? We'd be glad to implement them based on your needs How to set up: Create an app password at https://myaccount.googl

Wura 2.set file in comment TimeFrame: M15 Wura , a fully automated Expert Advisor (EA) designed for trading Gold (XAUUSD) on the M15 timeframe. Named after the Yoruba word for "Gold, " this EA is meticulously crafted to capitalize on the precious metal's market dynamics. Key Features: High Win Rate: Wura boasts a remarkable win rate of over 80% for both buy and sell trades, demonstrating its consistent profitability. Minimal Drawdown: Since December 25, 2023, Wura has maintained a drawdown of l

Flux EA is a fully automatic trading advisor which contains several trading systems mainly based on Stochastic, Moving Averages, Standard Deviation, Momentum, Envelopes, Bollinger Bands, Awesome Oscillator, Accelerator Oscillator, CCI, ATR, ADX, OSMA, MACD, RSI, WPR, Bulls Power, Bears Power, Support Resistance, and Candlestick Formations. Each trading system has it own entry with fixed stop loss and take profit. This forex robot can be used for all pairs and all time frames, but it is

Stargogs Spike Catcher V3.12 This Indicator is Developed To milk the BOOM and CRASH indices . Send me Message if you need any help with the indicator. CHECK OUT THE STARGOGS SPIKE CATCHER EA/ROBOT V3: CLICK HERE ALSO CHECK OUT SECOND TO NONEFX SPIKE CATCHER: CLICK HERE STARGOGS SPIKE CATCHER V3.12 WHATS NEW! Brand New Strategy. This is the Indicator you need for 2023. The Indicator Gives you an Entry at a time when conditions are met enter on every arrow and exit when it gives an X. New Tren

TickAll - Automated Trading Robot "Please test it in the EURUSD 15-minute timeframe" Introduction: TickAll is an automated trading robot designed to assist both novice traders and professional traders in the Forex market. Utilizing advanced algorithms and up-to-date market analysis, TickAll helps you make the best trading decisions.
Our trading robot stands out from the rest due to its unique feature - the ability to sometimes incur losses yet ultimately generate profits. Unlike
FREE

Советник для скальпирования фьючерса BR на ММВБ. Внутридневный, в 23=45 закроет позицию. Работает на 15-ти минутках. По появлению отфильтрованного индикаторами сигнала на покупку/продажу выставляет отложенный ордер. Более короткий вариант таймфрейма выбирать не рекомендую из-за введенных ограничений для переменных в примененных индикаторов. Мартингейл не применён, EA тестирован на ММВБ на срочном рынке и только на фьючерсах BR. Для демонстрации результатов на склейке, параметры дооптимизир
FREE

Volume Weighted Average Price (VWAP) is a trading benchmark commonly used by Big Players that gives the average price a Symbol has traded throughout the day. It is based on both Volume and price. Additionally we put in this indicator the MVWAP (Moving Volume Weighted Average Price). For those who do not know the usage and the importance od this indicator I recommend a great article about this subject at Investopedia ( https://www.investopedia.com/articles/trading/11/trading-with-vwap-mvwap.asp
FREE

Sangkakala Merbabu is a very accurate expert advisor for AUDCAD. This EA is designed with many momentum indicator for entry points.
Please send me inbox after purchase, I will give you Breakout EA for free (promote until 12.12.2024).
Signal Features : MFI Force Index De Marker WPR CCI RSI Stochastic Bollinger Bands
Additional Signal : Moving average PSAR MACD ADX
Recommendations:
Currency pair: AUDCAD Timeframe: M5 Minimum deposit currencies : $500 Account type: Standart, Raw or zero sp
Breakout Momentum is an automated scalper for EURUSD. Its strategy takes advantage of "false breakout", "breakout", and "raids on liquidity" above and below current marketplace prices. It is effective in both raging and trending markets. It shows promising results during backtesting using "every tick based on real tick" mode. it is also proving itself on a real account. Check Live Signal on Live Signal 1 - EURUSD
Where does it work the best? The default parameters are optimized to suit the

This indicator shows current major support and resistance, if one exists. And as a support or resistance is broken it shows the new current, if any. To identify support and resistance points it uses the high and low points identified on the current chart. Allows too you to inform the maximum number of bars used to consider a support or resistance point still valid.
FREE
To access the MT4 version of this EA you can contact via private message. Also you can contact for further modifications. strategy description: - Detect underlying trend using the BxTrender indicator in daily time frame. - Trigger entry using supertrend indicator in M15 time frame. - Also use supertrend indicator to set SL and TP accordingly. EA setup - Nasdaq and other indices(like DAX40) are suggested to be traded. - Risk per trade is hard coded to 0.5%. - Risk:Reward ratio is hard coded to 1:
FREE
This universal advisor is based on its own Algorithm, which is an incredibly effective tool due to the simultaneous operation of a trading strategy based on our ChannelSgnals PRT Indicator . The advisor's algorithm is based on a deep understanding of technical analysis and personal experience in exchange trading, has passed the test of time, therefore it guarantees accurate signals and well-thought-out decisions. Traders are also given the opportunity to use their own risk management system with

Prime Algo Gold HFT Coded by Prime Capital Vietnam Best with XAUUSD - High frequency trading
Find your best setting with the backtest before trade with a real account please! With default setting: - Deposit: 10k - Lot trade from 0.01 - Max DD: ~5-10% - Profit: ~1%-3% per month with default setting
Signal: here
Note: - Best with spread max < 30 - Time frame: any - Important: Contact Us before buy ------ ------ ------ ------ ------ ------ ------ ------ ------ ------ ------

"Introducing our cutting-edge Trading Expert Advisor Robot: A culmination of advanced algorithms and meticulous analysis, designed to navigate the dynamic landscape of financial markets with precision and proficiency.
Our Expert Advisor Robot is meticulously crafted to empower traders with unparalleled efficiency and insight. Leveraging sophisticated trading strategies and real-time data analysis, it operates seamlessly across various asset classes, including stocks, forex, commodities, and cr

STRATEGY DETAILS ______________________________________________________________________________________________________________ The strategy is based on multiple well balanced indicators which are optimalized on different market conditions, but this strategy is no miracle there are still periods of stagnation or slightly drops. Trades are open only few times per month usually(5-12 times) and trades are open more days. The strategy is more trend oriented. Indicators used: RSI+Comodity chanel inde

This cluster indicator is MT5 version of SuperIndices for MT4. It allows for processing mixed clusters, where symbols from various markets can be included. For example, it can handle Forex, indices, CFDs, spot at the same time. Number of visible lines increased to 16. An interactive ruler can be enabled to measure signals' strength on the history. The indicator creates a set of embedded cluster indicators (CCFpExtraIndices) with carefully selected periods and combines their results using smart w

Utilise our advanced Trading Robot to hasten your journey to become a funded trader. This Expert Advisor (EA) is your ticket to quicker funding because it is made to pass prop firm challenges in as few as two trading days (if both are profitable). What distinguishes it is as follows:
Optimised for Quick Challenge Completion: Our robot strives to pass evaluations quickly, enabling you to get financed more quickly. It uses a strategy designed to reach the 1:2 profit ratio. Strategic Trading Durin
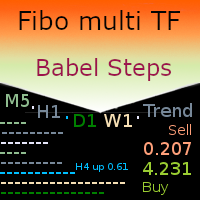
MT5 netting the “Babel Steps” robot uses the ZigZag indicator to generate Fibonacci levels on M1, M5, M15, H1, H4, D1, W1 periods of the charts , calculates the strength of trends for buying and selling. It opens a position when the specified trend level is exceeded plus Bollinger indicators and Stochastic indicators inform about oversold / overbought market. Stochastic and Bollinger indicators help to increase or decrease the position. If market moves into favorable direction the Robot genera

Pips Harvester This expert is the result of hard work and tests for a whole year and an extraordinary study of the most successful models. It is the next generation type that uses a very complex method to open and identify trades. It completely works on only one pair, which is the currency pair of the Australian dollar and the New Zealand dollar. It contains very complex codes that have been prepared. It was formulated and tested for more than a full year, and it is the best expert I have create
Only 1 copies at the price of 99 USD. Last price 999 USD EURUSD ecn - is a trading algorithm designed for trading on ecn accounts or any other accounts with small margins and small spread!
EURUSD ecn trading strategy is based on historical axioms of breaking the daily price range.
Why EURUSD ecn belongs to safe trading systems?! - each order has a short fixed Stop Loss
- the EA will not open an order if the trading account conditions do not match the recommendations (if orders are not opene

Currencies Hunter is a new era of trading the most unique expert for trading currencies use very secretive trading algorithm , took a year to program and test it with a lot of coding ,Currencies Hunter designed to trade on real accounts and provides exceptional results. trade in fully automatic Currencies Hunter use very special algorithm you can make back test with every tick option and see the results by your self this expert use unique strategy to open order and close it Therefore

Indicator USER MANUAL, trade setups, solving issues, etc : Direct Download Here ( for users only ) Hello World! Introducing.. SMCpro tool and Indicator for MetaTrader 5 , a cutting-edge feature designed to revolutionize your trading experience. With innovative ICT Smart Money Concept, you gain unparalleled insight into market dynamics, empowering you to make informed trading decisions like never before. SMC Indicator built on the foundation of advanced algorithms and real-time dat

Description Fully automated robot for trading the EURUSD pair on D1 timeframe. Logic Opening (Entry Signal) Open a new long position or add to an existing position or reduce a short position at Lower Band of Steady Bands* (Weighted, Typical, 60, 437) when the following logic condition is satisfied: the price is higher than the Parabolic SAR (0.24, 1.07, 5.11). Open a new short position or add to an existing position or reduce a long position at Upper Band of Steady Bands* (Weighted, Typical, 60
FREE

Alpine Trader - Tailored Precision for USDCHF Trading Alpine Trader is a specialized Expert Advisor (EA) meticulously crafted to excel in trading the USDCHF pair. Designed with precision and fortified by advanced strategies, this EA integrates machine learning, dynamic hedging mechanisms, adaptive Indicators , and multi-timeframe insights. Leveraging machine learning with cutting-edge algorithms, Alpine Trader captures nuanced market patterns, empowering traders with timely, strategic decisions

Trend Catcher expert adviser, Trend breakout expert adviser, Price action trading, Trend Predictor EA, Trend trading strategies, Trend following indicators, Trend breakout patterns, Trend Follower EA, Trend catcher strategy, Breakout catcher techniques, Price action analysis, Trend following signals, Trend breakout confirmation, Trend Rider EA, Trend catcher system, Breakout catcher indicator, Trend Tracer EA, Price action patterns, Trend trading signals, Trend following methods, Breakout catch

When trading price action or using price action triggers such as Pbars, Inside Bars, Shaved Bars, etc. it is important to always wait for the bar/candle to close more than anything else.It is often the case (whether it’s the 4H, hourly, etc) that price action will be dominant in one direction for the majority of the candle only to reverse strongly at the end of the candle. Institutional traders know retail traders are less disciplined than they are. They know a good trading candle pattern coul
FREE

DESCRIPCION GENERAL * Bot automático * Bot de uso exclusivo de la plataforma binary.com donde se podemos encontrar los Sintéticos * Mercado de Sintéticos recomendado Range Break 200 * Deposito mínimo para el Bot 1 000 USD CONFIGURACION * No cambiar los valores de las Bandas de Bollinguer * En el parámetro TP_of_SL poner 100 * El stop loss es automático *Temporalidad de vela recomendada 1 minuto Como recomendación si quieres usarlo con menos capital se sugiere que cambies el parámetro de mu
FREE

Sidewinder FX for EURUSD H1
Precision, Adaptability, and Performance for EURUSD Traders Sidewinder FX is a cutting-edge trading system built specifically for the EURUSD H1 chart. With its focus on precision, adaptability, and logical trade execution, Sidewinder FX enables traders to confidently navigate the dynamic EURUSD market. Designed with advanced analytics and risk controls, this system empowers you to make smarter trading decisions and achieve consistent results. Key Features 1. Precisio

Midnight Scalper is based on a sound trading principle. It is made to trade during times when the market is at low volatility. From 23:00 to 00:00 is best. It uses multiple indicators for precise entry and exits with a basic fixed stop loss and take profit as part of its money management strategy.It does not put your funds at high risk with such methods as martingale, grid, averaging positions or no stop loss trading. ECN broker is required with a tight spread and low commission. NOTE : After a
FREE

This indicator is used to detect spike movements in Boom and Crash pairs in Deriv company and enter into transactions. The pairs used are Boom300, Boom500, Boom1000, Crash300, Crash500, Crash1000.
When the indicator gives an arrow sign in the expected direction, the transaction is entered and Stop Loss should be placed on the support/resistance areas shown by the indicator.
The indicator does not repaint. It is not used for trend following, but for entering transactions in the direction of th

A countdown timer for the Volume bar chart generator and Tick chart generator products, which are available for download from the MQL5 Market: Tick chart generator: https://www.mql5.com/en/market/product/29215 Volume bar chart generator: https://www.mql5.com/en/market/product/47197
The counter conveniently displays the number of ticks or transactions (depending on the chart) that need to pass for a new bar to start printing.
The user can set the following indicator inputs.
Volume type (Tic
FREE
MACD Lines - Indicador MACD com Visualização em Linhas Descrição Este é um indicador MACD (Moving Average Convergence Divergence) modificado que apresenta uma visualização mais limpa e elegante em comparação com o MACD padrão do MT5. A principal diferença é que ele remove o histograma tradicional e mantém apenas as linhas MACD e Signal, permitindo uma melhor visualização dos cruzamentos e tendências. Características Principais Linha MACD em azul escuro com espessura 2 Linha Signal em vermelho co
FREE

Mean Reversion Jutsuは、ボリンジャーバンドとRSIトレンドの取引のために設計された平均回帰戦略EAです。売り信号は、価格がRSIとボリンジャーバンドの両方を超えたときに発生します。このEAは、ドルコスト平均法から利益を得るためにグリッドベースのアプローチを使用し、時間の経過とともに安定した利益を目指します。各取引の潜在的な損失を制御するために厳格なストップロスとブレイクイーブン措置を組み込んでおり、効果的なリスク管理を確保しています。Mean Reversion Jutsuは、長期的な結果を達成することに焦点を当てた誠実な取引システムです。 Mql5 ユーザーマニュアルとEA設定: このEAの特徴: https://www.mql5.com/en/blogs/post/758686 適切な通貨ペア :XAUUSD ロードタイムフレーム :1分 ドルコスト平均法用にカスタマイズ可能なグリッドを備えたトレンドベースの戦略、マーチンゲールなし 最大ポジション数と最大実現日次損失率を制限することでリスクを管理 小資本口座向け IC Marketsなどの低スプレッド、高流動性
FREE
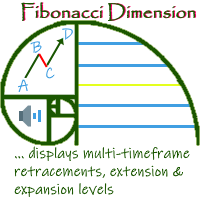
'Fibonacci Dimension' indicator allows display of preset or user-defined multi-timeframe Fibonacci levels. It automatically takes the previous high and low for two user-defined timeframes and calculates their Fibonacci retracement levels. It also considers the retraced level to draw the expansions on every change of price. A complete visual dimension in multiple timeframes allows deriving profitable strategies for execution. Enhanced functionality to view and customize the default Fibonacci Rang
FREE
CAP Stochastic EA Pro MT5 trades using the Stochastic Indicator. It offers many customizable Stochastic trading scenarios and flexible position management settings, plus many useful features like customizable trading sessions, a martingale and inverse martingale mode. [ Installation Guide | Update Guide | Submit Your Problem | All Products ]
Before buy Pro version? You can buy alternation pro version, our powerfull EA, CAP Strategy Builder EA . This is strategy builder EA. It product

Introduction to Harmonic Pattern Scenario Planner
The present state of Forex market can go through many different possible price paths to reach its future destination. Future is dynamic. Therefore, planning your trade with possible future scenario is an important step for your success. To meet such a powerful concept, we introduce the Harmonic Pattern Scenario Planner, the first predictive Harmonic Pattern Tool in the world among its kind.
Main Features Predicting future patterns for scenario

Turnaround Titan : A dynamic MQL5 expert advisor driven by the ebb and flow of inflation and economic growth. Our strategy centers on the cyclical nature of money, drawing it inexorably toward global powerhouses. We exclusively focus on index trading, with a keen eye on prestigious benchmarks like the S&P500, Nasdaq100, US30, UK100 and DE40. Key Features : Stable Performance : Since the 2008 financial crisis, Turnaround Tuesday has consistently delivered stable results. With an impressive win ra
FREE

Three Bar Break is based on one of Linda Bradford Raschke's trading methods that I have noticed is good at spotting potential future price volatility. It looks for when the 1st bar's High is less than the 3rd bar's High as well as the 1st bar's Low to be higher than the 3rd bar's Low. This then predicts the market might breakout to new levels within 2-3 of the next coming bars. It should be used mainly on the daily chart to help spot potential moves in the coming days. Features :
A simple meth
FREE
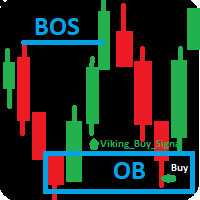
Product Name: Viking Strategy Signal indicator Overview:
The Viking Strategy Signal indicator is designed to give traders an edge in identifying market trends and entry signals with precision and efficiency. Bonus:
One EA gift who can trade automatically this signals ,send the real-time Screenshot for you if Opportunity detected and many things...,additionnnal tools give for free to improve your profitability . what are you waiting for ? download it now and enjoy bonus available only for lif

Description: The Range Breakout Catcher Indicator is a powerful tool known for its non-repainting, non-redrawing, and non-lagging capabilities, making it suitable for both manual and robot trading. This indicator utilizes a smart algorithm to calculate ranges and generate early signals for Buy and Sell positions at the breakout of these ranges, facilitating the capture of trends during ranging consolidations. The range calculation involves a comprehensive system based on various elements, prov

>>> MEGA SALE: 40% OFF! - Promo price: $95 / Regular price $159 <<< - The promotion will end soon!
Forex Trend Hunter is an entirely automated trading system for the MetaTrader 4 trading terminal, developed especially for the needs of ordinary forex traders, yet also used successfully by many professional traders.
Forex Trend Hunter is perhaps the best trend-following and long-term profitable Forex robot on the market. With its help, you can enjoy the opportunity of making several hundred pi

Special summer offer! $100 instead of $250 7 strategies for an EA As indicated by his name this EA trades on several symbols. It uses strategies that have worked well since 2020 on the following symbols: GBPUSD / AUDUSD / EURJPY / CADCHF / GBPNZD / NZDUSD / GBPCHF This EA is based on price action, indicators (moving averages, RSI, MACD and others) and always follows the trend, avoiding market noise. It also performs a complete orders management based on market movements.
No martingale or any ot

Dark Support Resistance is an Indicator for intraday trading. This Indicator is programmed to identify Support and Resistance Lines , providing a high level of accuracy and reliability.
Key benefits
Easily visible lines Only the most important levels will be displayed Automated adjustment for each timeframe and instrument Easy to use even for beginners Never repaints, never backpaints, Not Lag 100% compatible with Expert Advisor development All types of alerts available: Pop-up, Email, Push

Based on Brazilian trader André Moraes' Difusor de Fluxo theory, the indicator is a more reliable version of the original MACD. It is a great confirmation indicator for Swing Trading and also can be used as a Day Trading tool. If you are not familiar with the concept or André's trading strategies, I strongly recommend his excelent book named "Se Afastando da Manada" in which he explains in detail how this indicator is used. Even if you don't know the Portuguese language it is not difficult to un
FREE

This all-in-one indicator displays real-time market structure (internal & swing BOS / CHoCH), order blocks, premium & discount zones, equal highs & lows, and much more...allowing traders to automatically mark up their charts with widely used price action methodologies. Following the release of our Fair Value Gap script, we received numerous requests from our community to release more features in the same category. "Smart Money Concepts" (SMC) is a fairly new yet widely used term amongst price a

CustomRSI50 - レベル50のカスタムRSIインジケーター 説明 CustomRSI50は、人気のある相対力指数(RSI)に基づくカスタム技術指標です。このインジケーターは、多くのトレーダーがモメンタム分析で重要視するレベル50に特に焦点を当て、RSIの明確でカスタマイズ可能な視覚化を提供します。 主な特徴 設定可能なRSI期間 強調表示された50レベルの参照ライン カスタマイズ可能な適用価格タイプ 別ウィンドウでの表示 解釈が容易な0から100までの固定スケール カスタマイズ可能なパラメータ RSI_Period: RSI計算の期間を設定できます(デフォルト:14) applied_price: 計算に使用する価格タイプを選択できます(デフォルト:終値) CustomRSI50の使用方法 MetaTrader 5の任意のチャートにインジケーターを適用します。 RSI期間と価格タイプを好みに応じてカスタマイズします。 50レベルに対するRSIの動きを観察します: 50を上回る値は上昇モメンタムを示します。 50を下回る値は下降モメンタムを示します。 シグナルの解釈と上位サイク
FREE

このインジケーターは、前日、週、月の最高値と最低価格を示します。 極値のブレイクアウトを特定し、取引へのエントリーの方向を決定するように設計されています。 反転レベルをより正確に判断するには、フィボナッチ レベルを表示できます。 また、高値と安値の間のスペースにプロットして、前の請求期間中の価格の動きをより明確に示すこともできます。 現在のローソク足(バー)が閉じるまでの時間を示します。
バージョン 2.0 では、ジグザグ反転信号の 3 つの新しいレベルが追加され、各レベルのアラームが提供されます。 This indicator shows the highest and lowest prices of the previous day, week and month. It is designed to identify extreme breakouts and determine the direction of entry into a trade. To more accurately determine reversal levels, you can view Fi
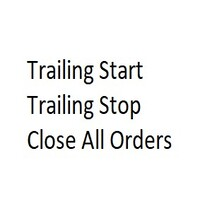
このユーティリティ EA は、希望の利益値に達したとき、またはストップゲインが有効になったときに、買い注文または売り注文を閉じます。手動または他のロボットによってオープンされた注文をクローズします。 急激な価格変動で利益を保護または保証するのに非常に効果的です。 MT5 で利用可能なあらゆる期間およびあらゆる資産で機能します。
トレーリングスタート: たとえば、価格が 70 ピップス有利に動いた場合、ストップゲインが有効になります。 トレーリングストップ: またはトレーリングステップ: 価格がトレーリングスタートよりも上に定義された量だけ動く場合、利益を最大化するためにストップゲインを動かします。
ストップロス: 手動で設定する必要があります。
この製品は常により良いアップデートを受けます。 ご質問がございましたら、チャットで直接質問していただけます。
ご相談や改善提案など承ります。
FREE

ATLogic
ATLogicインジケーター:すべての取引ツールに対応した多機能ツール ATLogicは、すべての通貨ペア、インデックス、暗号通貨を含む幅広い金融商品向けに設計された包括的で使いやすいテクニカル分析ツールです。この多機能インジケーターは、さまざまな市場でトレーダーに強力な洞察を提供します。 購入後にメッセージを残すと、特別なボーナスギフトを受け取れます
「このインジケーターをより効果的に使用する方法を学ぶために、私のAIチューターとつながるにはメッセージを送ってください!」
主な特徴 - ユニバーサル互換性: ATLogicは、外国為替ペア、株式インデックス、暗号通貨を含むすべての取引ツールでシームレスに機能します。 - マルチタイムフレーム分析:このインジケーターは、短期スキャルピングから長期投資まで、さまざまな時間枠での分析をサポートします。 - 直感的なインターフェース:ユーザーフレンドリーなデザインにより、初心者と経験豊富なトレーダーの両方が利用しやすくなっています。 - 高度なアラートシステム:カスタマイズ可能な通知は、デスクトップシステムとモバイルデ
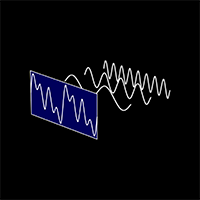
The "Cycle Extraction" indicator for MetaTrader 5 uses the Fast Fourier Transform (FFT) to discern cycles in financial time series. It facilitates the configuration of parameters such as the maximum number of bars, moving average settings, and specification of frequency thresholds, optimizing the analysis of repetitive market phenomena. Instructions Input Settings : Adjust variables such as Bar Count, Period, Method, and Applied to Price to customize the analysis to the user's needs. Data Visual
FREE

A classic buy low & sell high strategy. This Bot is specifically Designed to take advantage of the price movements of US30/Dow Jones on the 1 Hour Chart, as these Indices move based on supply and demand. The interaction between supply and demand in the US30 determines the price of the index. When demand for US30 is high, the price of the US30 will increase. Conversely, when the supply of shares is high and demand is low, the price of t US30 will decrease. Supply and demand analysis is used to i
FREE

Automate your trading with any custom indicator
Would you like to automate your trading using a custom indicator of your choice? This EA trades using almost any custom indicator. It offers fully customizable settings, flexible position management, customizable trading sessions and weekdays, an inverse mode and a martingale mode. All the robot needs from you are two inputs: The filename of the indicator to trade The signal buffer or the buy/sell buffers to call That's it! The signal buffer or th

The SyntheticaFX Zones Indicator simplifies the process of identifying key levels in the market where price reversals are likely to occur. By incorporating this tool into their trading strategies, traders can improve their decision-making, enhance risk management, and ultimately increase their chances of success in the financial markets. However, like all technical indicators, it should be used in conjunction with other analysis methods and not relied upon as the sole basis for trading decisions
FREE
Is Zero Lag profitable? Not always, different system is for different pairs. You can play around with this indicator from Mladen, I have modified it with Bollinger Bands over T3.
You can change the period and how it calculate. MT4 version soon will be released too. Please leave a review , it helps us and we will share more indicators. .... Thank you and happy trading
FREE

OTA A2 - 高度取引ターミナル最適化ツール 重要な市場の瞬間に取引ターミナルが遅くなる原因を考えたことはありますか? OTA A2は、この一般的な課題に対する革新的な解決策であり、取引ターミナルの最適化における画期的な進歩を実現します。 なぜOTA A2なのか? 現代の市場取引には最高のパフォーマンスが不可欠です。複数の戦略を同時に実行する場合でも、 集中的なバックテストを実施する場合でも、多数のチャートを管理する場合でも、1ミリ秒が重要です。 OTA A2は、プロのトレーダーの実際のニーズから生まれ、プレッシャーの下でも一貫したパフォーマンスを維持できるソリューションです。 主要機能 動的メモリ回収 - 取引ニーズに適応するインテリジェントなリソース管理 キャッシュシステムの最適化 - データアクセス速度を向上させる高度なキャッシュアルゴリズム ワーキングセット管理 - 最適なパフォーマンスレベルを維持する高度なメモリ割り当て ターミナルリソースの強化 - ピーク時の取引条件のための包括的なシステム最適化 技術革新 OTA A2は、直接的なシステム統合を通じて最先端の最適化技
FREE

EuroToxin FX – High-Performance Expert Advisor for EURUSD H1 Overview EuroToxin FX is an advanced trading algorithm designed for EURUSD on the H1 timeframe. It is built with a sophisticated risk management system and an optimized trading strategy that ensures consistent profitability and low drawdowns. The backtest results confirm its robustness, showing a smooth equity curve and high trade efficiency. Input Parameters and Strategy Configuration EuroToxin FX is configured with dynamic and fixed

Tillson's T3 moving average was introduced to the world of technical analysis in the article ''A Better Moving Average'', published in the American magazine Technical Analysis of Stock Commodities. Developed by Tim Tillson, analysts and traders of futures markets soon became fascinated with this technique that smoothes the price series while decreasing the lag (lag) typical of trend-following systems.
FREE

This is a free version and is forecasting only 5 bars The FourierExtrapolationMAFree indicator transforms and extrapolates the Moving Average function by the Fast Fourier Transformation method.
1. The transformation period is set by two vertical lines, by default the first blue line and the second pink.
2. By default, the Moving Average (MA) line is drawn in red.
3. By Fourier Transform, the indicator builds a model of N harmonics, which is as close as possible to the MA values. The model is
FREE

Santa Bollinger Indicator is an efficient way to detect price retracement in any market. A common approach is to identify overbought or oversold market conditions. When the price of the asset breaks below the lower band of the Bollinger Bands, prices have perhaps fallen too much and are due to bounce. On the other hand, when price breaks above the upper band, the market is perhaps overbought and due for a pullback . Advantages Generates instant buy and sell signals. Never repaints, never back
FREE

An EA created to overclock a deposit within the short period of time. The EA uses accurate signals towards the trend to be able to enter the market. Together with the author’s optimization criterion, the EA allows you to choose appropriate settings to overclock your deposit. The EA works on 4 timeframes, which increases the accuracy of signals. Sometimes it can involve 3 timeframes. Attention! As you know, a trader's deposit is exposed to a risk in the Forex market. Especially, this should be ta

This is a Forex Scalping Trading Sytem based on the Bollinger Bands. Pairs:Major Time frame: 1M or higher. Spread max:0,0001. Indicators (just suggestion) Bollinger bands (20, 2); ADX (14 period); RSI (7 period ). Y ou should only trade this system between 2am to 5am EST, 8am to 12am EST and 7.30pm to 10pm EST. Do not scalp 30 minutes before a orange or red news report and not for a hour afterwards. Setup: is for price to move above the lower or lower Bollinger Bands, RSI raise above the
FREE

US 30 BOT This is a simple quantitative model that trades US30 Index from NASDAQ top 30 American stocks It uses volatility contraction and expansion as a basic theory. Place it on US30 chart ,any timeframe. Hedged accounts are advised. NB: Standard accounts are preferred and well regulated brokers eg ICMarkets are advised to avoid unnecessary losses eg slippage ones,commissions and large spreads. Minimum account balance ADVISED : USD 100 HOW TO USE: A VPS is highly recommended. AWS offers 1 y
FREE

After purchasing, you can request and receive any two of my products for free!
После покупки вы можете запросить и получить два любых моих продукта бесплатно! Expert Advisor for manual and automatic trading on the trend lines of the indicator Bollinger Bands. The Expert Advisor draws trend lines from the middle band for a specified number of candles. Important!!! - you need to test the adviser in visual mode.
You may be interested in my other products: https://www.mql5.com/ru/users/vypc
FREE

TG Ponto de Cobertura (Coverage Trade)
This Indicator checks your trading results on the day relative to the asset on the chart and adds a line at the price corresponding to the coverage point for the open position, considering the entry price and lot size. The coverage point will be recalculated after new entries, based on the average price of the open operation and the lot size.
If the result for the day is zero, a line will be displayed at the price of the current trade.
If the day's result
FREE

A simple volume indicator according to the color of the candle!
- Custom background!
- Supports Volume by Ticks or Real Volume.
The original Metatrader Volume indicator does not show the colors of the bar according to the color of the Candle, it only changes color when the volume of a candle is greater than the previous one, this sometimes creates confusion for beginners and does not know the real reason for the color change.
Free indicator, support may take a while to respond!
FREE
MetaTraderマーケットは、開発者がトレーディングアプリを販売するシンプルで便利なサイトです。
プロダクトを投稿するのをお手伝いし、マーケットのためにプロダクト記載を準備する方法を説明します。マーケットのすべてのアプリは暗号化によって守られ、購入者のコンピュータでしか動作しません。違法なコピーは不可能です。
取引の機会を逃しています。
- 無料取引アプリ
- 8千を超えるシグナルをコピー
- 金融ニュースで金融マーケットを探索
新規登録
ログイン