YouTubeにあるマーケットチュートリアルビデオをご覧ください
ロボットや指標を購入する
仮想ホスティングで
EAを実行
EAを実行
ロボットや指標を購入前にテストする
マーケットで収入を得る
販売のためにプロダクトをプレゼンテーションする方法
MetaTrader 5のためのエキスパートアドバイザーとインディケータ - 55
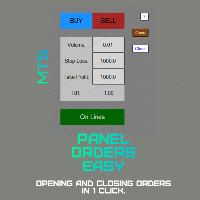
This utility (as an advisor) allows you to open and close positions in a couple of clicks. Panel Orders Easy is a Lite version of the Panel Orders program. Opening and closing positions in it is not available. You can see the full version among my other products.
The control panel , in the form of graphical objects, allows you to manage orders without the help of third-party programs.
Program Features: 1. There is a lot selection option. Either the usual fixed or a percentage of the depos
FREE

ADX_Expert is structured based on a specific technical analysis indicator ( Average Directional Movement ). It has many parameters so that each user can find the appropriate settings that suit their investment profile. It can work on 28 different pairs, one pair per chart. The default parameter settings are indicative, I recommend that each user experiment to find their own settings.
FREE

For those Price Action traders who love to trade strong Price points, like today's Opening Price (or even yesterday's Price), here is an indicator to ease the identification of those values, drawn directly on your chart! Opening Price will automatically draw a line showing you this point for you, AND, if you like any OPENing price in the past, not just today's price. A must-have in your Price Action toolbox!
SETTINGS
How many past days do you want to be drawn? Do you want to draw the current da
FREE

40% off. Original price: $50
Ichimoku Trend Finder is a multi symbol multi timeframe trend dashboard that helps traders to monitor and identify potential market trends from one chart. This panel scans the Ichimoku Kinko Hyo indicator in 28 configurable instruments and 9 timeframes for classic Ichimoku trend signals with a deep scan feature to scan all market watch symbols (up to 1000 instruments!).
Download Demo here (Scans only M1 and M6) Settings description here MT4 version here

>>> EW製品セレクションプロモーションの一環として、無料のEAをお楽しみください! <<< このEAは Turnaround Tuesday 戦略を実装しています。これは、市場が火曜日に方向転換する傾向を利用する、実績のあるアプローチです。Edgellenceフレームワーク内で構築され、以下を含みます: 自動ロットサイズ設定 資金管理およびリスク管理機能 損益分岐点設定とトレーリングストップ 日次および総収益追跡 ForexFactoryとの統合 多言語対応
この戦略は、株式および指数の取引に最適です。 この戦略の簡単な説明 Turnaround Tuesday 戦略は、週の初めにトレンドが形成された後、市場が火曜日に方向転換するという歴史的観察に基づいています。このEAは、これらの転換の機会を特定し、それに応じて取引を行います。 正確性と効率を向上させるため、このEAには以下が含まれます: MAフィルター: 開始価格が移動平均線より下の場合にのみ買い注文をトリガーし、上昇への転換を予測します。 設定はカスタマイズ可能で、トレーダーが最適な結果を得るためにフィルターを調整でき
FREE

Este EA No funciona para Fundednext
Por el momento, tenemos que hacer las pruebas de lugar
--------------------- Nota 1 --------------------- Si tiene alguna duda. Telegram. @arisonzorrilla t.me/arisonzorrilla --------------------- Nota 2 ------------------- Solo Recomiendo US30.
--------------------- Nota 3 ------------------- RECOMENDADO Para la version DEMO y LIVE Por favor poner los parámetros que aparecen más abajo. ------------------------------------------------------
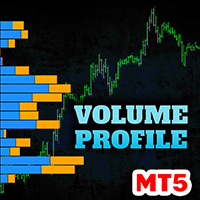
Contact me after payment to send you the user manual PDF file. Download the MT4 version here. Volume Profile Indicator A functional and useful tool that can improve your trading plan.
This indicator calculates volume in price levels(typical volume indicator shows only candle volumes).
With the volume of price levels, you can identify important areas that have the potential to reverse. You can also see the volume of support and resistance levels and decide on them.
Using volume profiles along
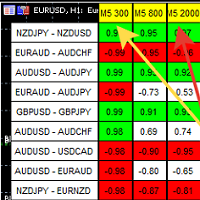
A script showing the correlation for three selected zones at once (TF-bar) In the parameters, select 3 options The data is displayed sorted by the first zone The script also creates a file in which it writes all the data without sorting. In this way, you can expand the number of zones to any number and perform the analysis in exsel
Parameters:
TF_Trade1 =PERIOD_M5; BarsCor1 = 300; TF_Trade2 =PERIOD_M5; BarsCor2 = 800; TF_Trade3 =PERIOD_M5; BarsCor3 = 2000; K = 0.8; WindSize
FREE

The Buffer Reader will help you to check and export the custom indicators buffers data for your current chart and timeframe. You can select the number of buffer and historical bars to read/export. The data can be exported in a CSV format and the files will be stored in the folder: \MQL5\Files .
How it works Put the number of buffers to read in the Buffers_Total input parameter. Put the number of rows to display in the Rows_Total. Choose the CSV separator in the parameter. Copy the correct nam
FREE

Maximum Minimum Candle indicator is a basic indicator (but useful) that shows the highest and lowest candle in a period of time .
The indicator shows the maximum candle and the minimum candle for a defined period of time. You can choose the number of candles that make up the period The indicator will show with color points the maximum and minimum values. A message tells you when the price reaches the maximum or minimum.
Parameters number_of_candles: It is the number of candles that will be c
FREE

If you need an indicator that shows market entry points, then this is your indicator.
The indicator is not redrawn. Shows buy and sell points for any TF (time frame) and any currency pair. Settings are adjustable for all instruments. You can configure each parameter for any broker, for any account.
This is a PILLOW that is comfortable :)) Just check it out.....
Grid Trading is a fully automated trading system that doesn't require any special skills from you. Just fire up this EA and rest. You don't need to set up anything, EA will do everything for you. EA is adapted to work on big deposit over $5000 for good work.
Timeframe: 1 Min
Currency pairs: EURUSD PROFITABILITY AND RISK The expected estimated profitability according to the backtest data is about 200% - 400% per year. The expected maximum drawdown is about 90% or more . Attention!!! This is
FREE

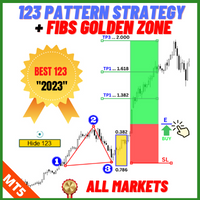
I recommend you to read the product's blog (manual) from start to end so that it is clear from the beginning what the indicactor offers. This multi time frame and multi symbol indicator identifies double or triple top/bottom formations or a following neckline breakout (confirmed top/bottom). It offers RSI, pin bar, engulfing, tweezer, morning/evening star filters as well divergence filter options which makes it possible to filter out only the strongest setups. The indicator can also be used
Get FREE Advanced Online Course and Learn About Our Advanced Trading System, Link in the Bio! Click Here. Our Mission and Vision: Why Am I Even Here? Here is The Deal Brother, We Offer:Premium Quality Indicators: The Highest Quality Possible Algorithms. Unlimited Activations: Can be used on Unlimited number of Computers, MT4s and MT5s for lifetime. Inexpensive Prices: 30$ is the lowest price possible, Knowing that more than 50% of our Indicators are 100% FREE.
But Why Am I telling You this?

Trend View is a simple indicator that shows in a text the trend of the current currency in the timeframe you choose. Inputs are: Color: color of the text. Timeframe: timeframe for calculations. Trend can be: UP: bullish trend. DOWN: bearish trend. ---: trend not defined. You can use this indicator to show the main trend of a bigger timeframe helping you to choose your trades. Note: text is draggable.
FREE

Pairs Navigator is a simple and easy-to-use tool that allows you to view all of your charts in a single window. This eliminates the need to open multiple charts from the Market Watch window, saving you time and effort. Pairs Navigator is also very lightweight, so it will not put a strain on your RAM or cause your MT4/5 platform to hang. To use Pairs Navigator, simply drag and drop the currency pairs you want to view into the Pairs Navigator window. You can then easily switch between charts by
FREE
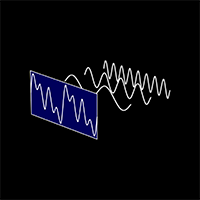
The "Cycle Extraction" indicator for MetaTrader 5 uses the Fast Fourier Transform (FFT) to discern cycles in financial time series. It facilitates the configuration of parameters such as the maximum number of bars, moving average settings, and specification of frequency thresholds, optimizing the analysis of repetitive market phenomena. Instructions Input Settings : Adjust variables such as Bar Count, Period, Method, and Applied to Price to customize the analysis to the user's needs. Data Visual
FREE

テストの前に毎月または年に最適化し、最良の入力を得るために使用する
HFT Gold Scalper は XAU/USD を取引し、可能な限り高頻度の取引を行っています。 テスト中は2022年に11か月で6400件の取引を実行したため、活発に取引されています。 最大の要望と苦情は、EA が人々のためにそれほど頻繁に取引をしないということです。 多くの人は毎日の結果を見たいと思っていますが、長期的な取引には忍耐力がありません。 このEAはそのトレーダー向けです。 最適化入力は 2022 年 1 月から 11 月までのものです。
これらは最終的な最適化ではないため、独自のリスク プロファイルに合わせて最適化を作成することをお勧めします。 他の資産も最適化して取引できます。 先月に最適化して範囲を見つけ、毎月または 2 週間ごとに最適化することをお勧めします。 ここでの基本は、危険なマーチンゲールや sl を使用しないリスク管理です。
EA のロジックでは、価格平均、OHLC、買値/売値が使用されます。 ATRによる資金管理はストップと利益として使用されます。 プライスアクション取引
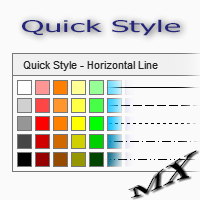
The Quick Style utility is designed for facilitation and acceleration of working with the properties of graphical objects. Left-click a graphical object while holding the Shift key to open the quick access window for configuring the object properties. In the window, you can change the color, style and line width with one click, including those of other graphical objects. All changes are displayed immediately. To close the Quick Style , simply click the free space on the chart. The utility is eas
FREE

Indicator to create and manage your own watchlists. It allows you to load one symbol to multiple charts with just one click.
There is an addon to save objects from drawings (lines, fibos etc.) and load when the symbol is changed.
Functions
Supports Multi-Timeframe-Usage
Load one symbols to multiple charts with just one click
Automatically created list with all tradeable symbols
Custom watchlists can be created
Symbols can be added and deleted from the created watchlists
Sortfunction to sort a

The fractal indicator shows the latest support and resistance levels. If the price breaks through the level and is fixed, the indicator draws a rhombus of yellow or crimson color signaling a possible continuation of the movement towards the breakdown.
Indicator Settings:
- BarCount: sets the minimum number of bars required to build a fractal.
It is better to use the indicator in conjunction with other indicators.
FREE
25 t4w56t41+39t13gsd8+ 15/*3t862q14+rs3 sae,+8bs3,t2-,/4 gad41 wW84141A*+,413+R4,W+2,4WZA+SCX,2C-Q/* ,/43-12QR*,WRSA 3*2Q3+3*,FA5SW6+SR F ,A+,234Q48F1W,+2A3Q /A- 5 FDXZ-3 4W4QRF-+AW,41GT-+4 1W+ RGA 52*T 2 -2W45,2T+, A,1G,+W9 2+ *A2DDF+-T53+ - T 5F+ 255 2 5F+ 8 5WRED S,-+ WW5 R2 5+S 5 2,
D 195 ,W/*A/3,4314*-+ AWF,W+,1348R*AW-43,32R4FA3, -*, W33,4 2F-AW3Q4,+RF,A4 +R2 3 134,+*F W,S4*+DC V,+* 2 3R4F+*A,4FS -+ 32,3T/R43, /-+32, 4+*1 2AFWAQ21, 4T/R AWESE* 2-, 44R2,+4W3F,S +*,54/421 *T,W/5 ,G 25,+*,
FREE

Necessary for traders: tools and indicators Waves automatically calculate indicators, channel trend trading Perfect trend-wave automatic calculation channel calculation , MT4 Perfect trend-wave automatic calculation channel calculation , MT5 Local Trading copying Easy And Fast Copy , MT4 Easy And Fast Copy , MT5 Local Trading copying For DEMO Easy And Fast Copy , MT4 DEMO Easy And Fast Copy , MT5 DEMO Fibo: from KTrade 1. Automatically calculate and analyze the band. -> Get the desired band 2.
FREE

Join Nexus Community Public Chat Stock Index Scalper is a short term scalping EA that trades Stock Indices exclusively. It will close all trades at end of day to avoid overnight risk and only consider opening new trades when there is an active market. Powered by the same AI engine that created Market Cycles Order Flow, Mito Velocity and Nexus Portfolio aka contrarian trading based on retail trader sentiment. It is designed for both scalper trader and long term trader who wants a long term stab

The Draggable Candle Timer is a smooth, minimal, and fully customizable tool that displays the countdown time until the next candle close. It is draggable and can be repositioned anywhere on the chart, so it never gets in the way. Alerts can be easily enabled or disabled directly on the chart by double-clicking the timer—no need to access the input settings. It runs smoothly, without the glitches and delays often encountered in other candle timers. To move the timer: Double-click to select it,
FREE

This EA offers features:
Stoploss (Risk Management), Take Profit (Money Management), Tralingstop and Tralling-Step (after candles), breakeven (strategy), partial sale (strategy), closing the order (strategy), Customizable settings:
1: magic number 2: Commentary 3: Risk, Riskmin and Riskmax 4: total orders 5: SL-(Strategy) 6: TP (true/false points) 7: Initial sale end Breakeven 8: Day positive end trading 9: day range 10: Trailing stop Normal end Intelligent (Candles strategy) 11: Trading Star
FREE

Just a panel for drawing levels. Minimal but very useful thing. This is a reimagining of Color Levels Pro. ---- 4 types of customized levels. support for rectangle and line levels. The indicator parameters are very simple and are divided into blocks. For any update idea please contact me here. ---- Extension version " Levels tool pro " ---- don't suffer don't suffer ---- Enjoy your work!!!!!!!! ----
FREE

手動取引のエキサイティングな世界にどっぷりと浸かり、この先に広がる無限の可能性を発見してください。専門知識と市場感覚を活用すれば、目覚ましい成功を収め、ポートフォリオを継続的に成長させることができます。手動取引では、戦略と意思決定をコントロールし、取引活動に直接影響を与えることができます。市場に関する深い知識とさまざまな取引手段を理解することで、機会を具体的に特定し、収益性の高い取引を完了する機会が得られます。取引が成功するたびに、口座残高が増加するだけでなく、トレーダーとしての自信も高まります。手動取引には規律、忍耐、そして明確な戦略が必要です。市場の変化に素早く反応し、それに応じてポジションを調整できなければなりません。しかし、トレーディングの魅力はまさにそこにあり、そのダイナミクスと、いつでも新しいトレーディングの機会を利用できる可能性にあります。手動取引の世界にどっぷりと浸かり、市場の魅力に酔いしれてください。勇気、決意、そして明確な目標を心に留めておけば、トレーダーとして素晴らしい成果を達成し、成功への道を自分で見つけることができます。チャンスを掴んでトレードマスターになり
FREE

OrcaEAΜΤ5 は完全に自動化されたエキスパートアドバイザーです。その高度な価格アクションベースのアルゴリズムは、次のろうそくの方向を予測しようとし、適切な取引を開始します(または開始しません)。それはそれをすべての市場条件で非常に用途が広いようにするユニークな数の設定を持っています。 OrcaEAΜΤ5 には、2025年に提供されたセットファイルが付属しており、ECN Raw Spread ICMarketsアカウント(ニューヨークベースのGMT + 3タイムゾーンサーバー)用に特別に最適化されています。他のブローカーまたはアカウントタイプを使用することもできますが、 Orca EA MT5 をテストし、ブローカー/アカウントに合わせて必要な時間調整を行う必要がある場合があります。 アドバイス: 私のすべての EA は、市場を予測する奇跡的な製品ではありませんが、失うよりも多くを勝ち取ろうとしている正直でよくコーディングされたエキスパート アドバイザーです。 彼らはマーチンゲール戦略やグリッド戦略を使用しないため、結果は一直線の収益ラインではなく、浮き沈みがあり、成功す

ADR ST Patterns Strategy is a modification of the classical ADR indicator. This simple indicator corresponds to the parameters specified in the ST Patterns Strategy ( https://stpatterns.com/ ) . Structural Target Patterns represents the market consistently divided into components. No trend lines, geometric proportions of the model itself, trading volume, or open market interest are needed for the formation of ST Patterns . They are easily recognized and built only on the basis of breaking
FREE

I’m sharing this EA here for free to support the trading community. I hope it’s helpful, and don’t hesitate to reach out if you have any questions or feedback!
Requirements
Trading pairs all trending Pairs especially USDJPY
Timeframe M1 to H6
Minimum deposit $ 100 Leverage 1:200 Brokers Hedging Pro or ECN Account
Key Features: 1. Risk Management: Triple MA prioritizes the protection of your capital with its sophisticated risk management system. It calculates risk as a percentage of your accou
FREE

If you like this project, leave a 5 star review. Often times we are using brokers that are outside of the GMT-0 timezone, this
not only complicates things, but, it can make seeing when a trading session starts
a bit more difficult than it should. This indicator allows you to set a timezone offset it will draw a vertical line for the: Day. Week. Month. Quarter. year.
FREE
最先端の MQL5 インジケーターである Range BreakOut MT5 でトレーディングの新たな次元を解き放ちましょう
この強力なツールは、確立されたレンジから抜け出す価格変動を特定し、それを利用するように設計されています。
ダイナミックな金融市場の世界で成功するために必要な精度と信頼性を提供します。
MT4 バージョン : WH Range BreakOut MT4
特徴:
正確な範囲検出。 リアルタイムのブレイクアウトシグナル。 カスタマイズ可能なパラメータ。 リスク管理ツール。
当社の製品を選ぶ理由:
精密取引。 時間の節約。 多用途性。 継続的なアップデート。 Range BreakOut で今すぐあなたの取引体験を変革しましょう。
私たちのインジケーターを信頼して金融市場の複雑さを乗り切る成功したトレーダーの仲間入りをしましょう。
トレーディング ゲームをレベルアップして、今すぐ Range BreakOut をダウンロードしてください!
This script will create a report with all history orders in CSV format. The report is useful for those who run multiple EA's with different magic numbers in the same account. You can define some filters to generate your orders history report: 1) Initial date for assets in orders history. 2) Final date for assets in orders history. 3) Asset name. 4) Orders magic number. 5) Add balance/costs.
QUESTIONS ABOUT THE INSTALLATION OF PRODUCTS AT META TRADER You can also find some instructions on how
FREE

Trading the currency markets is a complex business, not least since we are dealing with pairs of currencies, and by inference, pairs of economies. All economies around the world are interlinked, and reflected in the constant ebb and flow of currency strength and weakness. The problem for us as traders is monitoring so many pairs simultaneously, since every pair does not move independently, but reflects the interrelated nature of this market.
The Quantum Currency Heatmap delivers the information

残り 10 部 @ 49.55 次の価格 $65.77
Big Market Traderは、市場で優位に立つための究極のAI取引支援ツールです。最高の技術で設計されており、タイムリーな取引のための高頻度応答率を備えています。
ダイナミックAIオートメーションを搭載しており、これについては後ほど説明します。当社は高度なリスク管理システムを備えています。世界中のトレーダーが使用する株式ストップオプション、トレーリングストップシステム、タイムストップ、スプレッドテクノロジー。プロップファームトレーダー、従来のトレーダー、高資本および低資本取引などに適しています。
あらゆる種類の取引注文を行います。つまり、
買い注文、売り注文、買いストップ注文、売りストップ注文、買い指値注文、売り指値注文です。このAIマシンには、非常に多くの独自の機能があります。また、スキャルパートレーダー、デイトレーダー、スイングトレーダーなど、あらゆるタイプのトレーダーに適合するように設計されています。 Meta Trader 4 version 主な機能:
ダイナミック AI 自動化
高頻度応答率
保留

"Fair Value Gap" (FVG) インジケーター - 市場の不均衡の力を探る トレーディングの世界は隠れたチャンスに満ちていますが、それを効果的に見つけ出し活用できるのは、適切なツールを持っている人だけです。私たちの FVG インジケーター は、そのために設計されています。市場を読む能力を向上させ、最適なエントリーおよびエグジットポイントを見つけたいトレーダーにとって、FVG インジケーターは理想的な味方です。 Fair Value Gap (FVG) とは何ですか? Fair Value Gap の概念は、価格チャートに「ギャップ」を形成する供給と需要の間の不均衡を指します。このギャップは、価格がこの不均衡を埋めるために戻る可能性があるエリアを表し、これらのエリアは取引機会にとって潜在的に価値があるものです。これらのギャップは価格が急激に変動する際に発生し、将来の市場行動を理解するための鍵となり得ます。 なぜ FVG インジケーターが重要なのか? FVG インジケーターは、この不均衡のエリアをチャート上で簡単に特定し、価格がギャップを埋めるために戻る可能性のあるポイントを

Algo Edge EA This EA only SELL download the second EA for BUY and Run it both. -DE40/ Tec100 Self learning EA just set the EA on the Chart and Start no Settings optimization.
AUD/USD, EUR/USD, DE40, US30, Tec100 and much more. Multifunctional Expert Advisor can trade with every Forex Pair or Indize. EA can Trade with every Broker. M1 high, M30 medium, H1 low Risk. Functions: For other Indize example US30: Change the Robot Worktime in Europe to 16:30-21:30.
-inp1_ =Robot Worktime inp_2 and in
FREE

The TradeQL Indicator is a customizable tool that highlights specific trading patterns on candlestick charts. Users can define patterns through TradeQL queries, which the indicator then applies to the chart, visually representing matches and captured groups. Ideal for identifying complex trade setups in real-time.
TradeQL queries are specified using the TradeQL Language. See https://github.com/abdielou/tradeql for more details. This language is expressed as a regular expression. The language al
FREE

Overview Auto TPSL is a sophisticated MetaTrader 5 Expert Advisor designed to revolut ionize how traders manage their risk and protect profits. This powerful tool automatically sets and adjusts Take Profit (TP) and Stop Loss (SL ) levels, eliminating emotional decision-making and ensuring disciplined trading practices. The EA operates through two core systems:
Auto TPSL System The Auto TPSL system automatically calculates and sets appropriate Take Profit and Stop Loss level
FREE

Reward Multiplier is a semi-automatic trade manager based on pyramid trading that opens additional orders with the running profit of your trades to maximize return exponentially without increasing the risk.Unlike other similar EAs, this tool shows potential profit/loss and reward to risk ratio before even entering the first trade! Download full version here ( In the mini version. Starting lot is fixed at 0.01 (or minimum allowed lot size ) Guide + tips here MT4 version here You only open the
FREE

Attempts to recover losing trades.
If a trade moves in the wrong direction, the Zone Recovery algorithm begins.
An alternating series of Buy and Sell trades at two specific levels take place, with two Exit Points above and beyond these levels.
Once either of the two exit points is reached, all trades close with a combined profit or break even.
To use
1) Place the EA on a chart and select how the first trade will open (Manual/Via EA strategy/Use EA panel/External EA)
2) Configure your recovery
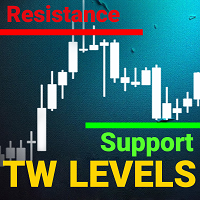
support resistance levels indicator mt5 :
このツールは、チャート上にサポートラインとレジスタンスライン、さらにフィボナッチレベルを同じ精度で識別しプロットするマルチタイムフレームインジケーターです。TWの外国為替サポートとレジスタンスレベルは、複雑なアルゴリズムを使用してチャートをスキャンし、過去の価格安定化および反発レベルを特定し、タッチ数を記録します。
手動でサポートとレジスタンスレベルやフィボナッチリトレースメントを描くのに疲れましたか?
この製品の機能をチェックしてみてください。驚くことでしょう。
製品の特徴:
1. マイナーおよびメジャーレベル:高度なアルゴリズムを使用して、マイナーおよびメジャーレベルを好みに応じてカスタマイズし、追加のレベルを削除できます。
2. レベルタッチ数:TWサポートレジスタンスレベルとブレイクmt5では、各レベルが過去に何回タッチされたかを計算し提供します。これにより、各レベルの強さを評価できます。
3. フィボナッチレベル:最後の波のフィボナッチレベルが動的に描画されるため、これ

The Magic SMMA indicator is of great help in determining trend direction. It can be an excellent addition to your existing strategy or the basis of a new one. We humans can make better decisions when we see better visually. So we designed it to show a different color for rising and falling trends. Everyone can customize this in the way that suits them best. By setting the Trend Period, we can optimize it for longer or shorter trends for our strategy. It is great for all time frames.
IF YOU NEE
FREE

Our Silver Bullet indicator is designed to help you conduct clearer and more effective analysis based on ICT's popular Silver Bullet Strategy. With advanced tools and customizable features, this indicator enhances your ability to identify trading opportunities.
Key Features: Information Panel: Provides key data for your market analysis: DOL (Daily Objective Level): The target price for the session, where you should focus your trading strategy. DOL Price: The target value of the DOL for the sess

Volatility Doctor Basic Editionのご紹介:究極の市場の達人!
真の精密トレードの潜在能力を解き放つ旅に出る準備はできていますか?私たちがVolatility Doctorをご紹介いたします。これは外国為替市場の絶えず進化する世界での信頼のおける仲間です。この非凡な多通貨専門家アドバイザーは、ただのトレードツールにとどまらず、あなたの投資を比類のない精度と洗練さで指揮するバーチュオーゾの指揮者です。
ゲームを変える機能をご紹介します:
1. 無類のトレンド分析:Volatility Doctorは市場の堅牢なトレンドを特定するために実戦済みの方法を採用しています。推測的な当てずっぽうにさようならし、情報に基づいた決断の新時代を迎えましょう。
2. あなたの手に完全なマスタリー:組み込まれた資金管理ツールで、トレード戦略を完全にコントロールしましょう。いつでも開くポジションの数とトレードサイズの増幅度を決定します。それはあなた自身のプレイブックであり、あなたの独自の好みに合わせて調整されています。
3. Volatility Maestro:その名
FREE

I present the well-known Moving Average indicator connected to the ATR indicator.
This indicator is presented as a channel, where the upper and lower lines are equidistant from the main line by the value of the ATR indicator.
The indicator is easy to use. The basic settings of the moving average have been saved, plus the settings for the ATR have been added.
Moving Average Parameters:
MA period Shift MA Method
Moving Average Parameters:
ATR TF - from which timeframe the values are taken A
FREE

GREAR TRADING BOT – это инновационный торговый бот для MetaTrader 5, разработанный для автоматизации стратегий торговли с использованием моделей "Sweep + BOS" и "HTF Sweep + LTF QM". Этот экспертный советник интегрирует расширенные методы анализа рыночных данных, позволяя пользователям выбирать между двумя мощными стратегиями входа. Благодаря гибкости настроек, бот может адаптироваться к различным торговым условиям, проверяя наличие свипов и уровней BOS на различных таймфреймах.
Для стратегии
FREE

The VWAP Level indicator is a technical analysis tool that calculates the weighted average price for the traded volumes of a specific asset. The VWAP provides traders and investors with the average price of an asset over a specific time frame.
It is commonly used by investors to compare data on "passive" trading operations, such as pension funds and mutual funds, but also by traders who want to check if an asset has been bought or sold at a good market price.
To calculate the VWAP level we us
FREE

You can use this tool to create as many pending orders (limit order) as you want in one button press. All inputs must be in points. You can use this useful tool when such as FED speech times. User Inputs:
MagicNumber = Magic number DeviationPoint = Deviation point number for limit orders Level = You can choise how many level do you want to create pending orders. BuyOrder = true/false SellOrder = true/false StartDistance = Distance between each level. StepDistance = Distance to be added increment
FREE

ADX インジケーターは、トレンドとその強さを判断するために使用されます。価格の方向は +DI と -DI の値で示され、ADX 値はトレンドの強さを示します。+DI が -DI より上であれば、市場は上昇傾向にあり、反対であれば下降傾向にあります。ADX が 20 より下であれば、明確な方向性はありません。インジケーターがこのレベルを突破するとすぐに、中程度の強さのトレンドが始まります。40 を超える値は、強いトレンド (下降トレンドまたは上昇トレンド) を示します。
平均方向性指数 (ADX) インジケーターの複数通貨および複数時間枠の変更。パラメータで任意の通貨と時間枠を指定できます。また、インジケーターは、トレンドの強さのレベルが交差したとき、および +DI と -DI のラインが交差したときに通知を送信できます。ピリオドの付いたセルをクリックすると、このシンボルと期間が開きます。これが MTF スキャナーです。
通貨強度メーター (CSM) と同様に、ダッシュボードは、指定された通貨を含むペア、またはその通貨を基本通貨とするペアを自動的に選択できます。インジケーターは、

Breakout MV : This Expert Advisor offers you one of the most fundamental trading strategy, combining Moving Average and Volums indicators!
Key Features : Consistent Performance : Breakout strategy has demonstrated a robust performance across various market conditions, by capitalizing on significant price movements. Strategic Trade Execution : We select the desired range, and once the price approaches these levels and the indicators confirm our entry, we open a trade. The trade will close eit
FREE

EA designed to generate pending orders based on the trend and designated take profit value. This EA designed exclusively to work best on GOLD SPOT M5 especially during up trend. User can freely decide to close the open position from this EA or wait until take profit hit. No parameters need to be set as it already set from the EA itself. This EA do not use Stop Loss due to the applied strategy. Please do fully backtest the EA on the worst condition before use on the real account. Recommended ini
FREE

The EA supports closing orders based on the preset amount. It can close all orders on all pairs, or it can close orders based on Magic ID. Button "Close All" manual Input - Magic Number: Magic Number = 0: Close All pairs Magic Number diffrent 0: Close All with Magic - Money TP: Profitable in money. the EA will close all orders - Money SL: Loss in money. the EA will close all orders Contact: t.me/nguyenvanbo128
FREE

Have you ever wondered which currency is the strongest at any particular time? Or which currency pair is trending the most. Well, the currency strength meter helps with just that. It compares USD , EUR , AUD , CHF , GBP , CAD and NZD depending on the timeline you have chosen in settings, and ranks them on the number of pips each has moved compared to the rest. N/B: All currency charts of the above pairs must have loaded. You can do this by highlighting all major and minor currencies in
FREE

SDivergence Indicator calculates and shows regular divergences and hidden divergences for MACD and Stochastic(for now). The benefit of this indicator is multiple input variables. Using these inputs you can modify to get more adaptive RD and HD's to your strategy. Guide : 1- First put your desired oscillator (MACD or Stochastic or Both) on the chart. 2- Run SDivergence indicator and set corresponding sub-window index of previously put oscillator in SDivergence input window. -Note: the chart sub-w
FREE

Golden Scalper EA は、MetaTrader 5 向けに開発された完全自動取引アドバイザーであり、最小限のリスクで最大の効率を達成することを目的としています。高度なアルゴリズムを使用してローソク足パターンを分析し、移動平均線(MA)を通じてシグナルをフィルタリングします。 Golden Scalper EA は強力な分析機能と柔軟な設定を組み合わせており、初心者から上級者まであらゆるトレーダーにとって欠かせないツールです。 Golden Scalper EA の利点 ローソク足パターンの強力な分析
以下の11種類の人気ローソク足パターンを認識します: Bullish Engulfing(強気の包み足) Bearish Engulfing(弱気の包み足) Hammer(ハンマー) Hanging Man(吊り人) Shooting Star(流れ星) Inverted Hammer(逆ハンマー) Doji(十字線) Morning Star(明けの明星) Evening Star(宵の明星) Piercing Line(差込線) Dark Cloud Cover(陰の

QuantumAlert RSI Navigator is a free indicator available for MT4/MT5 platforms, its work is to provide "alerts" when the market is inside "overbought and oversold" regions in the form of "buy or sell" signals. This indicator comes with many customization options mentioned in the parameter section below, user can customise these parameters as needful. Join our MQL5 group , where we share important news and updates. You are also welcome to join our private channel as well, contact me for the priva
FREE
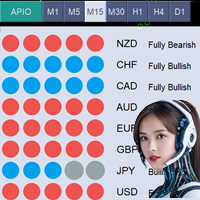
*現在の製品価格は期間限定オファーで49ドルです。 All Power In One の次の価格は99ドルです* オールインワンインジケーター (APIO) オールインワンインジケーター (APIO) は、USD、EUR、GBPなどの主要通貨の強さと弱さを評価するために設計された強力なツールです。選択した時間枠内で異なる通貨ペアの動きと方向を分析することにより、APIOは通貨の強さと取引の機会についてトレーダーに明確な洞察を提供します。 APIOのMT4バージョンはすでに利用可能です。以下のリンクをクリックしてMT4バージョンにアクセスしてください: https://www.mql5.com/en/market/product/129225 このインジケーターで何が達成できますか? リアルタイムの通貨強度: USD、EUR、GBPなどの通貨のリアルタイムの強さを監視します。 購入の最適な機会リスト: 購入に最適な通貨ペアのリストを提供します。 販売の最適な機会リスト: 販売に最適な通貨ペアのリストを提供します。 複数の時間枠へのリアルタイムアクセス: インターフェイスのボタンを使用し
Protect My Trades is an EA (expert advisor bot) that automatically put stop loss and take profit on market trades and pending orders. You can specify if want it to do this only on actual symbol trades or in all others. Its configuration is very simple. Functions: Take profit: distance to TP (0 = disabled, no TP will be created).
Stop loss: distance to SL (0 = disabled, no SL will be created).
Price type: price type in pips or pipets/points (pips is common in Forex).
Actual symbol only: manage th
FREE

HiperCube Tornado is here! Discount code for 20% off at Darwinex Zero: DWZ2328770MGM_20 HiperCube Tornado is a simple but effective indicator that helps you to identify when a new bull or bear power is near. Easy to use Custom Colors Separate windows indicator TEMA is used to do calcs Custom Periods Custom Method Chat GPT and AI used to be developed Strategy Wait to TI+ cross the TI- Thats means ,signal to buy
Wait to TI- cross the TI+ Thats means , signal to sell
Remmenber combines this w
FREE
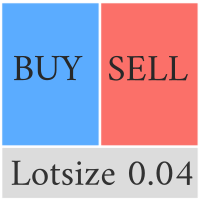
Compliement your normal MT5 Buy/Sell panel with this automatic lot size panel. This product is free without any limitations. There will be a pro verision later with additional functionality, but my motto is to always have awesome free products. It automatically places the stop and sizes the lot according to the given ATR for risk. You have to try it to experience it!
Now I can't trade manually without it.
It's turned out to be much more intuitive than I would think before creating it.
There's
FREE

Introducing our Gold Premia Robot—a cutting-edge, automated system leveraging Bollinger Bands, Ichimoku, and RSI to strategically buy gold on Fridays. Capitalizing on major funds adjusting positions, it minimizes weekend risk for enhanced trading precision and potential returns. Experience market advantage with our innovative algorithm.
– fixed lot to 0.01 – No martingale, no grid – No excessive consumption of CPU resources – timeframe is D1 – User-friendly settings – All settings optimized
Th
FREE

TradeSnapは、BUY/SELLオーダーが約定した際に自動的に画面キャプチャを行い保存します。 チャートにセットするだけで、余計な作業をすることなく、自動で保存されます。
また、チャートに記載された線や矢印なども、そのまま画像に保存されます。 保存できる画像サイズは、10000x10000ピクセルですので、値動き経緯がわかる横長の画像で保存することもできます。
"s"キーで現在のチャートを保存します。
パラメタ設定 --Event Parameter--
Magic number (0=ALL): キャプチャ対象のマジックナンバーを指定します。
Entry: エントリー時にキャプチャします。
Exit: クローズ時にキャプチャします。
--Capture Info--
Image width, Image height: 出力する画像のサイズを指定します。
--Message Info--
Text color, Text size, Text pos, Display seconds: メッセージの表示内容を設定します。
画像の保存先:データフォルダ/MQL5/File
FREE

Positions panel
This is a panel for counting current icon holdings. Convenient traders at any time to view the position and profit and loss situation. Perfect for traders who like to hold multiple orders at the same time. Main functions: Position statistics Total profit Average price calculation TP price calculation ST price calculation Positions valume
FREE
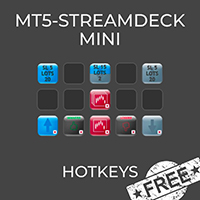
MT5 Streamdeck Mini is a free reduced version of the MT5- Stream Deck Expert advisor
MT5-StreamDeck offers the possibility to use a certain number of pre-programmed Hot-keys with a clearly defined role. So by the push of a button you can open a trade with a pre-defined lot size, stoploss and take profit. Close all your trades, close the ones in profit, or in loss, (set Break-even or set a trailing stop-ONLY IN FULL VERSION) All this with a Hot key button. See the feature list for all the actio
FREE

Mini One for All Trend Scanner is a trend following multi-symbol indicator that can be used with any input: forex, stocks, commodities,... The panel shows three indicators and six symbols with the trend for every pair (symbol/indicator): up, down or no trend. The indicators are: Average Directional Movement Index (ADX) Moving Average Convergence Divergence (MACD) Relative Strength Index (RSI) You can change quickly the chart by clicking any one of the symbol button in the panel. This feature
FREE

Resistance and Support is an easy to use indicator to apply horizontal lines of resistance and support. There are two windows for adding levels. When you press the button, a line appears on the price chart. It is possible to move this line with the mouse, thereby changing the indicator readings. In the indicator menu there is a choice of possible alerts - no alert, alert on touching the level and an alert for closing the candle after the level.
FREE

Hi All ! I want to share with you my favorite indicator to identify strong trend bias. It helps me a lot with my entries and exits. You can use it on any market and any instrument. It works best on daily tiimeframe 1D but you can also use it on 1H and be carefull with lower timeframes This indicator uses MACD, RSI and Stoch. The idea is simple, when MACD crosses above a Signal line and RSI > 50 and Stoch > 50 we consider the trend is going UP on the opposite we consider its DOWN Feel free to us
FREE

O WA Order Block FVG bos MT5 é um indicador com base no estudo de SMC (Smart Money Concepts) criado pelo ICT Inner Circle Trader, eleplota no seu gráfico as informações de Order Blocks em 3 tempos gráficos diferentes, fair Value Gaps e Regiões de Liquidez além do BOS ( Break os Structures), tudo em um só indicador. Dessa forma você não precisa colocar essas informações de forma manual. Agora você tem tudo isso de forma automática em seu gráfico.
MetaTraderマーケットは、履歴データを使ったテストと最適化のための無料のデモ自動売買ロボットをダウンロードできる唯一のストアです。
アプリ概要と他のカスタマーからのレビューをご覧になり、ターミナルにダウンロードし、購入する前に自動売買ロボットをテストしてください。完全に無料でアプリをテストできるのはMetaTraderマーケットだけです。
取引の機会を逃しています。
- 無料取引アプリ
- 8千を超えるシグナルをコピー
- 金融ニュースで金融マーケットを探索
新規登録
ログイン