Robots comerciales e indicadores para MetaTrader 5 - 49

Alligator Window Indicator : Potencialize suas análises no MetaTrader com o Alligator Window. Este indicador coloca o clássico Alligator de Bill Williams em uma janela separada, permitindo uma visualização mais clara e organizada. Ideal para traders que buscam precisão e eficiência em suas operações, o Alligator Window proporciona insights nítidos e facilita a identificação de tendências sem poluir o gráfico principal. Experimente agora e leve suas estratégias de trading a um novo patamar!
FREE

Symbol Manager or Grid Manager, designed to group orders into one position (by Symbol or by Magic Number). This utility will be useful to multi-currency traders (many EAs), who can have multiple orders on several pairs. You will be able to see the total number of lots, the total profit, and set virtual stop loss and virtual take profit. To set a real TP (or SL), you must first set the virtual value, and then enter the command in this cell: "set". If you want to set real TP/SL for all orders at

Volume Above Average Indicator - MQL5 Introduction The Volume Above Average Indicator is a custom indicator for the MetaTrader 5 (MQL5) platform that helps traders identify the current trading volume compared to the historical average. The indicator uses three different sensitivity levels to classify volume into weak, medium, and strong, providing a clear visualization of market momentum. Key Features Displays trading volume in a separate window. Compares the current volume with the historical a
FREE
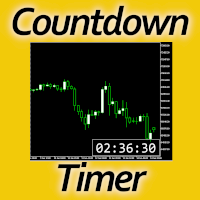
Timing can make the difference between a winning and a losing trade. Therefore, a bar countdown display is a must-have tool for any trader. Knowing exactly how much time is left, before the current bar will close, certainly helps decision-making in real time. Technical detail: This indicator uses the MQL5 function "OnTimer", ensuring the accurate measure of each passing second, rather than relying on the flow of incoming tick information from the server. Most other countdown indicators for MetaT
FREE

Many friends asked me for a simple, non-obtrusive, resource-friendly clock to track the time during their trades. It seems pretty obvious, but it is a must-have for those trading the market manually, waiting for the Market News, or just to visually know what time it is... Trading is an absorbing endeavor! So, here it is... Totally configurable, including Font Type, Font Size and Chart Location: Upper Left/Center/Right OR Lower Left/Center/Right, with a little twist of adjusting the Offset, just
FREE

Удобный трендовый индикатор. Не меняет своих значений. Имеет огромные возможности для настройки. Не требователен к ресурсам компьютера. Создавался для работы в системе BearsHunter. Эксперт МТ5 с использованием данного индикатора: https://www.mql5.com/ru/market/product/30381 Эксперт МТ4 с использованием данного индикатора: https://www.mql5.com/ru/market/product/30383
Параметры:
m1_MA_Mode_1 - метод усреднения(0-9). m1_MA_Mode_2 - метод усреднения(0-9). m1_MA_Mode_3 - метод усреднения(0-9). m1_P
FREE

Smart Range Detector – Advanced Market Structure Indicator Overview The Smart Range Detector is an advanced trading indicator designed to automatically identify key price ranges where market consolidation, accumulation, or distribution occurs. This tool helps traders spot high-probability breakout zones, liquidity areas, and potential trade setups by detecting significant price ranges that the market respects. Unlike traditional range indicators, the Smart Range Detector dynamically adjusts base
FREE

Análisis de deslizamiento diseñado para operaciones de alta precisión y para todo el mercado Funciona tanto en cuentas reales como demo y le permite analizar todas sus posiciones con take profit y stop loss, para que pueda analizar el deslizamiento de su corredor.
¿Qué es el deslizamiento en el comercio? El deslizamiento o deslizamiento es la diferencia de precio que puede ocurrir entre el momento en que se coloca una orden comercial y su ejecución real en el mercado.
Esto se debe a que desde
FREE

El indicador "Time Broker Deriv" está diseñado específicamente para su uso en los índices sintéticos Boom y Crash, así como en otros pares de trading disponibles en la plataforma MT5. Su función principal es proporcionar la hora del broker en comparación con nuestra hora local. Es importante destacar que el indicador "Time Broker Deriv" solo muestra la hora del broker.
FREE
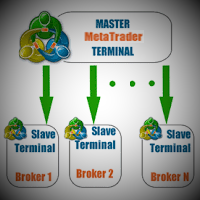
This utility copies trades between multiple MT5 on one computer. It also supports partial closing trades.
Parameters ID - is not required. If you want to use multiple MASTERs on one PC or on one MT5, each MASTER must have a different ID (alphanumeric). Then SLAVE must have the same ID as the MASTER. Mode MASTER - for a provider account; in this mode, the tool transmits trades from the master account. SLAVE - for a recipient account; in this mode, the tool receives the data transmitted from the
Did You Have A Profitable Trade But Suddenly Reversed? Exiting a trade is equally important as entering! Exit Scope helps maximize your current trade profit and avoid turning winning trades to losers.
Attention Exit Signals are NOT to be used in entering a trade! Exit means closing your trades to avoid correction/reversal which can wipe out existing profit or haunt break-even orders. Please watch presentation (Click Here)
Features Generates instant exit signals based on price action, volatili
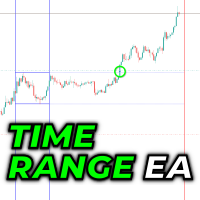
This is a simple Time Range Breakout EA with dynmaic lot size, trailing stop loss and day of week filter. The coding tutorial for the core logic is on my youtube channel.
If you have any questions or suggestions for improvement, you can write to me at any time.
Current components: Magicnumber Dynamic lot size (fix lots/fix amount/percent of account) Time range breakout entry signal
Day of week filter Trailing stop loss
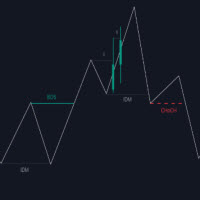
The Market Structure with Inducements & Sweeps indicator is a unique take on Smart Money Concepts related market structure labels that aims to give traders a more precise interpretation considering various factors. Compared to traditional market structure scripts that include Change of Character (CHoCH) & Break of Structures (BOS) -- this script also includes the detection of Inducements (IDM) & Sweeps which are major components of determining other structures labeled on the chart. SMC & price a

PreCogniTrade : Un Indicador Técnico Avanzado para Predecir el Mercado (Fase Beta) El PreCogniTrade es un indicador técnico revolucionario diseñado para los traders que buscan una ventaja competitiva en los mercados financieros. Este indicador no solo analiza las tendencias actuales, sino que también predice los movimientos futuros de los precios con una precisión asombrosa, lo que lo convierte en una herramienta de incalculable valor para cualquier estrategia de trading. Características Pri
FREE

The Ultimate Dashboard Indicators are useful for traders, but when you put them into a dashboard that can scan 28 symbols at once they become even better, and when you can also combine different indicators and timeframes to give you synchronized alerts, then they become awesome. This easy to use dashboard provides you with 32 leading indicators, use them individually or together, to create powerful combination alerts. So when you want to know that RSI is above 25 and the price is above the movin

One of the best trend indicators available to the public. Trend is your friend. Works on any pair, index, commodities, and cryptocurrency Correct trend lines Multiple confirmation lines Bollinger Bands trend confirmation Trend reversal prediction Trailing stop loss lines Scalping mini trends Signals Alerts and Notifications Highly flexible Easy settings Let me know in the reviews section what you think about it and if there are any features missing.
Tips: Your confirmation line will predict tre
FREE
Have you ever been in a situation when you could not control the chart conveniently or had to make additional clicks to be able to scroll the history or set the scale fix numbers manually to be able to stretch the chart? Features: Chart centering. Automatic scale fix. Automatic scroll control. This tool is one of many features included in "Trading Essentials" utility application, which can be found on mql5.com
FREE

Note : Free version can be used for trading on Demo Accounts.
Important :
This is Arbitrage EA and may not work on all accounts. It is recommended to follow the testing process described on product screenshots.
Strategy :
EA will place trades based on Triangular Arbitrage strategy. Triangular arbitrage (also referred to as cross currency arbitrage or three-point arbitrage) is the act of exploiting an arbitrage opportunity resulting from a pricing discrepancy among three different currencie
FREE

Introducing the "Super Trend Filter Oscillator," your ultimate trading companion designed to enhance your technical analysis and help you make informed decisions in the financial markets. This innovative oscillator is crafted to provide valuable insights into market trends and price movements, assisting traders like you in identifying potential entry and exit points. Features: Trend Identification: The Super Trend Filter Oscillator excels in detecting prevailing market trends, whether they are b
FREE

This tool is useful for indicating resistance and support levels It bases on zone in setting to identify top/bottom of candles and and draw rectangle according to those resistance/support level Beside user can edit the zone via dialog on specific timeframe and that value will be saved and loaded automatically. User can determine what strong resistance and support and make the order reasonably.
FREE

El Indicador Dinámico de Soporte y Resistencia es una herramienta versátil que combina niveles de soporte y resistencia con la dinámica del mercado en tiempo real. Al incorporar máximos y mínimos diarios anteriores, proporciona información valiosa sobre la psicología del mercado e identifica áreas potenciales de inversión de précis o rupturas. Con su capacidad para adaptarse a las condiciones cambiantes del mercado y opciones personalizables, los operadores pueden anticipar las tendencias y toma
FREE
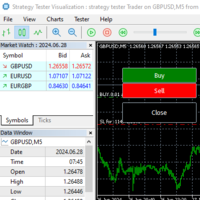
Gives you a trading environment where you can do forward testing without the use of a live trading account. You will be able to trade the same Market without having to wait for the next day, but by just fast forwarding on the strategy tester and going straight to that session. You can trade it over and over again without having to just look at the charts and have a bias analysis when back testing on a chart that is not moving
FREE

Indicador desarrollado para notificar al usuario cuando el RSI entra y sale de las regiones de sobrecompra y sobreventa, la información se muestra en forma de alertas sonoras y de texto. Las notificaciones se pueden deshabilitar en cualquier momento. El usuario puede cambiar el período del indicador, y es posible insertar el indicador RSI en el gráfico a través de las alertas.
FREE
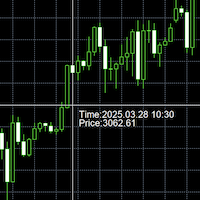
This tool is a time conversion tool that converts the time of the bar where the mouse is located (server time) into the time of the local computer's time zone and displays it at the bottom right of the cursor's position.
How to Set Up: Apply this program to the icon. The program has a variable that controls whether the time is displayed, with the default setting being displayed. If you temporarily do not want the time to be displayed, you can change the variable to False and move the mouse; th
FREE

The advisor NewsCatcher Free opens trades when the price makes a reversal move from support and resistance levels. Market entries should be confirmed by the Relative Strength Index (RSI). The RSI is implemented as a tachometer. It is recommended to use this advisor in a highly volatile market after a political event or a release of major economic data.
You can use this advisor in the semi-automated mode (the RSI performs an information role) or in the fully automated mode (the RSI decides when t
FREE

To download MT4 version please click here . - This is vortex indicator. - It is used to detect trend strength and direction. - It consists of two line(buffers). ==> VIM and VIP - There are three types of signals related to this indicator: 1. crossing VIM and VIP 2. threshold on distance between VIP and VIM 3. VIP above VIM vice versa. - This is a non-repaint indicator with light processing.
FREE

The main advantage of this indicator is filtering of buy and sell signals in the direction of the market impulse and ranking them by strength. Configuration of the indicator is simple and intuitive. All you need to do is to react only to strong signals. Adhere to the money management rules.
Description The Color Stochastic with an analytical panel indicator consists of the Stochastic indicator itself and the information/analytics panel. The indicator provides options for configuring the paramet

Description of the Horizontal Levels Indicator with Manual Interval Adjustment The indicator is designed for automatic plotting of horizontal levels on the chart of a financial instrument. It allows users to manually set the interval between levels, making it adaptable to various trading strategies and timeframes. Key Features: Flexible Configuration : Users can define the interval between levels in points, percentages, or any other unit suitable for the selected asset. Automatic Plotting : The
FREE
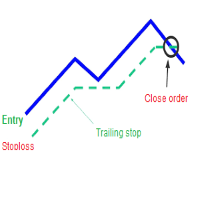
A trailing stop loss is a type of day-trading order that lets you set a maximum value or percentage of loss you can incur on a trade . If the security price rises or falls in your favor, the stop price moves with it. If the security price rises or falls against you, the stop stays in place. With this version, you can run trailing stoploss with currencies (ex start when profit more 1$, trailing stop with 2$...)
FREE

The purpose of Impulse Release is to prevent trading in the wrong direction. While the Impulse System operates in a single timeframe, Impulse Release is based on two timeframes. It tracks both the longer and the shorter timeframes to find when the Impulse points in the same direction on both. Its color bar flashes several signals: If one timeframe is in a buy mode and the other in a sell mode, the signal is "No Trade Allowed", a black bar. If both are neutral, then any trades are allowed, showi
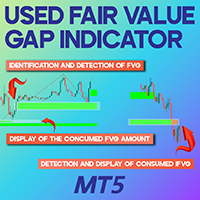
Modified Fair Value Gap (FVG) Indicator for MT5
The Modified Fair Value Gap (Modified FVG-iFVG) indicator is a sophisticated and efficient tool designed for ICT and Smart Money traders, optimized for the MetaTrader 5 (MT5) platform. This indicator detects and marks market imbalance areas (FVG), highlighting key supply and demand zones. Bullish FVG zones are displayed in green, while bearish FVG zones appear in brown. As the price revisits these levels, the indicator dynamically updates by progr
FREE
<What is Grid Trading> Grid trading is a time-tested Forex strategy that focuses on placing buy and sell orders at set intervals above and below a base price. Rather than predicting market direction, the grid strategy thrives on market fluctuations, allowing you to capitalize on both upward and downward price movements. Our EA systematically creates a “grid” of trades designed to take advantage of market volatility without the need for constant monitoring. Our Expert Advisor offers three distin
Automatically scans the chart to find Harmonic Patterns, and give you the chance to enter early in good operations. Also if selected, it will alert you in advance when future patterns appears, showing you a projection of a posible future pattern. The main goal for this algorithm is to determine with high precision the moment when a trend ends and a new one begins. Giving you the best price within a reversal. We have added the "Golden Trade", we define it as the perfect order: For those ord

The "Session Time Vertical Lines" indicator displays vertical lines on the chart that mark the beginning and end of major global trading sessions: Sydney, Tokyo, London, and New York . It is designed to help traders visually identify active market hours, overlaps, and potential high-volume periods directly on the price chart. This tool is especially useful for intraday traders who rely on market session timing to plan entries and exits. Inputs / Settings Parameter Name Description DaysToDraw Num
FREE

About. This indicator is the combination of 3 Exponential Moving averages, 3,13 and 144. it features Taking trades in the direction of trend, and also helps the trade to spot early trend change through Small moving averages crossing Big Moving averages Product features 1. Have built in Notification system to be set as the user desires (Alerts, Popup notification and Push Notification to Mobile devices) so with notification on, you do not need to be at home, or glued to the computer, only set and
FREE
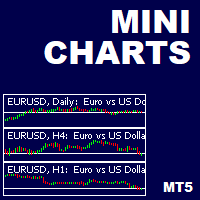
This is a utility indicator that creates mini charts on left side of the chart you are looking at.
It is very useful to watch many timeframes simultaneously, without having to change between multiple charts. Its configuration is very simple. You can have up to 4 mini charts opened. They automatically load the template of the "parent" chart. If you have any doubt please contact me. Enjoy!
This is a free indicator, but it took hours to develop. If you want to pay me a coffee, I appreciate a lot
FREE

Indicador Multi-Fractal – La Herramienta Definitiva para Analizar Marcos de Tiempo Superiores en Marcos de Tiempo Inferiores ¿Alguna vez has querido ver los máximos y mínimos del mercado en marcos de tiempo superiores mientras operas en un gráfico de 1 minuto ? Por ejemplo, ¿ ver los máximos y mínimos del marco de tiempo de 1 hora como un zigzag en el gráfico de 1 minuto o identificar la dirección del mercado en el marco de tiempo de 4 horas sin cambiar de gráfico ? ¡El indicador Multi-Fracta
FREE

This indicator is based on Volumes standard indicator, calculates the average of Volumes based on the last N bars set by users, and if the value of the volume is bigger then a set % respect the average a different color will be used. The indicator is shown in a separate indicator window. This version has now a limitation in setting the % about the threshold.
If you are interested to set threshold consider to buy the PRO version ( https://www.mql5.com/en/market/product/35925 ) If you want to use
FREE

Este indicador es un indicador de volumen, cambia el color de las velas según un cierto número de tics, y el usuario puede informar a este número de tics tanto del número de tics como del color de las velas. Este indicador funciona en cualquier momento gráfico. o cualquier activo, siempre que el activo tenga un número de teletipo para ser informado.
Este indicador busca facilitar la visualización del usuario cuando analiza velas con un cierto número de tics.
FREE
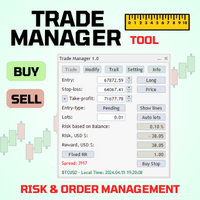
Product introduction : Trade Manager Tool for MT5 Trade Manager Tool will help trader calculate almost exactly the risk based on your account automatically. Along with that, there are features to support capital preservation with Trailing Stop, BreakEven, Risk Limit such as Daily Limit Profit/Loss,etc.. helps you avoid overtrading.In particular, the panel is simply designed with many interactive buttons inside the panel and outside the chart to help trader interact more easily.These features re

This Indicator Automator for MT5 is a flexible MT-5 Expert Advisor targeting the trading strategy development and the automated trading based on up to 4 external indicators.
Benefits:
Import of up to 4 indicators (no source file needed) Fast development of trading strategies Automated trading without coding expenses Support of different money management methods Optional use of grid and martingale techniques Powerful virtual trailing stop also applicable in grid mode
Characteristics: Entries

## Version 2.50
I created this EA with the intention of making it free for everyone to use. It serves as a tool to assist in trading with money management, entering order lots according to a percentage of the account balance, and automatically setting TP/SL based on high/low prices.
In Version 2.50, The Auto TP/SL feature adjusts from the Line In (entry point), and Auto price in this version only shifts the entry line to the current price. Input settings: Ato update SL/TP Line >>> In version
FREE

El EA opera con retornos de precio al promedio después de la finalización de rebotes impulsivos de MA con un período largo. Puede usar el promedio si es necesario. Tiene un panel avanzado y todo tipo de notificaciones. Resolución de problemas -> AQUÍ / Versión MT4 -> AQUÍ Beneficios: Filtrado avanzado de pedidos de cesta
Sistema de negociación totalmente automatizado, con la capacidad de agregar órdenes manuales
Fácil configuración e interfaz de panel intuitiva
Potente potencial comercial
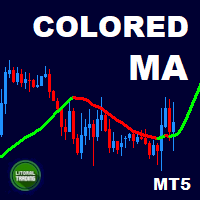
Are you the type who likes to use moving averages and surf the trend? Me Too! that is why I developed this indicator. It is basically a moving average that changes the color according to the trend (up or down). Its appearance can be customized and the price method too. The setup is very simple, no need to explain. If you have any questions or find any errors please contact us! Enjoy!
This is a free indicator, but it took hours to develop. If you want to pay me a coffee, I appreciate a lot <3
FREE
This non-repainting indicator, inspired by Larry Williams’ renowned "VIX Fix", replicates the power of the VIX (Volatility Index) but works across all asset classes—making it a versatile tool for traders. Originally designed for stock indices, this version adapts to any market, including forex, commodities, and crypto, providing valuable insights into potential market bottoms.
For more details, check out this pdf: https://www.ireallytrade.com/newsletters/VIXFix.pdf
Key Features: Based on the w
FREE

SI Connect es una utilidad que establece la conexión con nuestros servidores para utilizar FX Volume o los sistemas de trading SIEA.
Instrucciones técnicas para preparar su terminal para el uso de SI Connect Permita las peticiones web e inserte https://stein.investments a la lista de URLs permitidas en su Opciones de terminal -> Subcategoría Asesores expertos . Sólo necesita una instancia de EA en ejecución por terminal, pero tiene que ejecutarse constantemente en segundo plano para obtener los
FREE

El índice VIX, o Índice de Volatilidad CBOE, es un indicador diseñado para MetaTrader 5 que convierte la volatilidad histórica en un oscilador fácil de interpretar, ubicando el rango de volatilidad entre 0 (mínima) y 100 (máxima) según un período de normalización configurable. A diferencia de un simple ATR, este oscilador te muestra en el gráfico cuándo la volatilidad está anormalmente baja o alta comparada con su comportamiento reciente. Además, el indicador añade información y contexto sobre
FREE

When trading price action or using price action triggers such as Pbars, Inside Bars, Shaved Bars, etc. it is important to always wait for the bar/candle to close more than anything else.It is often the case (whether it’s the 4H, hourly, etc) that price action will be dominant in one direction for the majority of the candle only to reverse strongly at the end of the candle. Institutional traders know retail traders are less disciplined than they are. They know a good trading candle pattern coul
FREE

The utility draws pivot levels based on a selection from day week month The previous candlestick of the selected timeframe is taken and the values for the levels are calculated using the following formulas:
Pivot = (high + close + low) / 3 R1 = ( 2 * Pivot) - low S1 = ( 2 * Pivot) - high R2 = Pivot + (R1 -S1) R3 = high + ( 2 * (Pivot - low)) S2 = Pivot - (R1 - S1) S3 = low - ( 2 * (high - Pivot));
The style and thickness for all lines are adjusted.
The colors for the R, Pivot and S lines ar
FREE

Functional in the Forex market. Functional on the B3 market - Bolsa Brasil Balcão. Motivation The Price Guide indicator is a tool that helps you insert support and resistance points at the chosen price and in the quantity you want, it depends on the agility of its configuration. This DEMO version will work on the Meta Trader 5 Demo account and Strategy Tester. Get the Full version that works with a Real account click: https://www.mql5.com/pt/market/product/111897 Operation The methodology publi
FREE

Introducing The Index Dynamo: Unleash the Power of Price Action
The Index Dynamo is a cutting-edge Metatrader Expert Advisor designed to harness the dynamic movements of the index trading. Built upon the principles of price action trading, this powerful tool identifies high-probability trading opportunities with precision.
Experience the automated trading with The Index Dynamo. This expertly crafted EA incorporates robust stop-loss (SL) and order management mechanisms to manage risk effective
FREE

Highly configurable CCI indicator. Features: Highly customizable alert functions (at levels, crosses, direction changes via email, push, sound, popup) Multi timeframe ability Color customization (at levels, crosses, direction changes) Linear interpolation and histogram mode options Works on strategy tester in multi timeframe mode (at weekend without ticks also) Adjustable Levels Parameters:
CCI Timeframe: You can set the current or a higher timeframes for CCI . CCI Bar Shift: you can set t
FREE

El indicador ZigZag SMC/SMT para MT5 es la herramienta ideal para los traders que desean identificar con precisión máximos y mínimos basándose en los conceptos avanzados de Smart Money Concepts (SMC) y Smart Money Trap (SMT).
Beneficios principales: Identificación automática de máximos y mínimos estratégicos. Basado en conceptos utilizados por traders institucionales. Ideal para analizar liquidez, estructura del mercado y manipulación. Fácil de usar: simplemente agréguelo al gráfico
FREE

If you like this project, leave a 5 star review. Often times we are using brokers that are outside of the GMT-0 timezone, this
not only complicates things, but, it can make seeing when a trading session starts
a bit more difficult than it should. This indicator allows you to set a timezone offset it will draw a vertical line for the: Day. Week. Month. Quarter. year.
FREE

** All Symbols x All Timeframes scan just by pressing scanner button ** *** Contact me to send you instruction and add you in "Channel Scanner group" for sharing or seeing experiences with other users. Introduction: The Channel pattern is described as the area located between two trend lines. This area is used for a measure of a trading range. In this case, the upper trend line connects price highs while the lower trend line connects price lows. Also when it comes to breakout points, it
Forex Trade Manager Grid MT5 helps you to managing orders and achieve the goal. You only need to place first order with Take Profit, run EA and set in params profit (pips) you want to get. EA will be managing your positions, as will gather appointed amount of pips. It’s a strategy for management of manual trades opened on current pair. The strategy adds positions to currently opened trades in a grid management (with chosen distance in pips between trades) - up to 15 trades (or less). First up to
FREE

The True Oversold Overbought indicator provides you with ability to swiftly check whether the asset is oversold or overbought. Other than complementing your trading with True Oversold Overbought, you can use the indicator as your only trading system. It works with all forex instruments and will save you the headache of estimating when the market is due for a reversal or retracement. When the "Super Charge" feature is enabled, the areas where the price is in oversold/overbought status are ampli

FOREXBOB AUTO CLOSER is a very handsome tool for :- Scalping Correlation Hedging Those who use averaging methods As this utility tool will help you by closing all your running trades when the universal floating P/L reaches a certain value that you will put in inputs. This tool consider all the trades that running on the your account either opened MANUALLY or with help of an EA.
Inputs USD - Put numeric value for required profit Group Mode - False Magic No. - Zero (0) to consider manually opene
FREE

Tops & Bottoms Indicator FREE Tops abd Bottoms: An effective indicator for your trades
The tops and bottoms indicator helps you to find ascending and descending channel formations with indications of ascending and/or descending tops and bottoms. In addition, it show possibles opportunities with a small yellow circle when the indicator encounters an impulse formation.
This indicator provide to you more security and speed in making entry decisions. Also test our FREE advisor indicator:
FREE

This panel displays the price percentage change
Shows the percentage change in price from the last open: Daily, Weekly and Monthly timeframes. Numbers are easier to use than histogram currency meters. Line up the three timeframes strengths/weaknesses for strong trends. Compare currencies strongest against weakest. USD is the world's reserve currency to compare against.
How to use 1. Match the strongest currency with weakest currency; or 2. Match the strongest or weakest currency against USD;
FREE

This Expert Advisor examines signals from indicators such as MACD, Stochastic, and RSI to identify market trends and turning points. It incorporates multiple strategies and works seamlessly together. The Advisor analyzes the market situation in real time and automatically executes trades at predefined stop loss and take profit levels. HydraAlchemist is also easy to use. The intuitive and easy-to-understand setup screen allows you to execute trading strategies with few parameters. When trading Go
FREE

El indicador muestra niveles redondos en el gráfico. También se denominan niveles psicológicos , bancarios o de jugadores importantes. En estos niveles, hay una verdadera pelea entre alcistas y bajistas, la acumulación de muchos pedidos, lo que conduce a una mayor volatilidad. El indicador se ajusta automáticamente a cualquier instrumento y período de tiempo. Cuando el nivel 80 se rompe y luego se prueba, compramos . Cuando el nivel 20 se rompe y luego se prueba, vendemos
FREE
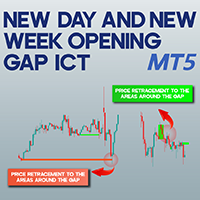
New Day and New Week Opening Gap ICT NWOG NDOG MT5 The New Day and New Week Opening Gap ICT NWOG NDOG MT5 indicator is a powerful and practical tool designed for traders using MetaTrader 5. It helps detect price gaps that emerge at the start of a new trading day or week, making them visible on the chart. When the market closes at the end of a session, the reopening price may differ from the previous close, leading to a price gap. This indicator marks weekly price gaps ( NWOG ) in red and daily p
FREE

This EA is completely private EA given after back-testing a particular strategy.
You can request to get the strategy by contacting the following number in WhatsApp +91 9567407508.
You can contact in telegram too.
The EA basically takes trade on particular one hour candle breaks.
You should use this EA only after attending a zoom meeting and a proper back-test.
Understand the rules and regulations of your country while you trade in forex and other commodity.
FREE

Pivot Points Indicator – Your Technical Compass in the Market Unlock powerful levels of market structure with our Pivot Points Indicator – a classic tool enhanced for modern trading! Designed for MetaTrader5, this indicator automatically calculates and displays daily, weekly, or monthly pivot levels along with key support and resistance zones. Whether you're a scalper, day trader, or swing trader, pivot levels help you identify potential reversal points , entry zones , and take-profit targ
FREE
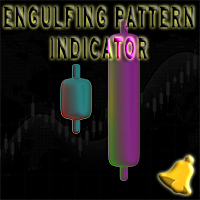
Engulfing Pattern is a free indicator available for MT4/MT5 platforms, its work is to provide "alerts" when a "Bullish" or "Bearish engulfing pattern forms on the timeframe. This indicator comes with alerts options mentioned in the parameter section below. Join our MQL5 group , where we share important news and updates. You are also welcome to join our private channel as well, contact me for the private link. Engulfing Pattern Indicator MT4 Other Products Try our Martini EA with 2 years of liv
FREE

SuperTrend Indicator for MetaTrader 5
Ride Trends Like a Pro — Never Miss a Move Again Description:
The SuperTrend Indicator is your ultimate companion for mastering trend-following strategies. Designed to cut through market noise, this powerful tool combines the precision of Average True Range (ATR) with adaptive trailing stops to pinpoint trend reversals, confirm breakouts, and keep you on the right side of the market. Whether you’re trading forex, stocks, crypto, or commodities, the SuperTr
FREE

MFI_Expert is structured based on a specific technical analysis indicator ( Money Flow Index ). It has many parameters so that each user can find the appropriate settings that suit their investment profile. It can work on 28 different pairs, one pair per chart. The default parameter settings are indicative, I recommend that each user experiment to find their own settings.
FREE

Esse indicador é a combinação do RSI (IFR) com Média Móvel Simples aplicada o RSI em um único indicador para facilitar a criação de alguma estratégia. Fiz esse indicador para que um único indicador contenha os buffer necessários para implementar alguma EA.
Descrição dos Buffers para o EA,
Buffer 0 -> Valor do RSI Buffer 1 -> Valor da média móvel aplicada ao RSI
FREE

This indicator is designed to detect the best divergences between price/MACD and price/RSI. MACD and RSI produce by far the best divergence signals therefore this indicator focus on those two divergences. This indicator scans for you up to 15 instruments and up to 21 timeframes for bullish and bearish divergences. You need to add the indicator only to one single chart ! The indicator will then automatically scan all configured instruments and timeframes.
Important Information
The indicator che
¿Sabe usted por qué MetaTrader Market es el mejor lugar para vender estrategias comerciales e indicadores técnicos? Con nosotros, el desarrollador no tiene que perder tiempo y fuerzas en publicidad, protección del programa y ajustes de cuentas con los compradores. Todo eso ya está hecho.
Está perdiendo oportunidades comerciales:
- Aplicaciones de trading gratuitas
- 8 000+ señales para copiar
- Noticias económicas para analizar los mercados financieros
Registro
Entrada
Si no tiene cuenta de usuario, regístrese
Para iniciar sesión y usar el sitio web MQL5.com es necesario permitir el uso de Сookies.
Por favor, active este ajuste en su navegador, de lo contrario, no podrá iniciar sesión.