Regardez les tutoriels vidéo de Market sur YouTube
Comment acheter un robot de trading ou un indicateur
Exécutez votre EA sur
hébergement virtuel
hébergement virtuel
Test un indicateur/robot de trading avant d'acheter
Vous voulez gagner de l'argent sur Market ?
Comment présenter un produit pour qu'il se vende bien
Expert Advisors et indicateurs pour MetaTrader 5 - 49

Moving average indicator to work with the F12 Replay simulation and replay tool.
In this way, the F12 Replay tool now supports the moving average indicator.
F12 Replay: https://www.mql5.com/pt/market/product/38313
This is a product developed by Renato Fiche Junior and available to all MetaTrader 5 users!
Partners: "Águia Traders" team ( Eagle Traders ) by Larissa Sihle #aguiatraders #larissasihle
Input Parameters
Period Shift Method
FREE

Make grid trading safe again | Built by a grid trader >> for grid traders. Walkthrough Video <== Get Grid Rescue up and running in 5 minutes This is MT5 version, click here for BlueSwift GridRescue MT4 (settings and logics are same in both versions) BlueSwift Grid Rescue MT5 is a risk management utility MT5 EA (used together with other grid trading experts) that can help you trade aggressive grid / averaging / martingale systems with manageable drawdown, therefore

This EA is named Dinosaur Hunter(DH) because it can capture very large trend, such as 5000-10000 pips. DH trades infrequently as it patiently waits for the right market conditions. DH can load multiple currency pairs on a single chart to increase the number of trades. Live Signal
This is a demo version that only for fixed lot size of 0.01. To obtain the full version, please purchase Dinosaur Hunter Pro . This EA has been tested from 2015 to the present. The test used data from Dukascopy. If
FREE

The UJ_H1_170100007_S_OD_CF_SQX is an algorithmic trading strategy for MetaTrader, tested on USDJPY using the H1 timeframe from April 1, 2004, to April 24, 2024. There is no need to set up parameters, all settings are already optimized and fine-tuned.
Recommended broker RoboForex because of EET timezone.
You can find the strategy source code for StrategyQuant at the link: http://quantmonitor.net/listing/usdjpy-osma-impulse/
Key details are:
Parameters
MagicNumber: 170100007
Main
FREE

The currency strength momentum has a lot of similarities with currency strength meter presented in the previous page, but the difference are much more pronounced. You can try putting both in the same chart and see the difference in results. Currency strength momentum measures strength of a currency based on (you guess it) it's momentum relative to other currencies, while currency strength meter measures the strength of a currency based on pips it has moved in a certain direction.
FREE

Smart Lot-Size Calculator And Trade Assistant for Mobile Trading Overview: This is the tool every trader in the market must have no matter if you are scalper, swing traders, day trader, or long term trader. This On-The-Go trading tool will help you stay disciplined and also stay free from daily trade management chores, Most traders face common problems like 1. Calculation of proper lot-size of a position to take controlled risk 2. Managing every trade and trailing stop-loss if trades goes in
FREE
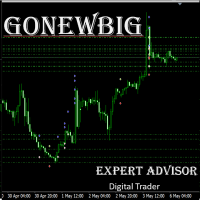
GoNewBig 是根據信號產生器做出交易決定後再根據現有的資金量調整下單的單量 設計目的希望所有參與交易的交易者,都能夠獲取合理的利潤
值得注意的是,過去的歷史回測匯或許會有相當大的利潤發生.但是將來的行情型態是不可知的.所以不要盲目地相信EA會創造出絕對的利潤,但也不要一昧地認為自動交易就是不可取的
特點
自適應的交易信號: 根據市場狀況自動調節信號產生的條件 簡單的設定方式: 只需簡單的設定即可. 單品種交易: 根據信號產生器做EURUSD單品種的交易 無華麗顯示面板: 將算力完全用在交易程序的計算 可以更高效續的執行工作 短期交易策略: 開單頻率及持倉時間一週 安全的風險控制: 在當前行情不例於持倉狀況時安全認損 不會早造成爆倉或是大量虧損
環境
使用時間框 H1 交易品種 EURUSD (品種必須列在報價清單上) 啟動資金使用1500美金即可運行 免費版只能交易EURUSD 正式版可以交易多品種 購買或是測試可以聯繫我取得適當的參數
運行淨值保持在2500美金以上 能更加確保交易帳戶的安全
參數
Magic : 自訂義EA持倉的辨
FREE

//////////////////////////////////////////////// //////////////////////////////////
An improved version of the standard Bulls Power and Bears Power indicators.
Now it's two in one.
The setup is simple - you just need to specify the period. It is also very easy to understand the readings of this indicator, a signal above zero is a buy, and below it is a sell.
//////////////////////////////////////////////// ///////////////////////////////////
I hope this indicator will be very useful t
FREE

Este indicador imprime 2 médias com distância de 1 ATR (Average True Range) da média principal. As demais médias móveis só são mostradas se estiverem fora desse intervalo. Parâmetros: mediaprincipal = Média que será criado o intervalo, não será mostrada. mediasec1, mediasec2, mediasec3 = médias secundárias. periodatr: periodos do ATR Este indicador faz parte do Trade System MarketStrengthRadar
FREE

Simple utility to help identify local time of price movements. This way you can analyze better and prepare for future movements. Just point to the candle and it will display the time of the candle in your local time zone.
See my other products in the MQL market: https://www.mql5.com/en/users/jdelgadocr/seller Thanks for checking them out. If you have a need for something not too complex, let me know.
FREE

The Keltner Channel is a volatility-based technical indicator composed of three separate lines. The middle line is an exponential moving average (EMA) of the price. Additional lines are placed above and below the EMA. The upper band is typically set two times the Average True Range (ATR) above the EMA, and the lower band is typically set two times the ATR below the EMA. The bands expand and contract as volatility (measured by ATR) expands and contracts. Since most price action will be encompasse
FREE

The indicator draws a normal chart by coloring it in colors based on prices calculated by the Heiken Ashi indicator algorithm.
That is, the shape of the candles does not change.
In fact, this is the same Heiken Ashi that does not distort the price chart.
Then there will be a drawing of a cat, because there is nothing more to write about the indicator. .
FREE

The News Breakout Strategy is an advanced, automated trading solution designed to capitalize on market movements during specific time intervals. Developed for the MetaTrader platform using MQL5, this strategy identifies key breakout points within a user-defined time range and executes trades accordingly. Additionally, it adjusts the timing based on news events related to two currencies, enhancing its responsiveness to market conditions.
FREE

The Mono Waves indicator is designed to display the wave behavior of the market on a chart. Its appearance is presented on slide 1. This indicator uses the PPPC (Point-Percent Price Channel) indicator, which can be downloaded for free from the Market . When the market moves up, the upper border of the price channel is built on High candlestick prices (for more details, see the description of the PPPC indicator at the link given above). The higher the High prices rise
FREE

Forex Indicator Arrows is an arrow Indicator used as an assistant tool for your trading strategy. The indicator analyzes the standard deviation of bar close for a given period and generates a buy or sell signals if the deviation increases. It good to combo with Martingale EA to follow Trend and Sellect Buy Only/Sell Only for EA work Semi-Automatic. You can use this Indicator with any EAs in my Products.
FREE
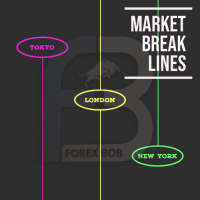
Market Break Lines is an utility tool to create a partition line at market openings/closings of Tokyo/London/NewYork sessions. This will help you to compare the market movements, volatility variations between the different markets.
Inputs: Inputs are simple to feed the time of Tokyo/London/NewYork sessions as per your broker server time Change Color and width of partition lines You can enable or disable any line (Hide/Show).
Please don't forget to support by giving handsome reviews/rating
FREE

The GJ_H1_220100009_S_HD_CF_SQX_SL20 is an algorithmic trading strategy for MetaTrader, tested on GBPJPY using the H1 timeframe from April 1, 2004, to April 24, 2024. There is no need to set up parameters, all settings are already optimized and fine-tuned.
Recommended broker RoboForex because of EET timezone.
You can find the strategy source code for StrategyQuant at the link: http://quantmonitor.net/listing/gbpjpy-macd-trader/
Key details are:
Parameters
MagicNumber: 220100009
M
FREE

Non-lagging VOLATILITY indicator A radical modification of the ATR indicator, which corrected all of its shortcomings (the picture shows the difference with ATR). The indicator shows the swing size of the current market movement. Features: does not have a time window period, i.e. any subjective settings non-delayed, the extremums of the indicator always coincide with the extremum of the price (note the picture) is normalized by means of a color solution, i.e. it has the properties of an oscillat
Crash Scalper Gold It is an indicator, where it marks points of purchase and points of sale As the name says, it is used to scalp in the pairs of (Crash) 1000/500/300 where it sends you signals of sale/Sell and purchase/Buy at level points (90) he sends you the sell signal, (Spike) at the level point (27) it sends you the buy signal, (Trend Candles) It is very simple and easy to use. to make the best tickets possible! For this period it will remain on sale! Without further ado, enjoy! Good profi

This EA take advantage from great markets movement by setting up pending orders on support and resistance lines, after that it wait the market movement to fill these orders, if it don't the EA deletes them and creates another pending orders. This system don't use grid neither martingale. It is simple and pure TakeProfit and StopLoss, and it has virtual trailing stop to mask trailing stop from server. It don't need to worry about news of high impact. It is advisor to use ECN account type with low

"AV Monitor MT5" is an indicator for MetaTrader 5, which alowes a history analysis of the closed orders. It helps to achieve a quick visual analysis of your own trading or different expert advisors among themselves. Compare and analyze your expert advisors: Which one is the best?
I use an "AV Monitor MT5" indicator per running expert advisor chart to track its performance split into long & short, as well as an index chart e.g. DOW with this indicator and the setting "Show Balance & Equity" to

Multifunctional universal trading system . Suitable for all Forex and Crypto markets.
.set files are updated weekly, published on our site.
----
Frank.ex5 [FOR OPTIMIZATION], fast engine for optimization of TS_DayTrader Trading System.
Designed specifically for high-speed optimization in MT5 Tester.
For graphical interface, see Frankenstein.ex5 .
Both Frankenstein.ex5 and Frank.ex5 have automatic trading capabilities.
Parameters(.set files) for Frank.ex5 and Frankenstein.ex5 are in

SuperTrend is one of the most common ATR based trailing stop indicators.
In this version you can change the ATR calculation method from the settings. Default method is RMA, when the alternative method is SMA.
The ea is easy to use and gives an accurate reading about an ongoing trend. It is constructed with two parameters, namely period and multiplier. The default values used while constructing a superindicator are 10 for average true range or trading period and three for its multiplier.
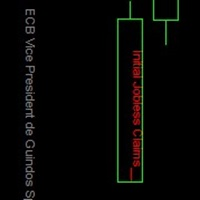
This is one of the most powerful indicators I've ever made.
I was tired of looking at other windows/websites for economical news, and regularly something would happen without me realising.
So I made this indicator which displays all news at the exact time of arrival, directly on the charts!
Now you too can just focus on the charts and know that you won't miss any news events.
There are options:
1. You can choose to display on the price line, or at the bottom of the chart. 2. You can

Supply or demand zones refer to price areas where a significant amount of supply or demand had previously entered the market, causing prices to either fall or rise. If the price returns to the demand or supply zone, it is likely to bounce off due to the large number of orders previously placed within the zone. These orders will be defended in these areas.
The Fair Value Gap (FVG) is a concept used to identify imbalances in the equilibrium of buying and selling. Fair Value Gaps are formed in a

This expert advisor will help updating your stoploss when your trades are in profit. It will work on all open trades for the symbol it is attached with. It takes 2 input.
Recommended Settings:
For eur/usd,gbp/usd/usoil etc 1. Stop Loss Points: 50 2. Stop Loss Trigger Points: 100
For eur/usd,gbp/usd/usoil etc 1. Stop Loss Points: 500 means 0.5 usd or 5 pips 2. Stop Loss Trigger Points: 1000 means 1 usd / 10 pips
1. Stop Loss Points It is stop loss point, distance from current price to s
Size Calculator allow you to calculate the size you need for your position giving two parametres: the number of pips risked and the money risked, for example if you want to risk 20 USD on 200 pips, then you will need to input 200 in the case reserved for pips and 20 in the case reserved for risk, the size will appear in left top carner of the chart in your metatrader 4 platform, Size Calculator support the following symbols : EURUSD GBPUSD AUDUSD NZDUSD GOLD WTI EURJPY GBPJPY USDJPY AUDJP

RSI Entry Points is the upgrade of the standard RSI indicator to avoid lagging. Indicator draws the clouds and the arrows to have clear picture where price is and what to wait for. Why standard RSI is lagging? because mostly we do not use it correctly and it is with very weak visual flexibility, less informativity. With my current upgrade I tried to Fix both problems same time and I got much better results and more exact entries than standard RSI has. To make yourself sure check out the screens

Indicador en MQL5, que obtiene el promedio de 10 EMAS, que son alineadas según Fibonacci, obteniendo un promedio, que sera suavizado. Se puede ingresar un numero desde 2 a N, que multiplica a los EMA-Fibonacci. Funciona en cualquier criptomoneda, etc. etc... pudiendo calcular el futuro segun la tendencia de las EMAS. Funciona excelentemente en tramos largos, determinando exactamente el mejor inicio/salida.
El precio inicial por apertura sera por un periodo de tiempo, luego aumentará.

FOREX AI3 MT5 expert advisor Implements an automated trade entry system based on the AI#3 engine. The strategy is intended to work with positive swaps. Positions may remain open for days or weeks. It is recommended to set 'Use Minimum Swap Filter for Opening Trade' to True and use positive swap values. Back testing indicates that the system has the potential to work on a variety of forex pairs. Depending on settings used multiple trades and significant drawdown events are possible. EA options

Trading advisor for XAUUSD, trading based on support and resistance levels
Promotion for traders only!! Only the first 10 copies for $150, next price $200 (don't miss your chance) This trading advisor is designed specifically for trading the XAUUSD instrument using support and resistance levels. Support and resistance levels are key concepts in technical analysis and are used to determine likely price turning points. The advisor automatically detects these levels and uses them to make tradin

Indicador "MR BEAST - Detectador de Mejores Spikes" para el Índice CRASH 1000 (M1) El indicador "MR BEAST - Detectador de Mejores Spikes" es una herramienta especializada y altamente precisa diseñada exclusivamente para operar en el índice CRASH 1000, con un enfoque específico en el marco temporal de 1 minuto (M1). Desarrollado por el reconocido trader Mr. Beast, este indicador ha sido meticulosamente diseñado para identificar únicamente los mejores spikes, permitiendo a los operadores capitaliz
The utility is designed to display on the chart the margin zones built on the basis of margin requirements for futures of the Chicago Mercantile exchange (CME). These margin zones are good levels of resistance and support, as seen in the screenshots.
How to use To trade on margin zones, use the following rules: buy after the day has closed above one of the zones to the next zone; sell after the day has closed below one of the zones to the next zone; after opening a sell trade, place limit sell

TREND HARMONY MT5 – Multi Timeframe Trend and Phase and Pullback Level Visualizer indicator for Metatrader5 The TREND HARMONY indicator automates deep trend analysis and generates visualizations for you. Take control of your trades by eliminating uncertainty! Revolutionize your trading experience with precision and insight through the TREND HARMONY Multi Timeframe indicator – your ultimate MT5 trend visualization indicator. [ Features and Manual | MT4 version | All Products ]
Are you t

GoldFusion: The Ultimate Trading Robot for XAUUSD H4 The GoldFusion trading robot is optimized to operate on the XAUUSD currency pair with an H4 (4-hour) trading timeframe. It offers a strategic approach for traders aiming to combine precision with adaptability in their trading. Technical Indicators Used Seasonal Trend Analysis (Thursdays) : GoldFusion leverages seasonal patterns by focusing on trends that emerge on Thursdays. This targeted approach allows the robot to capitalize on consistent w

Dear users!
- This is a Forrex trading expert advisor following the trend trading method. It has proven its effectiveness in overcoming 2 rounds of FTMO fund challenges. This is a modified and optimized version after completing the process of passing 2 rounds of FTMO challenges. - Max drawndown auto caculate by risk initial setting. Telegram instruction for backtest and using: https://t.me/ +0lDs0UXiJUVjM2Jl I. Application Highlights: 1. Safe and easy to use. 2. Martigale and grid are not ap

this is an indicator to clarify seeing Low and High in the market and is very useful for facilitating those who are studying technical price action
this is a type of indicator that gives color to the candlestick where the indicator is divided into 3 colors red = bearish green = Bullish
Gray = base
this indicator can be used on the forex market or the mt5 binary market. https://t.me/SBA_FOREX_SIGNAL

STL TradeBooster trades on the currency pairs EUR/USD, GBP/USD, USD/CAD, AUD/USD, on the 5-minute timeframe. STL TradeBooster works with any deposit STL TradeBooster enters the market on the Stochasic and MA indicators STL TradeBooster has a convenient control panel STL TradeBooster trades in two modes Safe mode and Hard mode Safe mode - intermediate lot 0.02 is used in a series of orders, trailing stop is activated, which prevents gaining profit, but also does not increase large series. Sui

Description :
VWAP (Volume-Weighted Average Price) is the ratio of the value traded to total volume traded over a particular time horizon. It is a measure of the average price at which pair is traded over the trading horizon. Read More.
All Symbols and All Timeframes are supported.
Indicator Inputs :
VWAP Mode : Mode of VWAP Calculation. Options can be selected : Single,Session,Daily,Weekly,Monthly
Volumes : Real Volumes,Tick Volumes
Price Type : Used price for cal

ATR Scanner Pro is a multi symbol multi timeframe volatility scanner that monitors and analyzes Average True Range indicator value in up to 28 symbols and 9 timeframes in 3 modes : ATR value: As a volatility dashboard it shows the ATR indicator value in all pairs and timeframes and signals when the ATR value reaches a maximum or minimum in a given duration. Short term ATR/Long term ATR ratio: It shows ratio of 2 ATRs with different periods. It's useful in detecting short term volatility and

Imagine what results you could achieve in your manual trading if you had a tool that notifies you of a possible price reversal for all the symbols you are interested in at the same time (futures, stocks, forex or cryptocurrency)?
VSA screener is just the right tool. It was created for traders who value their time and make their own trading decisions on opening or closing a position. The software monitors the presence of trading patterns on the preselected tickers under several timeframes (up t
FREE

Volumes ******************* Volumes для платформы секундных графиков Micro . ********************* Секундный график на порядок увеличит точность ваших входов и выходов. Секундный период , в привычном формате, позволит увидеть то, что ранее было скрыто. Бесплатные индикаторы, дополнят визуальную картину, что, в совокупности выведет вашу торговлю на новый уровень. Идеально подходит как скальперам, так и трейдерам торгующим внутри дня. Индикатор Volumes для платформы Micro. Входные парам
FREE

This is a classic trading strategy based on two Moving Averages crossover. customized for usdjpy with a Good risk management strategy RR 1/2 . ( Long when fast MA crosses slow MA from below and Short when fast MA crosses slow MA from above ) TF : 5MIN MAX Lot size to use : 2% e.g : Balance =100 => lot size = 0.02 Balance =1000 => lot size = 0.20 Balance =10000 => lot size = 2
------
FREE

This strategy is flexible and allows for adjustments according to your preferences. You can easily open trades independently and close them using the app. The strategy includes implemented settings such as TEMA, trailing stop loss, STOCH, RSI, MACD, etc. With this strategy, you gain tools and techniques that can lead to successful trading on financial markets. For specific details and setting options, do not hesitate to contact me. Tested on EURUSD on the M5 chart.
For a detailed guide, please
FREE

Laguerre Indicator with Gamma Input Overview: The Laguerre Indicator is a sophisticated financial analysis tool designed to provide traders and investors with a dynamic and responsive method to track market trends. Its core functionality is centered around a unique algorithm that adapts to market volatility, offering clearer insights compared to traditional indicators. Key Feature - Gamma Input: Gamma: The sole input for the Laguerre Indicator, 'gamma,' plays a pivotal role in calibrating the i
FREE

To download MT4 version please click here . Metatrader users are limited to few moving average types. Therefor I decided to create a package consisting of all MAs I knew. This package suggests 12 different types: { SMA, EMA, DEMA, TEMA, WMA, VWMA, SMMA(RMA), HullMA, LSMA, ALMA, SSMA, TMA } You can configure them via input tab. This is a non-repaint indicator with light load. To implement them I referred to standard libraries of pine script.
FREE

Что такое CCI индикатор? Стандартный Индикатор CCI (Commodity Channel Index) – это осциллятор, который измеряет силу, стоящую за тем или иным движением цены. Он помогает определить, кто находятся у руля: быки или медведи. Как и многие осцилляторы импульса, CCI работает, сравнивая текущую цену с предыдущими показателями, и на основе этого сравнения он решает, насколько сильное движение цены вверх/вниз.
Как рассчитать CCI? Метод расчета стандартного индикатора представляет собой оригинальн
FREE

OPTIMISER EA AVANT LE TEST ET L'UTILISATION.
Bitcoin M5 permet de négocier le BTC/USD sur des graphiques de 5 minutes. SL et TP doivent commencer par 50 000. OPTIMISER AVANT UTILISATION
La stratégie de trading utilise des indicateurs de bandes de Bollinger et d'enveloppes pour effectuer des transactions. Négociez pour attraper certains points de cassure où le prix franchit les bandes, puis sortez lorsque le prix franchit les enveloppes. Chaque transaction utilise un montant de lot fixe et

Transform your way of analyzing the market with our innovative trend and support/resistance indicator!
By combining the robustness of pivot points, the sensitivity of price adjustment, and the reliability of moving averages, our indicator provides a comprehensive and intuitive view of price behavior. Whether to detect emerging trends, track significant price shifts, or map critical support and resistance zones, this tool is your reliable guide amidst market volatility (BMF WIN).
T ested f
FREE
Un système automatisé d'envoi de notifications afin qu'aucun de vos abonnés ne rate vos événements de trading depuis votre terminal de trading. Un utilitaire qui envoie des notifications au messager Telegram sur toutes les opérations de trading sur votre compte. Instructions pas à pas pour connecter l'utilitaire à une chaîne dans Telegram -> ICI / MT4 -> ICI Avantages : Installation facile et instructions détaillées, Possibilité d'envoyer des captures d'écran ajustables, Texte de notification p

This is a simple EA Can only open ONE trade EVER then MUST be reattached to the chart everytime you want to use it. Designed to help manual traders Has lot sizes and stops / targets in pips. For a buy trade the engulfing bar must close above the previous red bars high Includes Alarm and Phone notifications
Basically if you find a price zone you like and will take a trade if there is an engulfing bar . use this.
FREE

The "VSA on the FLY" indicator is designed to quickly display various Volume Profile / Market Profile parameters.. The indicator takes the initial data for operation from the M1 timeframe. The indicator is installed on any timeframe and starts displaying data starting from the selected left border. This can be the beginning of a day, a week, a trading session, any hour, etc.
The version of this indicator for MetaTrader 4 can be found here .
The following input parameters are available: Show

O Touch VWAP é um indicador que permite calcular uma Média Ponderada por Volume (VWAP) apenas apertando a tecla 'w' no seu teclado e após clicando no candle do qual deseja realizar o calculo, clicando abaixo do candle é calculada a VWAP baseado na minima dos preços com o volume, clicando sobre o corpo do candle é calculado uma VWAP sobre o preço medio com o volume e clicando acima do candle é calculado uma VWAP baseado na máxima dos preços com o volume, voce tambem tem a opção de remover a VWA
FREE

You can send MetaTrader screenshot easily to your identified telegram channel via press the send button that on the chart. TelegramBotToken: Telegram API credentials. You can create API credentials on my.telegram.org web page ChatId: Your telegram chatId. Secreenshots will be sending this channel - Please do not press the button repeatedly. This may cause your bot or ip address to be blocked. - You have to add telegram api address ( https://api.telegram.org ) in Option > Expert Advisors > Allow
FREE

Tick imbalance bars (TIB), described in the book Advances in Financial Machine Learning (2018) by Marcos López de Prado. Indicator that show candlestick bars with an different sampling method than time fixed. Real time data is sourced to the indicator and it may be used as substitute of the default graph. Each bar is formed when a predefined tick balance is exceeded, showing in the graph the OHLC of this cluster of ticks. The input variable is the amount of ticks of each bar. The indicator may
FREE

This is addition of Effective SV squeeze momentum that add bolliger band and Keltner channel to chart window. Squeeze momentum introduced by “John Carter”, the squeeze indicator for MT5 represents a volatility-based tool. Regardless, we can also consider the squeeze indicator as a momentum indicator, as many traders use it to identify the direction and strength of price moves. In fact, the Tradingview squeeze indicator shows when a financial instrument is willing to change from a trending ma
FREE

A Price Action Trading Expert Advisor (EA) is a type of automated trading system designed to execute trades based on price action patterns and signals. Price action trading focuses on analyzing historical price movements to identify potential future price movements without relying on conventional technical indicators.
Here are key aspects and characteristics of a Price Action Trading Expert Advisor:
1. **Strategy Based on Price Action Patterns**: The EA is programmed to identify and trade b

StartPoint是一个很好的短线交易指示器,这个指标可以单独使用,但是最好是配合 HighQualityMap 一起使用,适用于任何时间框架,喜欢超短线的朋友可以使用M5时间框架。它能很好的体现出短期趋势的启动点,你可以很快的从这个指示器上寻找到最佳的buy和sell位置,同时也能很好根据指示器去坚守自己的持仓定订单。指标不含有未来函数,不会重新绘制,不仅能够应用到自己的手动交易过程中,还能完全可以写入到自己的EA中。(如果你感觉到这个指标能够帮助你进行更准确的交易,请帮忙给个好评,希望我的作品能够帮助更多有需要的人) ===================参数列表===================== 所有参数均采用默认参数即可,无需更改,若为激进型交易者,可以根据自己的需要来调整参数。 =================参考使用方法=================== 此指标可以适用于任何交易品种。

MOST is applied on this RSI moving average with an extra default option added VAR/VIDYA (Variable Index Dynamic Moving Average)
MOST added on RSI has a Moving Average of RSI and a trailing percent stop level of the Moving Average that can be adjusted by changing the length of the MA and %percent of the stop level.
BUY SIGNAL when the Moving Average Line crosses above the MOST Line
LONG CONDITION when the Moving Average is above the MOST
SELL SIGNAL when Moving Average Line crosses belo

This indicator is an extended implementation of Weis waves. It builds Weis waves on absolute volumes (which is the classical approach) or delta of volumes (unique feature) using different methods of wave formation and visualization. It works with real volumes, if available, or with tick volumes otherwise, but also provides an option to use so called "true volume surrogates", as an artificial substitution for missing real volumes (for example, for Forex symbols), which was introduced in correspo

This indicator calculates trend via two different moving averages and draw zigzag trend lines. You can change fast and slow Moving Averages settings for customization. Inputs:
Fast MA Time Period : 64 Fast MA Shift: 0 Fast MA Method: Smoothed Fast MA Apply To: Median Price Slow MA Time Period: 32 Slow MA Shift: 0 Slow MA Method: Smoothed Slow MA Apply To: Median Price ZigZag Color: Red ZigZag Type: DashDot ZigZag Width: VeryThin
FREE

MT4 Version GaussChannelPro is a powerful and innovative trading indicator designed to enhance your trading strategy with the precision of Gaussian-based channels. Leveraging the principles of Gaussian (normal) distribution, this indicator creates a unique channel on your price chart, offering valuable insights into market trends and potential turning points. Utilizing advanced statistical analysis, GaussChannelPro calculates the optimal channel boundaries based on historical price data, present

MT4 Version Understanding market sentiment is a critical aspect of successful trading. Market sentiment refers to the overall feeling or attitude of traders and investors towards a particular financial instrument, such as a stock, currency pair, or cryptocurrency. It is a collective perception of market participants' emotions and beliefs about the asset's future price direction. Market sentiment can be bullish (positive), bearish (negative), or neutral (sideways). Knowing the market sentiment ca

The Real Ticks Recording Indicator for MetaTrader 5 backtesting is a powerful tool designed to enable traders to simulate their trading strategies with utmost accuracy and realism. This indicator captures and stores real market ticks, allowing you to replay past market conditions with extreme fidelity, thereby enhancing the precision and reliability of strategy tests. Key Features: Real-Time Tick Capture: The indicator records each market price movement in real-time, ensuring an accurate represe

Order Book, known also as Market Book, market depth, Level 2, - is a dynamically updated table with current volumes of orders to buy and to sell specific financial instument at price levels near Bid and Ask. MetaTrader 5 provides the means for receiving market book from your broker, but in real time only, without access to its history. The library OrderBook History Library reads market book state in the past from archive files, created by OrderBook Recorder . The library can be embedded into you

Attention traders - To receive gifts after purchase, write to me in a private message! You receive after purchase: Indicator Trading panel Access to VIP chat A month of access to the channel using signals. Unique settings EA Golden Elephant is a trading advisor based on its own trend indicator. Here are some of the main advantages of this advisor: uses a unique trend indicator, which can allow you to more accurately determine the direction of price movement in the market. Trading in the directi

Line function : Displays the opening line, Stop Loss, Take Profit( 3:1 RR ) on the chart. Risk management : The risk calculation function calculates the volume of a new order taking into account the established risk and the size you want to risk. It allows you to set any Stop Loss size between 3 and 10 pips. Breakeven Button : Brings all open orders to Breakeven. Clear button : Clears the graph and the selected parameters. Trade Button : Execute the idea. Partials Button : Taking partials of al

[ MT4 Version ] [ Discord Signals ] MT5 to Telegram Signals
Connect your broker account with Telegram and stop missing important notifications. Would you like to receive Telegram notifications? Are you looking for a simple way to share trade signals with your followers? Do you need to start documenting your trades with an automated trading diary? Check out this step-by-step Tutorial . This utility is simple to use and supports a wide variety of settings: Pick your desired Telegram group

Bienvenue chez News Snowball ! "News Snowball" utilise des algorithmes avancés pour analyser les données économiques en temps réel. Il détecte et réagit instantanément aux annonces économiques majeures, optimisant ainsi vos opportunités de trading. Le robot surveille un large éventail de sources d'informations économiques, incluant les communiqués de presse, les rapports financiers, et les annonces gouvernementales. Cela garantit une couverture complète et une analyse approfondie des événements

Ladies and gentlemen, let me explain a simple tool that can help adjust stop-loss positions based on historical data and customized distance. Tool Name: Trailing Stop Pro Description: A trailing stop is a risk management tool commonly used in trading. It allows traders to set a dynamic stop-loss level that automatically adjusts as the price moves in their favor. Here’s how it works: Initial Stop-Loss: When you enter a trade, you set an initial stop-loss level. This is the price at which you’re
FREE
Le MetaTrader Market est la seule boutique où vous pouvez télécharger un robot de trading de démonstration gratuit pour le tester et l'optimiser à l'aide de données historiques.
Lisez l’aperçu de l'application et les avis d'autres clients, téléchargez-la directement sur votre terminal et testez un robot de trading avant de l'acheter. Seul MetaTrader Market vous permet de tester gratuitement une application.
Vous manquez des opportunités de trading :
- Applications de trading gratuites
- Plus de 8 000 signaux à copier
- Actualités économiques pour explorer les marchés financiers
Inscription
Se connecter
Si vous n'avez pas de compte, veuillez vous inscrire
Autorisez l'utilisation de cookies pour vous connecter au site Web MQL5.com.
Veuillez activer les paramètres nécessaires dans votre navigateur, sinon vous ne pourrez pas vous connecter.