MetaTrader 5용 Expert Advisor 및 지표 - 49

Time and Price Fractal Studies is an indicator that will help you identify certain patterns that tend to repeat themseleves at certail times of the day or at certain prices. It is used to study Fractal Highs ad Lows in relation to time and price. You will get to answer certail questions like: At what time of day does this market usually turn around. At what price does the market turn. Is it at round numbers etc.
FREE

A trend expert with a trained neural network. It works according to the strategy of averaging trading positions. Parameters Minus - decrease a take profit when opening a new order
InpStepMinus - take profit level decrease step for an order grid in points
TakeProfit - profit in points for the main grid of orders
StopLoss - limitation of losses in points
Distance - the distance to ope

Simple indicator used in technical strategies to analyze tops, bottoms and reversal or continuation points. Developer information:
Line values and colors:
Buffer 0 : ZigZag line value;
Buffer 1 : ZigZag color value;
Buffer 2 : Median line value;
Buffer 3 : Median color value; Buffer to get the values of each top and bottom. Buffer 4 : Top value;
Buffer 5 : Bottoms value;
Buffer that returns the type of the last direction.
Buffer 9: 0 = Not updated, 1 = High, -1 = Low;
FREE

Are you a trend surfer like us? Do you use Moving Averages too? Ever wanted the are between them to be painted? Yeah, we solved this problem with the Filled MAs indicator! It is very simple, just puts two fully customizable Moving Averages on chart and fill the space between them, changing the color as they intersect. Thanks to gmbraz for the version 1.1 idea. Any questions os suggestions please contact me! Enjoy!
This is a free indicator, but it took hours to develop. If you want to pay me a
FREE
How it works? This EA trades with Stochastic signal and base line crossovers. Only allows one open trade at a time on the currency you have attached this EA. Opens a Buy position if the signal line crosses below base line below the value you set in BuyBelow parameter. Opens a Sell position if the signal line crosses above base line above the value you set in SellAbove parameter. This EA will work in any time frame and in any pair, Stochastic oscillator will base its data on the current time fram

Spike Dragon Indicator is Specially Designed for Boom 300 and Crash 500 Indices. We decided to add the indicator after extensive testing. The strategy is Based on Supply and Demand levels, RSI ,MACD and 1 other custom indicator designed to filter out less probability signals.We accept suggestions in improving our system.
Why choosing Spike Dragon : Easy Installation and compatible with MT5 Platform Onpoint Signals on M1 Timeframe making the system fast in generating Spikes Good risk Managemen

This Indicator works as a momentum oscillator however it is most used to surf the trends. Despite of being an oscillator, MACD (Moving Average Convergence/Divergence) doesn't work with over limit conditions (such as OverBought or OverSold). Graphically it's shown as two lines and an histogram with the diference of them. Standard metatrader has this indicator, however with only the two lines and without the histogram. This way it is much easier to read and uderstand it.
FREE

This indicator is based on Volumes standard indicator, calculates the average of Volumes based on the last N bars set by users, and if the value of the volume is bigger then a set % respect the average a different color will be used. The indicator is shown in a separate indicator window. This version has now a limitation in setting the % about the threshold.
If you are interested to set threshold consider to buy the PRO version ( https://www.mql5.com/en/market/product/35925 ) If you want to use
FREE

SWISS BURGER
Kindly use this expert Advisor in Higher time Frame
HAI FRIENDS AM KARTHIK GOPALAKIRSHNAN Before going for Demo make sure the Your MT5 Broker. Every broker has different rules and regulation. when you going for demo. just change the different settings and try it I have used fixed lot size if you want you can change it. As per your wish.
FREE

A simple indicator/tool to display the current timeframe in the center of the chart. The object is automatically moved to the center of the chart whenever the chart size is changed by the user.
Input Parameters :
Font (default is Arial Black) Font Size (default is 50) Font Color (default is Silver, for light theme graphics, change to black or another dark color) Font Transparency (default is 90%)
FREE

Switch Tray is a shortcut tray tool for commonly used trading pairs provided to traders. It can be placed at the bottom of the chart, and commonly used trading pairs can be set by themselves. 1. You can set the shortcut switch button for your commonly used trading pairs. The default is [EURUSD/GBPUSD/XAUUSD/USDJPY/USDCHF/USDCNH]. / slash is the separator. 2. The button of each trading pair is also equipped with the number of open positions of a certain trading pair. 3. Multi-cycle quick switchi
FREE

The multi VWAP indicator will plot on your chart up to 7 different VWAPs: daily, weekly, quarterly and yearly plus up to 2 customizable intraday sessions. It will also plot the closing level of the previous period for each of the VWAPs displayed e.g. during the month of November you will see the VWAP closing level of October or during Q3 you will see the Q2's closing VWAP price. All levels can also display an optional label. Besides, in order to improve the indicator precision, it will automatic

Um Inside Bar é um dos principais sinais de continuidade de uma tendência existente e as vezes reversão, pois nos mostra locais especiais de entrada, possibilitando uma boa taxa de Risco x Retorno. É simples visualizar um Inside Candle. Esse padrão é formado por apenas dois candles. O primeiro deve ser, preferencialmente grande, e o segundo deve estar integralmente contido dentro dos limites de máxima e mínima do primeiro.

계정 순자산 보호 도구는 예기치 않은 손실로부터 계정의 순자산을 보호하기 위한 필수적인 유틸리티입니다.
이 도구는 자동 거래 프로그램을 사용하는 트레이더를 위해 특별히 설계되었습니다. 계정에서 여러 자동 거래 프로그램을 동시에 실행하는 경우, 특히 밤에 잠자는 동안 블랙스완 이벤트나 거래 프로그램의 장애가 발생할 경우 예상치 못한 손실을 입을 수 있습니다. 이 도구는 이러한 문제를 효과적으로 피하는 데 도움을 줄 수 있습니다.
설정은 매우 간단하며 보호하고자 하는 금액을 입력하기만 하면 됩니다. 현재 계정의 순자산에 기반하여 적절한 설정을 권장합니다. 설정을 완료한 후 "확인"을 클릭하여 프로그램 인터페이스로 이동한 다음 "실행"을 클릭하십시오. 오른쪽에 있는 얼굴이 웃는 얼굴로 바뀌면 프로그램이 정상적으로 실행되고 있다는 것을 나타냅니다.
프로그램 실행 중에 계정 순자산이 설정한 보호값보다 낮아지면 모든 차트가 즉시 닫히며, 거래 프로그램도 중지됩니다. 동시에 모든 주
완벽한 초 차트 표시기를 사용하면 분초를 초로 변환할 수 있습니다.
1. 정확한 시간에 바를 100% 닫으려면 초 수를 선택하세요.
2. 이것은 요율 기반 데이터이며 진드기를 사용할 수 없는 경우에도 작동합니다.
3. 외부 DLL이 필요하지 않으며 VPS에서 원활하게 작동합니다.
4. 빠르고 최적화된 코드
5. BInance, Kucoin 및 선물 차트를 몇 초 단위로 쉽게 변환할 수 있는 기타 모든 거래소와 같은 암호화폐 쌍을 지원합니다.
6. 금, 외환쌍 등 모든 유형의 기호를 지원합니다.
7. 기호 및 요율을 삭제하는 옵션. 완벽한 초 차트 표시기를 사용하면 분초를 초로 변환할 수 있습니다.
1. 정확한 시간에 바를 100% 닫으려면 초 수를 선택하세요.
2. 이것은 요율 기반 데이터이며 진드기를 사용할 수 없는 경우에도 작동합니다.
3. 외부 DLL이 필요하지 않으며 VPS에서 원활하게 작동합니다.
4. 빠르고 최적화

한 번에 여러 포지션/거래를 열어야 합니까? 우리는 귀하의 쉬운 솔루션을 만들었습니다. 이제 한 번에 여러 직위를 입력할 수 있습니다. 로트 크기, 포지션 수, 이익 실현 및 손실 중지를 설정할 수 있습니다. 예: 특정 로트 규모로 3, 5, 10 또는 원하는 수의 포지션을 구매하려고 합니다. 이제 "구매" 버튼을 탭하기만 하면 됩니다. 또는 예: 특정 로트 규모로 3, 5, 10 또는 원하는 수의 포지션을 판매하려고 합니다. 간단히 "판매" 버튼을 클릭하시면 됩니다. han beon-e yeoleo pojisyeon/geolaeleul yeol-eoya habnikka? ulineun gwihaui swiun sollusyeon-eul mandeul-eossseubnida. ije han beon-e yeoleo jig-wileul iblyeoghal su issseubnida. loteu keugi, pojisyeon su, iig silhyeon mich sonsil jung

이 표시기를 사용하면 큰 글꼴 크기로 피보나치 레벨 레이블을 표시할 수 있습니다.
. 최대 25개의 피보나치 레벨을 지원합니다.
- 피보나치를 그리자마자 선택한 색상과 글꼴로 큰 글꼴 크기의 입력 매개변수로 추가한 레벨이 표시됩니다.
맞춤형 옵션:
1. Fibo 텍스트 글꼴
2. Fibo 텍스트 크기
3. Fibo 텍스트 색상
3. 각 레벨에 설명 추가
4. 앵커 및 각도와 같은 기타 옵션
이 표시기를 사용하면 큰 글꼴 크기로 피보나치 레벨 레이블을 표시할 수 있습니다.
. 최대 20개의 피보나치 레벨을 지원합니다.
- 피보나치를 그리자마자 선택한 색상과 글꼴로 큰 글꼴 크기의 입력 매개변수로 추가한 레벨이 표시됩니다.
맞춤형 옵션:
1. Fibo 텍스트 글꼴
2. Fibo 텍스트 크기
3. Fibo 텍스트 색상
3. 각 레벨에 설명 추가
4. 앵커 및 각도와 같은 기타 옵션
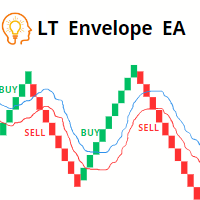
저희의 혁신적인 LT Envelope EA를 소개합니다. Envelope 지표를 활용하여 거래 경험을 향상시키는 강력한 도구입니다. 이 전문가 어드바이저는 트레이더들에게 우수한 주요 기능과 유연한 기능을 제공하도록 특별히 설계되었습니다. 이를 통해 금융 시장에서의 추세 추종과 거래 결과를 최적화하는 데 꼭 필요한 솔루션으로 자리매김하고 있습니다.
주요 특징:
1. Envelope 지표 전략: 저희 EA는 Envelope 지표를 기반으로 한 모든 거래를 자동화하여 정확한 시장 진입과 이탈에 Envelope 지표의 추세 추종 능력을 활용할 수 있게 해 줍니다.
2. 다양한 시간대의 다재다능함: 여러 시간대에서 저희 EA를 사용하는 자유로움을 경험해 보세요. 이는 다양한 거래 스타일과 선호도에 부합합니다.
3. 맞춤형 거래 방향: EA를 고유한 거래 전략에 맞추어 조정하고 원하는 거래 방향을 선택하여 거래에 대한 더 큰 통제력을 갖게 해 줍니다.
4. 스마트한 자금 관

시장 구조는 더 높은 기간의 돌파가 트레이더에게 추세를 정리하는 데 도움이 될 수 있는 구조입니다.
1. 이 표시기는 지그재그를 마지막 2개의 구조(지그재그의 이전 최고점 및 최저점)에만 끌어당기고 구조가 파손된 경우에만 새로운 지그재그 막대가 형성됩니다.
2. 구조의 파손시 터미널 및 푸시 알림을 제공합니다.
3. [ 및 ] 키에서 지그재그의 확장 깊이를 증가 및 감소시켜 스윙을 조정합니다.
4. Line AB BC 및 CD의 색상 변경
5. 많은 차트에 추가하고 여러 기호에 대한 경고 받기
Break of Structure Multi ExtDepth Breakout Multi Symbol Scanner를 찾고 있다면 이 제품을 사용할 수 있습니다. Multi Symbol Multi ExtDepth ZigZag Breakout Scanner

1. 이 주문 시스템 은 로 컬 주문 시스템 입 니 다. 즉, 발사 단 과 수신 단 은 반드시 같은 컴퓨터 에서 조작 해 야 합 니 다. MT4 / 5 계 정 은 여러 대의 컴퓨터 에서 동시에 로그 인 할 수 있 기 때문에 계 정 비밀번호 만 읽 고 고객 에 게 보 내 면 주문 할 수 있 습 니 다.로 컬 주문 서 는 네트워크 주문 과 관련 이 없 기 때문에 속도 가 빠 르 고 매우 안정 적 입 니 다.
2. 현재 수신 단 입 니 다. 도표 에 불 러 올 때 입력 매개 변수 에서 "senderAccount" 을 발신인 mt4 / mt5 계 정 으로 바 꾸 면 정상적으로 작 동 할 수 있 습 니 다. 또한 발사 단 을 설치 해 야 합 니 다.
3. 하나 가 많 고 하나 가 많 으 며 하나 가 많 음 을 지원 합 니 다. 컴퓨터 가 여러 개의 MT4 / MT5 를 실행 할 수 있다 면 몇 개의 주문 서 를 실행 할 수 있 습 니 다. 같은 플랫폼 은 설 치 된 폴 더 를 복사
FREE
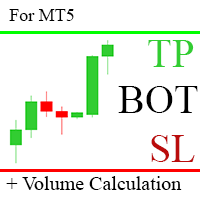
TP SL Bot is a utility that automatically sets Stop Loss and Take Profit for newly opened orders in several ways. There is also a function for calculating the volume that you need to open the trade to get the desired amount with the specified Stop Loss / Take Profit size. There are several options for calculating the size and setting parameters: 1. Setting based on the amount specified by the user as a percentage of the current deposit balance. 2. Setting as the amount entered by the user. 3. Se

Simple ATR Modern 시장 변동성을 더 명확하게 추적하기 위한 간소화된 도구로, 데이 트레이딩과 스윙 트레이딩 모두에 이상적입니다. 거래를 시작하거나 초보자에게 가장 적합한 지표입니다.
시각적 지표 색상: ATR Daily - 파란색 Volatility Vision 지표와 결합하여 분석을 향상하세요. 시장 상황의 변동성을 정확하게 측정하여 데이 트레이딩과 스윙 트레이딩 결정을 내리는 데 필수적입니다. 기본 14일(구성 가능) 단순 이동 평균의 진정한 범위 지표를 사용하여 정확성을 보장합니다. 거래 시스템에서 오픈 거래 또는 종료 전략을 구현하는 데. ATR 지표가 다른 지표보다 우수한 이유: 사용의 간편성: ATR 지표는 설정 및 이해가 쉬워 초보 트레이더도 쉽게 사용할 수 있습니다. 다재다능성: 데이 트레이딩과 스윙 트레이딩 모두에 적합하여 다양한 거래 전략에 유연성을 제공합니다. 신뢰성: ATR은 정확한 시장 변동성 데이터를 제공하여 트레이더가 보다 정보에 입각한

핍스 헌터 프로는 수년에 걸쳐 개발되었으며 이전 버전보다 개선된 버전입니다. 이 강력한 지표는 시장과 가격 이력을 분석하여 매수 및 매도 항목을 생성합니다. 이러한 항목의 계산을 위해 함께 작동하는 다양한 지표와 덜 유리한 항목을 필터링하고 제거하는 복잡한 통계 로그를 사용합니다 / MT4 버전 . 가격은 전략의 높은 수준의 효율성을 유지하기 위한 지속적인 검색으로 인해 $1000에 도달할 때까지 점진적으로 상승할 것입니다. 다음 가격 --> $69
특징 다시 칠하지 않음
이 인디케이터는 새 데이터가 도착해도 값이 변경되지 않습니다
지연 없음 이 표시기는 지연되지 않습니다 거래 쌍
모든 외환 쌍 (가급적 EURGBP)
타임프레임
모든 차트주기
매개변수 ===== 표시 =====
화살표 거리 // 신호(화살표)와 캔들스틱 사이의 거리
===== 알림 =====
팝업 알림 // MT4 터미널용 알림
푸시 알림 알림 // 휴대폰용

The Strat를 사용하여 거래할 때 여러 시간대를 주시하는 것이 중요합니다. 이 표시기는 각 기간에 대한 현재 캔들의 일일, 주간, 월간 및 분기별 상태를 표시합니다. 원 아이콘은 해당 기간의 캔들이 현재 내부 또는 TheStrat 용어로 유형 1임을 나타냅니다. 인사이드 데이 양초가 가격 움직임을 통합하고 있으며 우리는 범위의 돌파를 찾고 있습니다. 위 또는 아래를 가리키는 삼각형 아이콘은 추세 양초 또는 TheStrat 용어의 유형 2입니다. 추세 양초는 강세 또는 약세일 수 있으며, 이는 이전 양초 범위를 벗어나 현재 한 방향으로 추세를 보이고 있음을 나타냅니다. 사각형 아이콘은 아웃사이드 캔들 또는 Strat 용어로 Type 3입니다. 이것은 두 가지를 나타냅니다. 하나는 가격이 해당 기간에 대한 방향에 대해 결정되지 않았고 상당히 고르지 못할 가능성이 높으며, 두 번째는 더 낮은 기간에 짧은 반전을 거래할 수 있는 좋은 기회가 있을 가능성이 있다는 것입니다. 사각형은

작업 논리 이 표시기의 중요성은 "계기에 연료가 얼마나 남아 있는지"를 이해할 수 있다는 사실에 있습니다. 상황을 상상해보십시오. 배터리가 반쯤 방전 된 자동차에 평균적으로이 양의 에너지는 일반적으로 250km의 자동차에 충분하므로 원하는 경우 700km의 거리를 극복 할 수 없습니다. 따라서 각 상품에 대해 특정 일일 가격 변동이 있으며, 통계적 관찰 결과 자산의 95%가 하루 1ATR을 통과하고 5%만이 2ATR을 통과하는 것으로 나타났습니다.
예: 일일 ATR EURUSD = 682핍. 예를 들어 TP가 500핍인 레벨의 돌파에 대해 거래를 시작하면 올바른 TP 크기를 설정한 것처럼 보이지만 자산이 이미 1일 ATR의 90%를 넘었다는 점은 고려하지 않았습니다. 거래가 열렸을 때, 따라서 상품에 TP를 수신하기에 충분한 에너지가 없을 가능성이 높습니다. 상품에 충전량이 10%만 남아 있는 것을 확인했다면 TP를 조정하거나 거래를 전혀 입력하지 마십시오.
파워 리저브 표
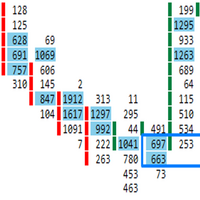
최고의 가치를 찾기 위해 1년 동안 최적화
주문 흐름은 거래량을 거래한다는 점에서 독특합니다. EUR/USD를 기반으로 구축되었으며 2021년 11월 11일부터 2022년 10월 24일까지 1시간 차트에서 최적화되었습니다. 자금 관리를 위한 최적화 입력이 사용됩니다. 이 EA는 엄격한 자금 관리를 사용하며, 부자가 되는 빠른 마팅게일이나 sl 없는 EA가 아닙니다. 거래는 도박이 아니라 위험 관리에 관한 것입니다. EUR/USD 1시간 차트에서 실행하거나 최적화할 다른 자산 및 시간 프레임을 찾으려면 1년 데이터에서 최적화하십시오. 최고의 가치를 찾기 위해 1년 동안 최적화
주문 흐름은 거래량을 거래한다는 점에서 독특합니다. EUR/USD를 기반으로 구축되었으며 2021년 11월 11일부터 2022년 10월 24일까지 1시간 차트에서 최적화되었습니다. 자금 관리를 위한 최적화 입력이 사용됩니다. 이 EA는 엄격한 자금 관리를 사용하며, 부자가 되는 빠른 마팅게일이나 sl 없

VSA 목표 지표를 식별한 전문적인 구매자 또는 전문 판매자에 차트를 사용하 VSA(볼륨 확산 분석)시스템을 구축 트렌드 지원 영역에 상대적인 이러한 막대기(촛대),뿐만 아니라 대상으로 수준입니다. 특징: 1. 에서 이 표시기는,당신이 선택할 수 있습니다 이 모드에서는 전문 구매자 또는 전문 판매자 결정될 것이고,모두 전문적인 참여자에 결정됩니다. 2. 기호에 임의의 시간대를 설정하여 지원 영역과 목표 수준을 결정할 수 있습니다. 거래할 때,큰 기간은 설정을 결정하는 지역 및 목표 수준이고,자체 트랜잭션 수행할 수 있습에 작은 기간에 대한 더 정확한 항목으로 트랜잭션이 있습니다. 3. 에 표시 설정을 선택할 수 있습니다 틱는 경우 볼륨 틱 볼륨을 사용하고,실제 볼륨을 경우 실제 볼륨을 사용합니다. 4. 대형 판매자 또는 구매자를 결정할 때 볼륨 크기와이 볼륨의 검색 기간을 수동으로 선택할 수 있습니다. 5. 전문가를 만드는 데 사용될 수있다. 설명: 녹색 점선은 구매자의 지원

여기까지 오신 것을 환영합니다. 이미 전략 스캐너 의 무료 버전을 알고 계실 것으로 예상됩니다. 또한 중요하다고 생각하기 때문에 알림이 있는 도구를 찾고 계십니다: MetaTrader에서 알림 휴대폰에서 알림 이메일 알림 소리 알림 이러한 알림은 Rule Plotter Scanner의 라인에 새로운 화살표가 나타날 때 항상 알림을 제공합니다. 소리 알림, MetaTrader 알림, 스마트폰 알림 및 이메일 알림 중에서 선택할 수 있습니다. Rule Plotter 라인의 모든 힘을 활용하고 이 도구로 Rule Plotter Scanner의 알림을 받아보세요. 귀하의 관심과 구매에 감사드립니다. 여기에서 나의 더 많은 무료 및 유료 제품을 MetaTrader로 전송할 때 알려드리기 위해 나를 친구로 추가하세요: Rule Plotter 개발자 .

이 도구는 귀하의 위치에 정류장을 배치합니다
Metatrade Strategy Tester로 빠르게 테스트하십시오. 긴 위치의 경우 마지막 바닥에 중지됩니다. 또는 짧은 위치의 경우 마지막 상단에 중지됩니다.
또한 이 도구는 오픈 포지션의 후행을 관리합니다. 항상 마지막 고점 또는 마지막 형성된 저점에 스톱을 놓으십시오.
고점과 저점을 만들기 위해 이 링크에서 다운로드할 수 있는 무료 지표인 "지지 및 저항선"을 사용합니다. metatrade 5에 대한 무료 고점 및 저점 지표 다운로드
이 도구는 삽입된 자산의 모든 열린 위치의 정지점을 이동합니다. i doguneun gwihaui wichie jeonglyujang-eul baechihabnida
Metatrade Strategy Testerlo ppaleuge teseuteuhasibsio. gin wichiui gyeong-u majimag badag-e jungjidoebnida. ttoneun jjalb-

AITradeMaster is an advanced Expert Advisor (EA) system developed on the MQL5 platform, utilizing the latest advancements in neural networks and deep learning. Designed for maximum automation and ease of use, AITradeMaster requires no additional settings from the user, allowing even novice traders to benefit from its functionality.
Key Features: Automatic Settings : All trading parameters are automatically generated by the implemented neural network. The user does not need to worry about con

손익분기점을 자동으로 설정하는 유틸리티로, 주어진 거리를 지나갈 때 거래를 손익분기점으로 전환합니다. 위험을 최소화할 수 있습니다. 상인을 위해 전문 상인이 만들었습니다. 유틸리티는 거래자가 수동으로 또는 고문을 사용하여 개설한 모든 시장 주문과 함께 작동합니다. 매직 넘버로 거래를 필터링할 수 있습니다. 유틸리티는 동시에 원하는 수의 주문을 처리할 수 있습니다.
MT4 버전 https://www.mql5.com/en/market/product/57076
유틸리티가 할 수 있는 일:
1핍에서 가상 손익분기점 설정 실제 수준의 손익분기점 설정 각 주문에 대해 개별적으로 작업(손익분기 수준은 각 주문에 대해 별도로 설정됨) 단방향 주문 바구니로 작업(손익분기 수준은 모든 주문에 대해 공통으로 설정되고 별도로 구매 및 판매) 양방향 주문 바스켓으로 작업(손익분기 수준은 모든 주문에 대해 공통으로 설정되며, 함께 구매 및 판매) 테스트 및 작업을 위해 차트의 버튼을 사용할 수

A professional line break chart which is displayed directly in the chart window thus making it possible to trade directly from the MetaTrader 5 charts. The line break chart can be displayed as the most widely used 3 line break chart or a custom variation such as 2 or 5 line break chart . Wicks can be displayed or hidden on the chart - they give a lot of additional information regarding the underlying price action. The indicator's settings include: Line break number - determines the number of lin

이 유틸리티는 귀하의 거래 계정에서 거래를 복제하도록 설계되었습니다. 프로그램은 귀하의 매개 변수로 추가 거래를 엽니다. 로트를 늘리거나 줄이고, 많이 추가하고, 손절매를 변경하고, 이익을 얻을 수 있는 기능이 있습니다.이 프로그램은 "Windows PC" 및 "Windows VPS"에서 작동하도록 설계되었습니다. Buy a cloner and get the second version for free
옵션: CLONE_POSITIONS - 복제 명령; MAGIC_NUMBER - 매직 넘버; DONT_REPEAT_TRADE - true인 경우 수동 마감 후 거래가 반복되지 않습니다. REVERSE_COPY - 역방향 복사, 예를 들어 BUY 대신 SELL을 엽니다. LOT_MULTIPLIER - PROVIDER 계정에서 복사하는 볼륨 계수(=0인 경우 FIXED_LOT에 지정된 로트로 복사); PLUS_LOT, MINUS_LOT - 플러스 및 마이너스 로트; MAXIMUM_

통화 강도 측정기는 현재 어떤 통화가 강하고 어떤 통화가 약한지에 대한 빠른 시각적 가이드를 제공합니다. 미터는 모든 외환 교차 쌍의 강도를 측정하고 계산을 적용하여 각 개별 통화의 전체 강도를 결정합니다. 우리는 28 쌍의 추세를 기반으로 통화의 강도를 기반으로 계산합니다.
MQL5 블로그에 액세스하여 표시기의 무료 버전을 다운로드할 수 있습니다. Metatrader 테스터 제한 없이 구매하기 전에 시도하십시오. 여기를 클릭하십시오.
1. 문서 모든 추세 통화 강도 문서( 지침 ) 및 전략 세부 정보는 MQL5 블로그의 이 게시물에서 볼 수 있습니다. 여기를 클릭하십시오.
2. 연락처 질문이 있거나 도움이 필요하면 비공개 메시지를 통해 저에게 연락하십시오.
3. 저자 SAYADI ACHREF, 핀테크 소프트웨어 엔지니어이자 Finansya 설립자.

Ez 채널 지표는 차트에서 실제 추세 채널을 자동으로 식별하므로 추세 추종 트레이더에게 필수적인 도구입니다. 이 지표를 사용하면 더 이상 차트에 추세선을 직접 그리느라 시간을 허비할 필요가 없습니다. 모든 기호 및 시간 프레임에 대한 추세 채널을 빠르게 그려서 시간과 노력을 절약할 수 있습니다. Ez Channel의 주요 기능 중 하나는 미니 컨트롤 패널로 원하는 대로 시간을 쉽게 조정할 수 있습니다. 이 제어판을 사용하면 새로운 시장 움직임으로 변경이 발생하기 전에 식별된 채널을 저장할 수도 있습니다. 이 기능을 사용하면 추세선을 다시 그리는 번거로움 없이 시장 추세를 쉽게 추적하고 분석할 수 있습니다. Ez Channel은 모든 기호 및 시간 프레임에 적합하므로 다양한 거래 전략에 적용할 수 있습니다. 나중에 사용할 수 있도록 식별된 채널을 저장하는 편리함을 제공하며 이러한 저장된 채널을 언제든지 볼 수 있습니다. 이 기능을 사용하면 서로 다른 시간 프레임의 추세를 비교하고

Технический индикатор "Reversal patterns" является математической интерпретацией классических разворотных паттернов: Pin Bar, Harami и Engulfing. То есть «Разворотного бара», «Харами» и «Поглощения». Данный индикатор позволяет определить момент разворота котировок на основе рыночной динамики и победителя между «быками» и «медведями». Индикатор отображает момент разворота на локальных максимумах и минимумах графика любого таймфрейма, что позволяет повысить точность сигнала. Также индикатор имеет
!!!ATTENTION TRADERS!!! Bug hunters will get an EA of their choice FOR ABSOLUTELY FREE!!! If you purchase any of my EAs and happen to find a bug, report it to me and I'll gift you one of my EAs here on MQL5 for ZERO dollars, no strings attached! Download the entire trade journal in csv format here → drive.google.com/file/d/12rs2Ymff1Wt2YDgJf1HyLSxQJV1XwfXa/view I recommend you to open it with LibreOffice Calc if Microsoft Excel gives you an error. Description: Regenerat0r is a novel trading rob

ToolBot Advisor Indicator (RSI, ATR, ADX, OBV) FREE An effective indicator for your negotiations
The toolbot indicator and advisor brings leading (OBV) and lagging (RSI, ATR, ADX) indicators so that you have more security in your negotiations. In addition, it informs you of possible up and down trends as well as providing you with incredible advisors who will give you information about trading opportunities.
With this indicator you will have more security and speed in your decision making
FREE

The EA does not use grid, martingale, and arbitrage. The trading system is suitable for both experienced traders and beginners. The EA includes protection against high spread. Works well with the default settings. Provides a SAFE approach towards risk management with enabled Trailing stop. Expert Advisor will only use 1% of your free margin as risk and hence results in low trade volume but LOWER Drawdown as well
Important Information Revealed By purchasing this Expert Advisor you are entit


Complete Trade Panel for the No Nonsense Forex method: This panel encapsulates almost all things you will need to execute your own NNFX algorithm, helping you trade even faster and easier. It has 3 parts: Symbol Panel Switch to any symbol in your charts quickly by pressing its name. Additional information can be displayed in the panel: currently open trades , correlation of those trades with other symbols (except if their stop loss is in breakeven or positive) and upcoming news (next daily candl

Introduction to GARCH Indicator GARCH is the short initial for Generalized Autoregressive Conditional Heteroskedasticity and it is the volatility prediction model commonly used in financial industry. GARCH model was first appeared in the work by Danish Economist, Tim Peter Bollerslev in 1986. The 2003 Nobel Prize winner, Robert F Engle also added much contribution for the refinement of GARCH model with Tim’s work. Our GARCH INM predictor took the original method of Nelder Mead for GARCH model bu
FREE

메타트레이더용 거래량 프로필 인디케이터로 거래량 분석의 힘을 발견하세요! / MT4 버전
기본 거래량 프로필은 거래를 최적화하려는 수동 트레이더를 위해 특별히 설계된 지표입니다. 거래량 프로필 인디케이터는 시장 움직임을 더 잘 이해하고자 하는 진지한 트레이더에게 필수적인 도구입니다. 혁신적인 솔루션을 사용하면 거래량이 가격별로 어떻게 분포되어 있는지 명확하고 간결하게 시각화할 수 있습니다. 이를 통해 지지 및 저항 수준, 누적 및 분포 영역, 주요 제어 지점과 같은 주요 관심 영역을 식별할 수 있습니다. 특정 날짜의 거래량을 나타내는 일반 거래량 표시기와 달리 기본 거래량 프로필은 특정 가격의 거래량을 보여줍니다.
이 인디케이터는 직관적이고 사용자 지정 가능한 인터페이스를 갖추고 있어 거래 선호도에 맞게 조정할 수 있습니다.
특징 가격 차트에 거래량 프로필을 명확하게 표시합니다. 거래량이 많은 영역과 적은 영역을 빠르게 식별합니다. 트레이딩 스타일에 맞게 색상과

The Market Reversal Catcher indicator looks for market reversal points or major pullback. To do this, it analyzes previous price movements and using a flexible algorithm for estimating the probability of a reversal, also gives recommendations on entry points and sets recommended profit targets for positions opened on a signal. Market Reversal Cather User Guide - Read Version for MetaTrader 4 - here The indicator is very easy to use and does not require a lot of information to understand how it

Get all benefits of a grid strategy and none of its disadvantage | Built by a grid trader >> for grid traders.
This is MT5 version, click here for Blue Sonic Donchian MT4 (settings and logics are same in both versions) Real monitoring signal --> Sonic Gold | Sonic Fx Intro BlueSonic Donchian EA ('Sonic') is a next-gen multi-currency multi-timeframe EA base on Donchian indicator. Other than normal one-off entry, users would have option to activate grid series to maximize return f

표시기는 두 부분으로 구성됩니다. 1부: 색상 양초가 주요 추세를 보여줍니다. 컬러 캔들(Color Candles)은 컬러 캔들스틱으로 시장 상태를 파악하는 것입니다. 스크린샷에서 보듯이, 색상이 아쿠아(Aqua)라면 시장은 매수 주문을 해야 하거나 매도 주문을 종료해야 하는 상태입니다. 색상이 토마토라면 짧은 주문을 하거나 긴 주문을 종료할 때입니다. 색상이 변경되는 경우 완료될 때까지 기다리는 것이 좋습니다(현재 막대가 닫힐 때까지). 파트 II: 밴드 그리기 안쪽 밴드는 안전 구역으로 정의되고, 바깥쪽 밴드는 마감 주문용으로 정의됩니다. 아래와 같은 거래 전략: 색상이 아쿠아이고 가격이 내부 밴드에 있는 경우 장기 주문을 하고, 가격이 외부 밴드를 넘으면 주문을 마감할 시간입니다. 색상이 토마토이고 가격이 안쪽 밴드에 있으면 짧은 주문을 하고, 가격이 바깥쪽 밴드를 넘으면 주문을 마감할 시간입니다. 참고 : 가격이 내부 밴드에 있을 때 진입 시장에만 해당됩니다. 이는 매우

Orders Manager is a simple and indispensable assistant for managing all your orders. Inputs: Magic = 999; // Magic TakeProfit = 1000; // Take Profit. If = 0 the level is not setts. StopLoss = 0; // Stop Loss. If = 0 the level is not setts. Slippage = 10; // Slippage GeneralProfit = false; // Closing all orders based on total profit. If false the function is disabled and works according to TakePr
FREE

Ultimate Breakout Scanner (Multi Pair And Multi Time Frame) : ---LIMITED TIME OFFER: NEXT 25 CLIENTS ONLY ---46% OFF REGULAR PRICE AND 2 FREE BONUSES ---SEE BELOW FOR FULL DETAILS Breakout trading is one of the most popular trading approaches used in the institutional trading world.
As it takes advantage of the never ending phenomena of price expansion and contraction (through volatility) .
And this is how institutional traders are able to take advantage of explosive moves in the market .

パラボリックのデータをもとにトレンドの方向性を1分足から月足まで表示します。 1分足から 月足 まで表示されているので今どの方向に価格が動いているのかがすぐに分かります。
更新はティク毎ではなくディフォルトでは1秒毎、もちろん変更も可能なのでチャートの表示が遅くなるようなことはありません。
機能:
どの通貨でも表示可能になります。
アイコンの色を指定することが可能になります。
表示位置(X軸、Y軸)が変更可能 になります。
表示位置 (左上 、 右上 、 左下 、 右下) が 指定 が可能 になります。
フォント を指定することが可能になります。
フォントサイズ が 変更可能 になります。
アイコンのサイズ が 変更可能 になります。
週足、 月足 の非表示 が 可能 になります。
FREE

Product Description: Adaptive Y-Axis Scaling is a powerful MT5 indicator designed to enhance your trading experience by providing precise control over the Y-axis (price) scaling of your charts. This innovative tool allows you to customize the price scaling by specifying the number of pips from the visible chart's highs and lows. The calculated price range from this input is then used to set the maximum and minimum prices for the open chart, ensuring an optimized and comprehensive view of market
FREE
The version of Kali IndicOptimizer for Metatrader 5. This tool is not only an Expert Advisor, it is used to optimize your indicators, to design your own Expert Advisor, to analyze the buffers of your indicators without having access to the source code. I searched for quite some time how I could optimize my indicators without having to program or modify an expert each time. With this tool, anyone can get started in strategy design or even have their own personalized Expert Advisor. It can optimi
FREE
Introducing the Range Breakout Day Trader. This Expert Advisor only trades during the day (European time). This EA uses proven strategies and doesn't use high risk Grid, Hedge or Martingale recovery strategies. This EA shows that safe and reliable automated trading systems don't need to cost that much. Introduction price of only 129.00 USD ! Prop Firm Ready Live Signal (medium risk): Click here This carefully crafted Expert Advisor opens one position every day after a range has been set betw

Smart Range Breakout EA is a fully automated time range breakout strategy, which uses calculated trailing stop-loss to trade high volume moves on the market. The strategy comes with not overly optimized default settings, however it can be experimented with. This expert advisor does not use any martingale, grid or similar techniques, therefore there are no spikes in the relative equity drawdown. LIVE PERFORMANCE : https://www.mql5.com/en/signals/1823580 The strategy works best on USDJPY and EURU

This was an old idea that now became reality. We've been often asked how is the win rate of our trading systems. Well, the win rate is a statistical variable which depends on the R:R ratio plus any edge that can be obtained by filtering and execution. Given this Expert Advisor tries to identify the predominant trend and execute trades properly, You are given the choice to set the Win Rate You like most and when running a back test You can check how It will be respected in the results metrics. As
FREE

To get access to MT4 version please click here . This is the exact conversion from TradingView: "Candle body size" by "Syamay". This is a light-load processing indicator. This is a non-repaint indicator. Buffers are available for processing in EAs. All input fields are available. You can message in private chat for further changes you need. Thanks for downloading
FREE

Risk Optimizer is the absolute solution for applying risk management on your account. Bad risk management is the main reason that causes traders to lose money. Risk Optimizer calculates and suggests the correct lot size for each position according to your personal, customized risk profile. You can give directly your preferred risk as percentage (%) for each position or you can trust our algorithms to calculate and optimize according to your risk category selection. But it is not only that! Selec
FREE

This indicator displays fractal symbols and bars Use this indicator to show different symbols for bearish and bullish fractals: Choose from 144 symbols (refer to table below) Colors, size and offset of fractals can be modified Fractal price bar or candle color can be changed Hide fractals and show fractal price bar only Frequency in fractal calculation can be changed
How to use 1. Select which symbols to use for bearish and bullish fractals; 2. Select which colors to use for bearish and bulli
FREE

Title : Surefire Hedging Expert Advisor for MT5 Description : Introducing the Surefire Hedging Expert Advisor (EA) for MetaTrader 5, a sophisticated algorithm designed to minimize risk and maximize profits in the Forex market. This EA is perfect for traders who seek a reliable, robust, and user-friendly solution to enhance their trading experience. Key Features : Advanced Surefire Hedging Strategy : The EA employs a proven Surefire Hedging strategy, which involves opening multiple trades in
TrendFollowMT is a fully automated trading system which is using large time frame to determine the trend and use small time frame to find the entry point. Once the trend changed to opposite side, the system will wait for another entry point to recover with bigger lot size. Moreover, the target profit will be moved up when more position had been opened. The aim is to cover the cost of waiting time and risk.
Free version will only trade on buy signal and locked the initial Lot size (0.01). Paid
FREE

Doji Engulfing Paths enables to get signals and data about the doji and the engulfing patterns on charts. It makes it possible to get opportunities from trends, and to follow the directional moves to get some profits on the forex and stocks markets. It is a good advantage to take all the appearing opportunities with reversal signals and direct signals in order to obtain some profits on the forex market. With the demo version, only the signals starting with the 20th candle or bar are available.
FREE

This is a classic trading strategy based on two Moving Averages crossover. customized for usdjpy with a Good risk management strategy RR 1/2 . ( Long when fast MA crosses slow MA from below and Short when fast MA crosses slow MA from above ) TF : 5MIN MAX Lot size to use : 2% e.g : Balance =100 => lot size = 0.02 Balance =1000 => lot size = 0.20 Balance =10000 => lot size = 2
------
FREE

This indicator combines RSI(14) and ADX(14) to find out the signal that price moves strongly. When it appears signal (represent by the yellow dot), and price is going down, let consider to open a SELL order. Otherwise, let consider to open a BUY order. In this case, the strength of moving is strong (normally after sideway period), so we can set TP by 3 times of SL .
FREE

FractalEfficiencyIndicator A ratio between 0 and 1 with the higher values representing a more efficient or trending market, It is used in the calculation of Perry J. Kaufman Adaptive Moving Average (KAMA), dividing the price change over a period by the absolute sum of the price movements that occurred to achieve that change. The Fractal Efficiency or also known as Efficiency Ratio was first published by Perry J. Kaufman in his book ‘Smarter Trading‘. This is mostly considered a filter for v
FREE

THE GOAT INDICATOR ON THE MQL5 MARKET! ️ GET THIS INDICATOR AND STOP LOOKING FOR ANOTHER INDICATOR ️ ️ GET IT NOW BEFORE PRICE INCREASE! ️ SPECIAL DISCOUNT FROM 138$ -> NOW ONLY 88$!!! 2020 Breakthrough Indicator! Imagine that indicators can move the price/market! This indicator use for predict price movement! Using special algorithm for predicting the next price movement! This indicator can be used in any timeframes and any symbols! You can use it for binary option signal

Ultimate Pinbar Scanner (Multi Pair And Multi Time Frame) : ---LIMITED TIME OFFER: NEXT 25 CLIENTS ONLY ---46% OFF REGULAR PRICE AND 2 FREE BONUSES ---SEE BELOW FOR FULL DETAILS A strong pinbar is clear evidence that the institutions are rejecting a particular price level.
And the more well defined the pinbar, the higher the probability that the institutions will
soon be taking prices in the opposite direction.
Pinbar patterns are widely used by institutional traders around the world.

TickChart Indicator plots tick line on the main window of MetaTrader.
In the Lite version, the number of ticks is limited to 20 and the alert function described below is omitted. The tick-line shows the most detailed, fastest and real-time activities of the market, which are usually hidden in bars or candles longer than 1 minute. Usually, several new tick-line segments appear while a bar of M1 time frame is completed. After the release of an important economic indicator, the number of ticks pe
FREE

MACD 히스토그램 지표는 트레이더가 시장 동향과 모멘텀 변화를 이해하기 쉽게 하기 위해 설계된 MACD 지표의 업데이트 버전입니다. 원래의 MACD와 달리 이 버전에는 히스토그램이 포함되어 있으며, 이는 MACD 라인과 신호 라인 간의 차이를 보여주는 막대 그래프입니다. 작동 방식은 다음과 같습니다. MACD 라인이 신호 라인 위에 있을 때 강세 시장을 나타내며 히스토그램 막대는 녹색으로 표시됩니다. 반면에 MACD 라인이 신호 라인 아래에 있을 때 약세 시장을 나타내며 히스토그램 막대는 빨간색으로 변합니다. MACD 히스토그램 지표의 흥미로운 점은 시장 모멘텀이 변화함에 따라 막대의 색이 변한다는 것입니다. 따라서 모멘텀이 강세에서 약세로 전환될 때 막대가 녹색에서 빨간색으로 변하고 그 반대의 경우도 마찬가지입니다. 또한 가격 움직임과 MACD 지표 간의 차이를 감지하는 것을 용이하게 하여, 잠재적인 시장 반전을 나타낼 수 있는 쌍의 가능한 다이버전스를 강조하는 데 도움이 되는

Highly configurable Momentum indicator.
Features: Highly customizable alert functions (at levels, crosses, direction changes via email, push, sound, popup) Multi timeframe ability Color customization (at levels, crosses, direction changes) Linear interpolation and histogram mode options Works on strategy tester in multi timeframe mode (at weekend without ticks also) Adjustable Levels Parameters:
Momentum Timeframe: You can set the lower/higher timeframes for Momentum. Momentum Bar Shift:
FREE

This indicator displays the spread Simple and easy to use and fully customisable: View as Pips or Pipettes Chart symbol can be hidden Text display can be changed Change color and text styles Add or hide a decimal point Spacing options between inputs Default screen positions Screen position inputs
How to use 1. Simply use the default settings; or 2. Choose to show pips or pipettes; 3. Choose to display symbol, text or decimal; 4. Choose where to place it on the screen; 5. Save settings or save
FREE

Welcome To Gold Hunt Real Account Trading Report: Click here The Gold Hunt EA is a unique, fully automatic trading program designed by a trader with 10 years of experience. It doesn't need any monitoring and is based on strategies used by hedge funds. This expert advisor relies entirely on mathematical algorithms to trade. It always aims to close trades in profit. The strategy was used manually for five years and has now been converted into this automatic trading system, which specializes in t
MetaTrader 마켓은 과거 데이터를 이용한 테스트 및 최적화를 위해 무료 데모 거래 로봇을 다운로드할 수 있는 유일한 스토어입니다.
어플리케이션의 개요와 다른 고객의 리뷰를 읽어보시고 터미널에 바로 다운로드하신 다음 구매 전 트레이딩 로봇을 테스트해보시기 바랍니다. 오직 MetaTrader 마켓에서만 무료로 애플리케이션을 테스트할 수 있습니다.
트레이딩 기회를 놓치고 있어요:
- 무료 트레이딩 앱
- 복사용 8,000 이상의 시그널
- 금융 시장 개척을 위한 경제 뉴스
등록
로그인
계정이 없으시면, 가입하십시오
MQL5.com 웹사이트에 로그인을 하기 위해 쿠키를 허용하십시오.
브라우저에서 필요한 설정을 활성화하시지 않으면, 로그인할 수 없습니다.