YouTubeにあるマーケットチュートリアルビデオをご覧ください
ロボットや指標を購入する
仮想ホスティングで
EAを実行
EAを実行
ロボットや指標を購入前にテストする
マーケットで収入を得る
販売のためにプロダクトをプレゼンテーションする方法
MetaTrader 5のための新しいテクニカル指標

Eabotpro Signal Is indicator can scan all time frame and guide you where is the trend going with take profit and stop loss , Tp1 , Tp2 , Tp3 , he give 90% which is very good , preffer to work for scalping tf1 and for swings T15 till 4H , Nice indicator no more loss on your pocket , Eabotpro Signal scan Tf1 minutes till 1Day , Trading is not game , trading is ART, patient ,vision , in the end its your money and if you lose it no one will give it to you back , be responsible , accept the low minim

Weis Wave Scouter Basic は、MetaTrader 5 用に設計された当社の有名なインジケーターの基本バージョンであり、Wyckoff 手法と VSA(ボリュームスプレッド分析)の概念を手軽かつ効率的に探求したいトレーダー向けに設計されています。ボリュームウェーブの読み取りに基づいており、市場の動きを明確に特定でき、リチャード・ワイコフが教えた「労力と結果」「需給」の原則に焦点を当てています。 Weis Wave Scouter Basic を使用すると、標準カラー(Classic)テーマの直感的なヒストグラムで上昇波と下降波を視覚化でき、トレンドや反転を簡単に解釈できます。Brick Size や Volume Scale Factor などの基本的な調整が可能で、ティックボリュームまたは実際のボリュームを選択できるため、FX、株式、暗号資産などさまざまな市場で柔軟に使用できます。初心者やシンプルなツールを求めるトレーダーに最適な Weis Wave Scouter Basic は、Wyckoff と VSA の技術を取引に活かすための理想的な出発点です。 We
FREE

ICT Order Flow Matrix MetaTrader 5向け自動機関投資家オーダーブロック検出
概要 本物の機関投資家のオーダーフロー洞察でチャートをレベルアップ。ICT Order Flow Matrixは価格変動をリアルタイムでスキャンし、銀行、ヘッジファンド、自社トレーディングデスクが大口注文を置くポイントを特定します。その後、これらの“Order Blocks”を動的なサポート&レジスタンスゾーンとしてチャートに自動描画します—手動描画は不要です。
主な機能 - **自動ゾーン検出** 需給の不均衡を瞬時に特定し、チャート上にシェーディングされたゾーンとして表示。 - **プロフェッショナルデスクのハイライト** 一般的な機関ゾーンとアクティブな自社デスクレベルを区別して表示。 - **ビジュアルマトリックスレイアウト** ゾーンを列ごとに整然と並べ、市場構造を一目で把握。
メリット - **明確性** – アクティブなICTゾーンのみを表示し、重要なレベルに集中可能。 - **精度** – 破線でブロック
FREE

SMCセッションインジケーターは 、ICTコンセプト、流動性ハント、 セッションベースの戦略 に頼る スマートマネートレーダー 向けに作られた高精度ツールです。機関投資家レベルのトレーダーが使用する最も実績のある人気のコンセプトを使用して、重要なセッションベースの取引ゾーンをシームレスにマッピングします。このオールインワンセッションインジケーターは、 ICTアジアレンジ、ロンドンブレイクアウト、ニューヨークレンジ、ICTロンドンオープンキルゾーン、ICTニューヨークオープンキルゾーン、オープニングレンジブレイクアウト(ORB) ( ロンドン、ニューヨーク、東京を カバー)、強力な ミッドナイトオープニングレンジ など、最も効果的で確率の高いレンジ戦略をチャートにオーバーレイします。また、 シドニー、東京、ロンドン、 ニューヨーク などの 主要な外国為替取引セッション も強調表示します。各レンジは 、タイムボックス手法を使用して最高の精度で描画され、 主要な FVG(フェアバリューギャップ)、レンジスイープ、セッションの高値/安値、 および潜在的な マーケットメーカーの操作ゾーン

Volume Thermal Visionでボリュームの力を体感 トレーディングを次のレベルへ引き上げる準備はできていますか?MetaTrader 5用の究極のボリュームインジケーター、Volume Thermal Visionを紹介します。ボリューム分析を戦略的優位に変えるこのインジケーターは、高確率のトレード機会を見極めたいトレーダー向けに開発され、VSA(Volume Spread Analysis)、ICT(Inner Circle Trader)、SMC(Smart Money Concepts)、Wyckoffなどの手法に最適です。EURUSD、GBPUSD、US30などの通貨ペア/インデックスの市場動向を解読するのに役立ちます。 なぜVolume Thermal Visionを選ぶのか? 高度なボリューム分析: 12段階のカラーレベルでボリュームの強弱を可視化し、蓄積、分配、機関トレーダーの動きを鮮明に捉えます。 独自のビジュアルプロトコル: Tactical、StealthMode、ThermalVision、NightVisionの4モードから選択可能。あなたのトレー

Chart Spotter – 究極のハイライト&アラートツール Chart Spotterを使って取引戦略の可能性を最大限に引き出しましょう!セッション、RSIレベル、ATRレベル、トレンドのリアルタイムハイライトと即時アラートを提供するオールインワンツールです。 主な機能 セッションのハイライト 重要な取引セッションを自動的にチャートにマークし、タイミングと市場分析を向上させます。 ビジュアル補助により、高アクティビティ期間に集中できます。 RSIアラート RSIが「買われすぎ」または「売られすぎ」のゾーンに入ったとき、リアルタイムアラートを提供。素早い対応が可能です。 RSI期間および閾値は完全にカスタマイズ可能です。 ATRレベル検出 ATRレベルがユーザー設定の上限または下限を超えた場合、即時通知を提供し、重要なモメンタム変化を特定します。 ATR期間と倍率を調整可能で、より正確な追跡が可能です。 トレンド検出 上昇トレンド(高値と安値が上昇)および下降トレンド(高値と安値が下降)をリアルタイム通知で識別します。 お客様の取引スタイルに合わせて期間をカスタマイズできます。 リ

ロンドンセッションブレイクアウト戦略インジケーター は 、ICT(Inner Circle Trader) と Smart Money Concepts(SMC) を実践するトレーダー向けに設計されており、ロンドンセッション中のセッションベースの 流動性ハンティング、キルゾーン、 マーケットメーカーの行動 に焦点を当てています。このツールは、 GMT 午前0時 から午前7時までの価格高値と安値(一般的に ロンドンキルゾーン または マーケットメーカーレンジ と呼ばれます)を捕捉します。トレーダーは、機関投資家の活動とボラティリティの急上昇が最も多い潜在的なブレイクアウトゾーンを特定するのに役立ちます。
このインジケーター は、セッションタイムボックス、価格レンジ、フェアバリューギャップ(FVG)、 ブレイクアウトレベル を、鮮明なグラフィックで視覚的に強調表示します。ロンドンセッションにおける主要な動きである 、流動性スイープ、レンジコンソリデーション、 そして 急激な価格上昇 の分析をサポートします。流動性ゾーンと市場構造の変化を反映することで、トレーダーは価格が上昇または反

Weis Wave Scouterは、MetaTrader 5向けに開発された革新的なインジケーターであり、WyckoffメソッドとVSA(Volume Spread Analysis)の確立された原則を組み合わせています。精度と深みを求めるトレーダー向けに設計され、累積ボリューム波の分析を通じて市場を戦略的に読み取り、トレンドの反転ポイントや継続ポイントを特定する支援を行います。
Weis Wave Scouterは、クラシック、ナイトビジョン、オーシャンブリーズといったカスタマイズ可能なカラーテーマで、上昇波と下降波を色分けしたヒストグラムで明瞭に表示します。主な機能には、ボリュームピークの検出、低アクティビティゾーン(DeadZone)の識別、およびボリュームベースの波の反転に関するカスタマイズ可能なアラートが含まれます。また、エフォート対リザルト分析、因果関係、需給バランスといったWyckoffおよびVSA理論の基本概念をサポートしています。Brick Size、Volume Scale Factor、Pivot Lookbackといったパラメータで柔軟に調整でき、あらゆるスタ

ニューヨークレンジインジケーターは 、ICT(インナーサークルトレーダー) コンセプト、スマートマネー取引、 機関投資家向けのプライスアクション手法 を適用するトレーダー向けに開発されたセッションベースの分析ツールです。ニューヨークセッション向けに特別に設計されたこのインジケーターは、 ロンドン終値 と ニューヨーク始値 に重なる重要な時間帯である、 GMT 12:00 から14:00の価格帯を捕捉します。 セッションの高値と安値 を特定し、 フェアバリューギャップ(FVG) を検出し、潜在的な 流動性スイープゾーンを 強調表示することで、トレーダーが マーケットメーカーの行動、セッションレンジのブレイク 、 リトレースメントの機会 を正確に分析するのに役立ちます。
この戦略は 、ニューヨーク・キルゾーン と ロンドン・ニューヨーク・セッションの 重なり合い 中に発生する 市場構造の変化 と 蓄積・分配パターン を理解することに重点を置いています。このインジケーターは 、構造のブレイク(BOS)、市場構造の変化(MSS)、変位キャンドル、不均衡ゾーン、 流動性ボイド といった

ICTロンドンオープンキルゾーンインジケーターは 、 ICT、SMC (スマートマネーコンセプト)、 流動性に基づく市場構造戦略 といった制度的コンセプトを実践する外国為替トレーダー向けに設計された、 スマートマネー ベースの取引ツールです。このインジケーターは、アジアセッションとロンドン市場のオープンの間の流動性フローの重複により、ボラティリティと価格変動が顕著になることで知られる、 GMT 午前6時 から午前8時までのロンドンオープンキルゾーンをハイライトします。
この時間帯は、マーケットメーカーが流動性ハンティングを行う高確率のセットアップの トリガーゾーン として機能することがよくあります。このインジケーターは キルゾーンレンジを自動的にマークし 、前セッションの高値と安値の スイープ 、特に アジアセッションレンジを 特定します。これらの流動性スイープは、多くのICTエントリーモデルの重要な要素です。このツールは、スイープ後に価格が プレミアムゾーン または ディスカウントゾーン に達したかどうかを分析するのに役立ち、 MSS(市場構造シフト)、 構造の崩

日本語 Smoothed Heiken Ashi by winwin – MetaTrader 5向けの次世代トレンドフィルター。市場のノイズをカットし、明確で実行可能なシグナルを提供します。スキャルパー、スイングトレーダー、偽の揺さぶりなしに価格の真の方向を把握したいすべてのトレーダーに最適です。 主な機能 ダブルEMAスムージング
OHLCデータに2段階の指数移動平均を適用し、そのスムーズ化された値からHeiken Ashiローソク足を生成。極めてクリーンでラグの少ないバーが、本物のトレンド転換を鮮明に映し出します。 ワンスライダー「SmoothingPeriod」コントロール
1つのパラメータで両方のEMA段階を同時に調整。H1、H4、D1など、あらゆる時間軸に最適なスムージング量を簡単に設定可能です。 カラ―コーディングの明快さ
緑色のローソク足は強気を、赤色のローソク足は弱気を直感的に表示。余計なラインや複雑なヒストグラムは一切ありません。 軽量&高速
純粋なMQL5コード&最小バッファ設計でチャートを重くせず、どのPCやVPSでもサクサク動作します。 ス

Kerberos – マーケットガーディアン
(ギリシャ神話に登場する伝説の三つ頭の犬にちなんで名付けられた。絶え間ない警戒、圧倒的な力、そして容赦ない精度の象徴。) コンセプト: Kerberos は、高精度で多層的なトレンドフォロー型インジケーターです。
量よりも質と安全性を重視するトレーダーのために設計されています。
3つの確立された分析手法を組み合わせ、最高のチャンスのみを厳選します — 完璧な瞬間だけに行動する守護者のように: EMA 50 および EMA 200 トレンド方向の確認 RSI (14) 過熱感(買われすぎ・売られすぎ)を判断 MACD モメンタムの変化を正確に捉える すべての条件が同時に満たされたときにのみ、Kerberos は明確なBUYまたはSELLシグナルを発します。 動作原理: 買いシグナル(緑色ラベル): EMA50 が EMA200 の上にある 上昇トレンド確認 RSI が70未満 市場はまだ買われすぎではない MACDラインがシグナルラインを下から上へクロス モメンタムが上昇方向へ転換 売りシグナル(赤色ラベル): EM
FREE

Welcome to the "Breakeven Line" indicator, version 1.1, developed by Sergei Ivanov in 2025. Visualize breakeven price levels for your trades with precision and ease. Advisor Description The "Breakeven Line" is a MetaTrader (MQL5) indicator that displays breakeven price levels for open buy and sell positions on the current symbol, factoring in commissions and swaps for accurate risk management. Key Features: Dual Lines: Plots Buy Breakeven (Dark Violet) and Sell Breakeven (Deep Pink) lines, show
FREE

Welcome. This tool is designed to help traders monitor the critical price level at which the account's margin level reaches 100%, providing valuable insights for risk management in trading. Advisor Description The "Margin Level 100%" indicator is a custom technical indicator for MetaTrader, designed to calculate and display the critical price level for a specific symbol where the account's equity equals its margin, resulting in a margin level of 100%. This level is crucial as it indicates the
FREE
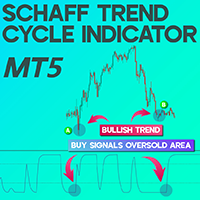
Schaff Trend Cycle Indicator for MetaTrader5
The Schaff Trend Cycle Indicator for MetaTrader5 is a momentum-based oscillator that helps detect potential reversal zones on the price chart. It is built using a hybrid model of the MACD (Moving Average Convergence Divergence) and the Stochastic Oscillator. This indicator marks readings below the 25 level as potential buying zones (oversold), while values above 75 suggest overbought conditions. The visual movement is depicted by a curved purple line
FREE
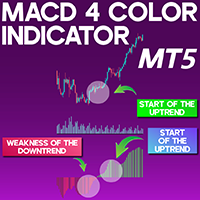
MACD 4 Color Indicator for MetaTrader 5
The MACD 4 Color Indicator for MetaTrader 5 (MACD 4C) is designed to provide a clearer visualization of market momentum and trend dynamics. As an enhanced variant of the traditional MACD, this tool incorporates four distinct color signals in the histogram, reflecting not only the direction of the trend but also its intensity. It helps traders interpret price behavior more accurately by analyzing the slope variations of the moving averages. «Indicator Inst
FREE
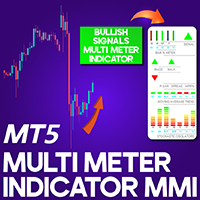
Multi Meter Indicator (MMI) for MetaTrader 5 The Multi Meter Indicator (MMI) is an advanced trend assessment tool designed for MetaTrader 5 (MT5) , integrating insights from nine built-in indicators to support traders' decision-making. Displayed compactly in the bottom-right corner of the trading chart, the MMI utilizes tools like the Parabolic SAR and Stochastic Oscillator (14-period) to provide quick visual guidance on market conditions. This indicator enables traders to gauge the prevailing t
FREE
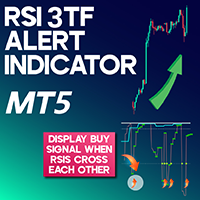
RSI 3TF Alert Indicator for MetaTrader 5 The RSI 3TF Alert Indicator for MetaTrader 5 (MT5) is designed around the RSI indicator utilizing a 2-period configuration. The RSI 3TFA integrates 3 distinct RSI indicators into a single chart view, making market analysis more streamlined for traders. When all 3 RSI indicators move above the 50 threshold, the RSI 3TFA generates a buy signal, and conversely, when they cross below the 50 level, it issues a sell signal. The yellow dots (blue in default conf
FREE

TrendWave Bands Indicator This is a trend-tracking tool, originally by BigBeluga on TradingView, designed to adjust automatically to current market movements using upper and lower dynamic bands. It uses color gradients to visualize the strength and persistence of a trend, and includes secondary wave bands to assist with deeper analysis. Main Features Smart Adaptive Bands In uptrends, a dynamic lower band is displayed, while in downtrends, an upper band appears. These serve as moving zones of

Ukeita Spike detector for All Gain and Pain Indices
--Ukeita Spike Detector is a trend-sensitive indicator specially designed for Gain and Pain Indices
— Gain and Pain synthetic indices are available 24/7 on Weltrade , similar to synthetic indices (Boom and Crash) offered by Deriv Broker .
This powerful tool helps detect incoming spike for Gain and Pain indices with high accuracy, making it a great addition to any strategy aimed at trading spikes profitably.
Features
1) Detects incomin
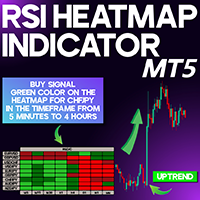
RSI Heatmap Indicator for MetaTrader5
The RSI Heatmap Indicator for MetaTrader5 is a powerful visual tool designed to measure the momentum of multiple currency pairs based on the Relative Strength Index (RSI). It detects and highlights overbought and oversold conditions across several timeframes and displays them in a heatmap located at the bottom left section of the chart. This visual representation helps traders quickly assess the overall market sentiment. Green tones signal potential buying
FREE
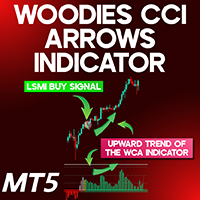
Woodies CCI Arrows Indicator for MetaTrader 5 The Woodies CCI Arrows Indicator for MetaTrader 5 (WCA) is a custom oscillator developed around the 14-period Commodity Channel Index (CCI). This tool combines inputs from multiple components including Turbo CCI, LSMA (Least Squares Moving Average), and EMA to generate actionable trading signals. When the CCI shows bullish momentum over six continuous bars, green histograms appear, and red bars emerge when bearish momentum is detected. A buy signal i
FREE

Let us introduce the Heikin Ashi RSI Oscillator! This indicator combines the concepts of Heikin Ashi candles with the RSI (Relative Strength Index) to produce an oscillator-like format that can be used to filter out some of the noise associated with standard RSI readings. This provides traders with a smoother representation of market conditions. Here are some articles to read more about the RSI and Heikin Ashi candles: https://www.investopedia.com/terms/r/rsi.asp https://www.investopedia.com/ter

The Bayesian Trend Indicator colors each candle according to a Bayesian‐inference of trend direction. It computes “prior” trend strength from four standard moving averages (EMA, SMA, DEMA, VWMA) of your chosen length, then computes a “likelihood” from faster versions of those same MAs (shortened by a “gap”). It combines them to produce a posterior probability of an uptrend. Candles are colored: Green when posterior indicates a strong uptrend. Red when posterior indicates a strong downtrend. Blue

The Candle Smoother is an indicator for MetaTrader 5 that helps you see price movements more calmly and clearly. It removes unnecessary "market noise" and displays the true trend more effectively.
What does the "Candle Smoother Indicator" do?
It smooths the classic candlestick data (Open, High, Low, Close). This filters out chaotic, hectic candles. Additionally, an EMA line (Exponential Moving Average) is calculated based on the smoothed prices. This helps you better recognize where the market

The Market Pulse is a versatile MT5 indicator that combines multiple market metrics into a single tool to display trend direction, momentum, volume flows and key price levels. Its goal is to give traders clear signals and visual aids for identifying entry and exit points.
Indicator overview
Dynamic Profit-Wave EMAs (fast, medium, slow) Buy and sell arrows Colored candles (bullish/bearish) Support and resistance lines Optional price channel Money Flow Index (MFI) with trend- and signal-dots
Ke

The Volatility Bands indicator or also known as "Concretum Bands" recreates the upper and lower bound of the Noise Area. The indicator helps you spot when price is making unusually large moves relative to recent “opening range” activity. It draws upper and lower bands around price, based on how much the market has moved in prior sessions. When price pushes beyond these bands—especially in combination with optional filters like an Exponential Moving Average (EMA) or Volume-Weighted Average Price
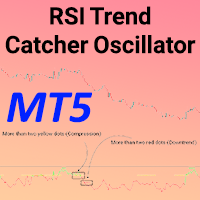
RSI Trend Catcher Oscillator for MetaTrader 5 The RSI Trend Catcher Oscillator for MetaTrader 5 offers a sophisticated enhancement to the classic Relative Strength Index (RSI), with added functionality to highlight trend shifts and represent movements using color-coded curves. When the oscillator remains above the 50% line, it typically signals an uptrend, while values below 50% indicate a prevailing downtrend. «Indicator Installation & User Guide» MT5 Indicator Installation | RSI Trend Catche
FREE
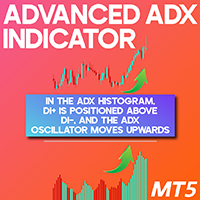
Advanced ADX Indicator for MetaTrader 5
The Advanced ADX Indicator for MetaTrader 5 serves as a dynamic histogram tool used to evaluate trend strength in price movement. Designed for use on the MT5 platform, this indicator oscillates between 0 and 100, with its standard configuration based on a 13-period calculation. Green-colored bars appear during upward trends, while red bars signify bearish movements. A rising ADX value denotes increasing momentum in the market tren «Indicator Installation
FREE

The Scara indicator helps to determine the current trend in the market using two levels of weighted average price (WAP). It visualizes trends using the color fill between the two lines and the position of the price relative to these lines.
Bullish trend: When the fill between the lines is green and the price is above the upper line, it signals a strong uptrend.
Bearish trend: When the fill between the lines is red and the price is below the lower line, it indicates bearish dominance in the ma

This MT5 indicator provides real-time updates of classic Renko charts. Renko charts focus on price movement, filtering out noise and highlighting trends. What are Renko candles? Renko charts display price movement using "bricks" of equal size, ignoring time. A new brick is drawn only when the price moves by a specified amount. They help visualize trends by removing time-based noise.
Parameters - BrickSizePoints (20): Renko brick size in points - HistoryDepthSec (3600): Historical data to ini
FREE

Fibonacci Trend Indicator for MT5 Unlock the power of Fibonacci analysis on your MetaTrader 5 charts!
Our Fibonacci Trend Indicator automatically plots dynamic support and resistance levels so you can spot trends, reversals, and breakout opportunities at a glance. Features & Advantages Automatic Fibonacci Levels
Instantly displays seven key Fibonacci retracement levels based on the highest and lowest prices from your chosen lookback period — no manual work required. Dynamic Trend Adaptatio
FREE
HedgingMonitor: Visual Control for Hedging Operations HedgingMonitor: Professional Order Visualization for MT5 HedgingMonitor is a professional indicator for MetaTrader 5 that displays detailed information about all your open and pending orders in an organized and customizable visual panel. Ideal for traders who use hedging strategies or manage multiple orders simultaneously. Key Features: Intuitive Visual Interface: View all your orders in a single panel, with color coding to quickly identify b
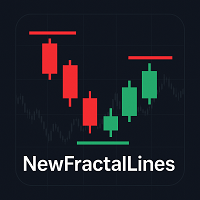
NewFractalLines — Fractal Level Indicator with Trend Lines NewFractalLines is an advanced indicator for MetaTrader 5 that automatically detects local price extremes (fractals) and displays them as horizontal trend lines on the chart. The lines are drawn precisely at the high and low of candles that qualify as a fractal based on N bars before and after. Purpose: Identify key support and resistance levels, visualize price turning points. Use case: Level trading, scalping, price action p
FREE
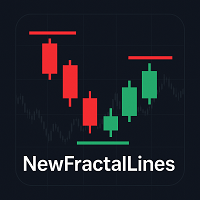
NewFractalLines — индикатор фрактальных уровней с трендовыми линиями NewFractalLines — это инновационный индикатор для терминала MetaTrader 5, который автоматически определяет локальные экстремумы (фракталы) и отображает их в виде горизонтальных линий на графике. Линии строятся строго по high и low свечей, соответствующих условиям фрактала (экстремум относительно N баров до и после). Назначение: помогает определить ключевые уровни поддержки и сопротивления, а также визуализировать рыночн
FREE

Realized Volatility Indicator Description The Realized Volatility Indicator measures the actual volatility observed in the market over a specified period.
Unlike implied volatility (which is based on options pricing), realized volatility is based directly on historical price movements, offering a pure and objective view of market turbulence. This indicator can be used to: Assess market conditions, Optimize risk management, Fine-tune trading strategies based on volatility behavior. Key Features
FREE
RTS5PatternBTCPrice is an analytical tool for MetaTrader 5 that systematically searches for historical similarities in price action and evaluates how the market behaved after similar situations.
The indicator provides both visual and statistical information that can be used to support trading decisions. It compares the current price pattern, defined by a selected number of candles, with historical data.
The similarity results are displayed using a histogram with three categories: Good Match –
FREE

CTJM Candle Timer Countdown displays the remaining time. It can be used for time management. Feature Highlights Tracks server time not local time Configurable Text Color and Font Size Optional Visualization of the Symbol Daily Variation Optimized to reduce CPU usage
Input Parameters Show Daily Variation: true/false Text Font Size Text Color
Feel free to use
FREE

# TickVolumeLines — visualize tick volumes as horizontal trend lines
## Overview **TickVolumeLines** displays tick volumes as horizontal trend lines on the chart. - **Green line** appears at the **Low** of a bullish candle. - **Red line** appears at the **High** of a bearish candle. The thickness of each line corresponds to the tick volume on that bar.
This helps identify high-volume bars visually and locate potential market interest zones.
## Features - Tick volume visualization
FREE

Candle Confirm Color
What Is It?
The Candle Pattern Confirmations is an advanced indicator for MetaTrader 5 (MT5) designed to identify and confirm candlestick patterns with high probability of trend reversal or continuation. It visually highlights candles that form Engulfing (Bullish/Bearish) and Inside Bars patterns, assisting traders in making more assertive decisions with real-time confirmation.
Main Features
Automatic Pattern Detection
- Detects Bullish Engulfing and Bearish Engulfin
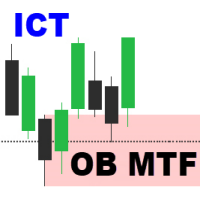
Order Block Multi Timeframe The Order Block Multi Timeframe is a powerful tool for Smart Money Concept (SMC) traders, combining high-accuracy Order Block detection with real-time Break of Structure (BOS) and Change of Character (CHoCH) analysis across multiple timeframes. Smart Money Insight, Multi-Timeframe Precision This indicator automatically identifies institutional Order Blocks —key price zones where large players have entered the market—and plots them directly on your chart. It also track

CHoCH & EQH/EQL: Market Structure and Liquidity Zones Indicator Overview: This versatile indicator is designed to help traders identify potential shifts in market structure and pinpoint key liquidity zones directly on their MetaTrader 5 charts. It automatically detects and visualizes two crucial price action concepts: Change of Character (CHoCH) for potential reversals, and Equal Highs/Lows (EQH/EQL) for significant support/resistance levels. Key Features: Change of Character (CHoCH) Detection:
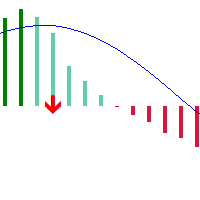
Based on the classic MACD indicator, this version introduces color concepts and adds golden/death cross arrow markers to represent MACD trend changes, helping investors make better decisions.
1. The MACD histogram bars display different colors when positioned above or below the zero line 2. When the MACD histogram is above the zero line and the current MACD value is greater than the previous value, it displays in dark color, indicating a continuing upward trend 3. When the MACD histogram is ab

# TickVolumeLines — визуализация тиковых объёмов через линии на графике ## Описание Индикатор **TickVolumeLines** отображает тиковые объёмы в виде горизонтальных линий на графике. - **Зелёная линия** — на уровне **Low** бычьей свечи. - **Красная линия** — на уровне **High** медвежьей свечи. Толщина линии зависит от величины тикового объёма на баре. Индикатор помогает быстро визуально определить всплески объёма и потенциальные уровни интереса участников рынка. ## Особенности - В
FREE

This is a Free Display Dashboard for The ArbitrageATR Recovery MT5 EA. This indicator is used to track existing Total hedge positions (Account Summary) , Balance, Equity, P/L and Symbols, Correlation Status. Please adjust size and colours according to your desired preference. Feel free to message me if there are any queries required. Please note that this an indicator and not a Utility or Expert Advisor.
LINK TO THE EA: https://www.mql5.com/en/market/product/131269?source=Site+Market+Product+
FREE
Indicador IMI (Intraday Momentum Index) Descrição O Indicador IMI (Intraday Momentum Index) é uma poderosa ferramenta de análise técnica desenvolvida para identificar a força do momentum e potenciais reversões no mercado. Este indicador quantifica a relação entre ganhos e perdas durante um período específico, ajudando traders a avaliar a dinâmica atual do mercado. Características Oscila entre 0 e 100, facilitando a interpretação das condições de mercado Identifica com precisão áreas de sobrecomp
FREE

Simple. Informative. Instantly Visible on Your Chart. Alwinson Active Trades Info is a lightweight custom indicator that displays a real-time summary of your currently open trades —right on your chart. No more switching tabs just to see what pairs are active and how much lot size is in play.
Alwinson Active Trades Info is also available for the MetaTrader 4 (MT4) version .
Key Features: Displays a list of all symbols with open positions in your trading account. Shows the dominant position ty

To get access to MT4 version please contact via private message. This is the exact conversion from TradingView: "3rd Wave" by " LonesomeTheBlue ". The screenshot shows similar results from tradingview and Metatrader when tested on ICMarkets on both platforms. This is medium-load processing indicator and updates are available per bar close. This is a non-repaint indicator. All input options are available. Buffers are available for processing in EAs. You can message in private chat for further cha

Percentage Range Consolidation O Percentage Range Consolidation é um indicador poderoso projetado para identificar zonas de consolidação de preço com base em variações percentuais ao longo do tempo. Ideal para traders que buscam detectar áreas de compressão de volatilidade e possíveis pontos de ruptura (breakout). Principais características: Identifica até 3 zonas de consolidação simultâneas, cada uma configurável de forma independente. Cálculo baseado na variação percentual entre a máxima e mín

Range Filter Buy and Sell O Range Filter Buy and Sell é um indicador técnico avançado que combina filtragem de movimentos de preço com geração de sinais claros de compra e venda.
Ele utiliza um sistema inteligente de suavização baseado em médias móveis exponenciais do range de preços, adaptado por um multiplicador configurável. Principais recursos:
Filtragem de tendências (Alta, Baixa ou Neutra) com cores distintas no gráfico:
• Tendência de alta (linha verde)
• Tendência de baixa (linha verm
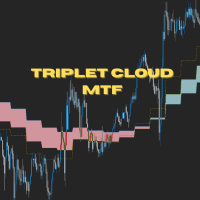
Triplet Cloud MTF is an indicator for trend-following strategy. It presents the trend in HTF from the LTF Chart that allows traders focus on looking for trade entry in the right direction and increase striking rate. It comes with simple input setup. You will only need to choose HTF you want to follow its trend and set the alert setup, then all is set. Here are the mostly selected HTF setup for each of entry timeframe: M1 Entry : M15 Trend M5 Entry : H1 Trend M15 Entry : H4 Trend H1 Entry

Daily Weekly Monthly High Low
Your Ultimate Tool for Precision Market Analysis Overview:
Elevate your trading strategy with Daily Weekly Monthly High Low , a sophisticated MQL5 indicator designed to pinpoint critical price levels across multiple timeframes. Seamlessly track daily, weekly, and monthly highs/lows to identify key support/resistance zones, optimize entries, and refine risk management—all in real-time. Key Features:
Dynamic High/Low Detection: Automatically identifies and
FREE
️ **Drawdown Tracker Pro** – Smart Risk Control for Prop Traders Many traers fail their prop firm challenge not because they’re bad but because they don’t track their equity drawdown clearly enough, in real-time. This tool fixes that. **Drawdown Tracker Pro** is an advanced MT5 indicator built for traders who need to stay within daily drawdown limits - especially during challenges with FTMO, MFF, or other funding programs. It helps you trade with discipline and avoid costly violations.

The Ultimate RSI indicator is a new oscillator based on the calculation of the Relative Strength Index that aims to put more emphasis on the trend, thus having a less noisy output. Opposite to the regular RSI, this oscillator is designed for a trend trading approach instead of a contrarian one. While returning the same information as a regular RSI, the Ultimate RSI puts more emphasis on trends, and as such can reach overbought/oversold levels faster as well as staying longer within these areas.

Trend Rider combines indicators such as Super Trend, RSI, and MACD. Its purpose is to assist in spotting and riding trends by displaying direction through color-coded candles and trailing stop levels. It can be employed independently or alongside other filters for enhanced decision-making.
The integration of these indicators aims to provide a clearer picture of market trends and facilitate better trading strategies. Super Trend helps identify the prevailing trend, RSI measures the market condi

Descubra o Pulse Flow, um indicador exclusivo desenvolvido para traders que buscam clareza visual e agilidade na leitura do mercado. Com uma abordagem inteligente e dinâmica, ele destaca zonas de transição de força e equilíbrio entre compradores e vendedores, revelando oportunidades com precisão.
Ideal para quem opera fluxo, price action ou deseja uma leitura limpa, objetiva e poderosa, o Pulse Flow se adapta a qualquer ativo ou tempo gráfico. Simples de usar, difícil de ignorar

Descubra o Wave Flow, um indicador exclusivo desenvolvido para traders que buscam clareza visual e agilidade na leitura do mercado. Com uma abordagem inteligente e dinâmica, ele destaca zonas de transição de força entre compradores e vendedores, revelando oportunidades com precisão.
Ideal para quem opera fluxo, price action ou deseja uma leitura limpa, objetiva e poderosa, o Wave Flow se adapta a qualquer ativo ou tempo gráfico. Simples de usar, difícil de ignorar
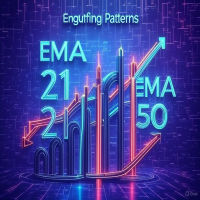
Engulfing with EMAs Indicator
Unlock the power of advanced candlestick pattern detection with the Engulfing with EMAs Indicator , a cutting-edge tool designed for MetaTrader 5. This futuristic indicator combines the precision of engulfing pattern analysis with the trend-following strength of Exponential Moving Averages (EMA 21 and EMA 50), empowering traders to identify high-probability setups across all currency pairs and timeframes. Key Features: Comprehensive Engulfing Detection : Detects b
Are you tired of those old, boring TP and SL lines cluttering your charts?
Struggling to showcase your trades in a way that actually grabs attention ?
Worry no more! Introducing the ultimate solution you’ve been waiting for... The TPSL Bounding Box PRO Indicator! PRO Version (With Risk to Rewards Ratio and more Modern Look Stats) | Free version here With just a simple setup, you can transform your plain trading signals into clear , professional-looking boxes that everyone can
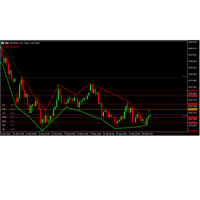
Advantages of the AutoTrendlinesMTF_WithRSI Indicator Multi-Timeframe Trendlines Automatically draws support/resistance trendlines on multiple timeframes (current, H1, H4). Adjustable lookback period ( LookbackBars ) and swing strength ( SwingStrength ) for customization. Daily Pivot Points Calculates and displays daily pivot levels (P, R1/S1, R2/S2, R3/S3) with customizable colors. Toggle visibility for each level individually. Auto Fibonacci Retracement Plots Fibonacci levels based on recent h

"Fire up your trading with Ak-47 Ultimate for MT5 — an elite SMA crossover indicator with real-time Buy/Sell signals, color-coded candles, and instant alerts. Lock onto trends and execute with military precision!" Colored candles (green for up, red for down), Two SMAs Buy/Sell arrows when crossovers happen, Text labels ("BUY"/"SELL") at the crossover points, Alerts triggered only once per signal .
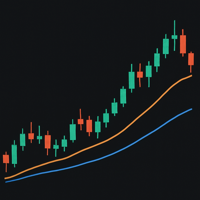
Overview : This indicator is a fully customizable Moving Average tool for MetaTrader 5, designed to help traders analyze trends with flexibility and precision. It supports multiple types of moving averages and applied prices, making it suitable for different trading styles and strategies.
Whether you’re a trend follower, swing trader, or scalper — this indicator can be tailored to fit your workflow.
Features : 4 Types of Moving Averages: Simple Moving Average (SMA) Exponential Moving Average

The SuperTrend Strategy is a widely-used technical indicator based on the Average True Range (ATR), primarily employed as a trailing stop tool to identify prevailing market trends. The indicator is designed for ease of use while providing reliable insights into the current market trend. It operates based on two key parameters: the period and the multiplier . By default, it uses a period of 10 for the ATR calculation and a multiplier of 3 . The Average True Range (ATR) plays a crucial role in the
FREE
Volume Thermal Vision Basicは、著名なVolume Thermal Visionインジケーターの簡易版であり、ボリュームの強度を実用的かつ効率的に分析したいトレーダーのために設計されています。6種類の鮮やかな色で構成され、StealthMode、NightVision、FrostVisionなどの表示モードを備えています。これにより、ボリュームデータを戦略的かつ視覚的に明確に把握することが可能です。初心者にとっても使いやすく、また上級トレーダーの補助分析ツールとしても最適です。MQL5 Marketで完全版にアップグレードすれば、さらなる機能と分析オプションが利用可能になり、トレード戦略の強化と意思決定の最適化に貢献します。
FREE

MonetTrend — Премиум-индикатор для торговли по тренду (M30, H1, H4)
MonetTrend — это мощный и визуально понятный трендовый индикатор, созданный для торговли на таймфреймах M30, H1 и H4. Он идеально подходит для работы с волатильными инструментами, такими как: • Золото (XAUUSD) • Криптовалюты (BTCUSD) • Валютные пары (EURUSD, USDJPY и др.)
Ключевые особенности MonetTrend: • Автоматическое отображение Take Profit 1 (TP1) и Stop Loss (SL): После появления сигнала индикатор сразу показывает: • TP

ゼロラグEMAインジケーター(AI最適化)——プロ仕様の取引ツール
従来の移動平均の遅延を排除した次世代ソリューション。AI最適化アルゴリズムで市場の動きをリアルタイムに捕捉し、先手を打ちます。 主な機能: AI高速処理 : 遅延ほぼゼロ。トレンド転換を瞬時に検出。 多市場対応 : 外国為替、株式、暗号資産、商品に最適。 クリアなトレンド表示 : ノイズを除去し重要なシグナルを強調。 早期シグナル : 通常のEMAより早く強気/弱気の動きを捕捉。 動的な色変化 : 緑/赤のカラーシフトで方向を即時認識。 カスタマイズ可能 : 期間と価格ソースを自由に設定。 マルチタイムフレーム : 1分足から月足まで対応。 柔軟な戦略設計 : RSI、MACD、フィボナッチと併用可能。 選ぶ理由: 実戦検証済みアルゴリズム : ライブ環境で信頼性を証明。 初心者からプロまで : 簡単操作で高精度な結果。 市場適応力 : あらゆる相場環境で有効。 対象ユーザー: 迅速なシグナル確認を求めるトレーダー。 遅延による損失を削減したい投資家。 テクニカル分析ツールのアップグレードを目指す方。 AIが切り開く
FREE
Haven CBDR は、ICTの「Central Bank Dealers Range(CBDR)」をチャート上に表示する、使いやすいインジケーターです。このプログラムは、CBDRの価格レンジを示す長方形を描画し、さらに標準偏差ラインを追加表示して、サポートとレジスタンスの可能性のある水準を確認できます。CBDRの時間帯、表示するカレンダー日数、色、グラフィック要素のスタイルなどを自由に設定でき、チャートのテーマに合わせて配色も自動調整されます。また、日足ローソクの始値を示す垂直線も描画し、市場の動きを把握しやすくします。 その他の製品 -> こちら トレーダーの使い方: パラメータ設定:
必要に応じて、セッションの開始・終了時間を調整し、表示設定(色、長方形の枠線スタイル、標準偏差ライン、マーカーなど)をカスタマイズします。 レンジ分析:
表示された長方形を活用して、選択した期間内のCBDR価格帯を素早く視覚的に確認できます。標準偏差ラインによって、反転やトレンド継続の可能性のあるレベルを特定できます。 トレードシグナルの探索:
日足ローソクの始値を示す垂直線と、セッション
FREE

Crystal Volume Indicator – MT5のためのスマートなボリューム分析ツール Crystal Volumeは、価格の動きの背後にある隠れた市場の強さを視覚的に解釈するために設計された、先進的で使いやすいボリューム分析インジケーターです。価格アクションとボリュームのダイナミクスを組み合わせて、 Buying Climax(買いのクライマックス) 、 Selling Climax(売りのクライマックス) 、 弱いローソク足 などの重要なイベントを強調表示し、反転や継続の可能性があるゾーンを簡単に見つけられるようにします。 主な機能: 実際のボリューム分析(ティックまたはリアルボリュームに対応) カラー付きヒストグラム 買い・売りのクライマックス検出 弱いローソク足をハイライト トレンド確認用の移動平均ライン カスタムルックバックウィンドウ ローソク足方向によるカラー設定オプション ボリュームイベントの分類: 買いのクライマックス:非常に高いボリューム、高値でクローズ 売りのクライマックス:非常に高いボリューム、
FREE
「この秘密のトレーディングツールはプロップ会社によって禁止されている(彼らはあなたに知られたくない!)」
EAなしで究極のトレーディング・エッジを発見!(トレーダーのために、トレーダーによって作られました。 ロボットではなく、純粋なトレーディング・パワーです。)
偽のブレイクアウト、突然の反転、市場操作に苦戦していませんか?この強力なトレーディングツールは、マーケットが速く動くときでも、レーザー精度のシグナルを提供します! --------------------------------------------------------------------------------------------------- 私のおすすめ:- 最高の電波強度設定 FXペア、金、指数、暗号通貨など、あらゆる種類のシグナルに対応。 ご希望のTFを選択し、バックテスト前に入力タブからシグナル値を変更してください。 >> ( 4または5 ) >> 1m / 5m / 15m / 30m / 1H / 4H の場合 >> (2または3) >>日足/週足/月足用 -----------------

シンプル、直接的、そして効率的 — それが Bars Trend and Pivot Support の真髄です。
このシステムを使用すると、グラフ上での分析を容易にする直感的なツールを利用できます。選択した期間に基づいて重要なサポートとレジスタンスを自動的にマークし、ピボット ラインを強調表示します。これらはすべて、ユーザーの好みに応じて有効化および無効化のオプションを備えています。
ダッシュボードには、D1、H4、H1、M30 の時間枠でのローソク足の方向も明確に表示され、さまざまな取引アプローチに不可欠な戦略的洞察が提供されます。
さらに、システムは現在のスプレッドと次のローソク足の形成までの残り時間を実用的な方法でチャートに統合して通知します。
私のメインインジケーター「ブルートフォーストレンド」と一緒に使用してください: https://www.mql5.com/en/market/product/132647?source=Site +Market+My+Products+Page
FREE
MetaTraderマーケットは、他に類のない自動売買ロボットやテクニカル指標の販売場所です。
MQL5.community ユーザーメモを読んで、取引シグナルのコピー、フリーランサーによるカスタムアプリの開発、支払いシステムを経由した自動支払い、MQL5Cloud Networkなど、当社がトレーダーに対して提供するユニークなサービスについて詳しくご覧ください。
取引の機会を逃しています。
- 無料取引アプリ
- 8千を超えるシグナルをコピー
- 金融ニュースで金融マーケットを探索
新規登録
ログイン