YouTubeにあるマーケットチュートリアルビデオをご覧ください
ロボットや指標を購入する
仮想ホスティングで
EAを実行
EAを実行
ロボットや指標を購入前にテストする
マーケットで収入を得る
販売のためにプロダクトをプレゼンテーションする方法
MetaTrader 5のための新しいテクニカル指標 - 19

Switch Tray is a shortcut tray tool for commonly used trading pairs provided to traders. It can be placed at the bottom of the chart, and commonly used trading pairs can be set by themselves. 1. You can set the shortcut switch button for your commonly used trading pairs. The default is [EURUSD/GBPUSD/XAUUSD/USDJPY/USDCHF/USDCNH]. / slash is the separator. 2. The button of each trading pair is also equipped with the number of open positions of a certain trading pair. 3. Multi-cycle quick switchi
FREE

Unlock the Power of Market Analysis with Precision Are you ready to take your trading to the next level? The "Institutional Volume Profile" indicator is here to empower your trading decisions like never before. Key Features: Custom Volume Profiles : Plot volume profiles effortlessly by simply adding horizontal lines or Fibonacci tools on your MetaTrader 5 chart. There's no limit to how many profiles you can create. Insightful Visualization : The indicator beautifully displays crucial information

This indicator is great for trading many different pairs. The indicator itself uses mathematical models of augmented accuracy, but for now they are optimized for some currency pairs. Many settings can be configured in the initial settings. There are many icons for visualization. He displays his solution on a graph using various icons. There are several types of icons. In the tester it works fine by default in the settings. It is already configured by default. Happy bidding.

The Session Volume Profile indicator displays the distribution of trade volume across price levels for a specific trading session. It visualizes areas of high and low trading activity, helping traders identify support and resistance zones. The profile's peak, known as the Point of Control (POC), represents the price with the highest traded volume.
The inputs of the indicator:
volumeBars(Row Size) : Determines the number of price bins or rows for the volume profile. A larger number results in

This MT5 chart trend checker cuts through the noise of market volatility to provide a clearer picture of trends and price movements. It includes the following features that can provide more clarity during market assessments: 1 customizable multi-period moving average Optional Heikin-Ashi candles 3 switchable focus modes Distinct colors for easy analysis
Link to MT4 version: https://www.mql5.com/en/market/product/106708/
This indicator shows your preferred moving average from multiple time fr
FREE

Introducing Candle Feeling Indicator for MetaTrader 5 - Your Ultimate Solution for Accurate and Timely Analysis! Built with more than two decades of programming experience, this indicator allows you to follow the complexities of financial markets with confidence and accuracy.
Key Features: High Precision: Identifies trend reversals with unparalleled accuracy, ensuring you stay ahead of market shifts. Analysis: All the information you need from the structure of a candle Beautiful appearance

Property of Vertical Capital Edition: Gugol_Quants About USA INDEXES QUANT_INDICATOR: This is a indicator created by math modulation to be used as a trading tool, which was developed in MQL. (MT5) This indicator is for use only with US500(S&P500), NAS100(Nasdaq Composite) and US30(Dow Jones). Signals are activated on "Open" Candle. It’s based on Intraday/Swing Trades whose main timeframe is H1, H2, H3 and H4. However you can use it with other assets by testing with the appropriate settings. *
FREE

This Indicator works as a momentum oscillator however it is most used to surf the trends. Despite of being an oscillator, MACD (Moving Average Convergence/Divergence) doesn't work with over limit conditions (such as OverBought or OverSold). Graphically it's shown as two lines and an histogram with the diference of them. Standard metatrader has this indicator, however with only the two lines and without the histogram. This way it is much easier to read and uderstand it.
FREE

The "Alligator" indicator is a powerful technical analysis tool designed to assist traders on the MetaTrader 5 (MT5) platform in identifying market trends and potential price reversal points. This indicator is based on a concept developed by Bill Williams, a renowned technical analyst in the world of trading. How the Indicator Works: The Alligator indicator operates by using three Moving Average (MA) lines with different periods. These three lines are: Jaws: This is a Moving Average line with a

The Trendline Automatic indicator is an advanced technical analysis tool specifically designed to assist traders in identifying critical levels in the financial markets through the automatic drawing of support and resistance trendlines on price charts. With its automatic capabilities, this indicator saves traders time and effort in analyzing price movements, allowing them to focus on making better trading decisions. Key Features : Automatic Drawing of Trendlines : This indicator allows traders t

The bullet indicator gives accurate direction of the market structure, it will indicate to you the exact direction whether it be the market is in a downtrend or if it's in an uptrend it will give you that information which will inturn benefits you by saving you the time it takes to analyse that structure, this indicator works on a timeframes and it's most favourable on higher timeframes.
How it works: -The green arrow will be at the support of the structure indicating buys -The red arrow will
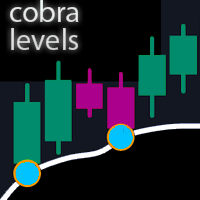
コブラレベル
これらは、外国為替、暗号通貨、コモディティ、ニフティ、バンクニフティを含むユニバーサル市場で機能する 2 つの周波数モードを備えた 6 セットのレベルです。 これらは金融商品に関する最良の調査を経て出版されています。
上位レベルを U1 ~ U5 と呼び、下位レベルを D1 ~ D5 と呼びます。
市場は、通常の状態では U3 または D3 までの内部チャネル、または不安定な状態では外部チャネル U4 から U5 または D4 から D5 のいずれかでドライブする可能性があります。 価格が U3 U4 U5 または D3 D4 D5 に達すると、反転の可能性が非常に高くなります。トレーダーはローソク足の終値を待ってエントリーを確認し、有効なリスク管理を行って取引する必要があります。
このインジケーターでは、インジケーター設定のカスタマイズオプションによってレベルをシフトできます。 ユーザーは + または - ポイントを追加してレベルをカスタマイズできます
1. タイムフレーム: M1、M3、M5、M15、H1、H4 のみで作業しています。

Channel Universal knows how to correctly build a forex channel and forms a classic trading strategy, it is easy to execute, therefore it is accessible even to beginners. Price channels work equally well on any trading assets and timeframes, they can be used both independently and with additional confirmation from oscillators and market volumes.
If you look at the price and try to identify the simplest visual patterns, you will immediately see that the price almost never moves in a straight

The Target Go indicator tracks the market trend, ignoring sharp market fluctuations and noise around the average price. Catches the trend and shows favorable moments for entering the market with arrows. The indicator can be used both for pips on small periods and for long-term trading. The indicator implements a type of technical analysis based on the idea that the market is cyclical in nature.

The Trend Sikorsky indicator contains an entire trading system, processes information from several technical instruments and the appearance of its signals is the final result of the calculation. The indicator itself evaluates how strong a signal appears in the market and when to change direction, signals this, and the trader can only make a trading decision. This indicator works on all timeframes. You need to understand that any indicator is only a visual form of a signal. Currency pairs never

The Risk Trend indicator simplifies the decision-making process by recognizing reversals using a built-in algorithm and then confirming signals at support/resistance levels. Implements a type of technical analysis based on the idea that the market is cyclical in nature.
Thus, the indicator tracks the market trend with great reliability, ignoring sharp market fluctuations and noise around the average price. The indicator can be used both for pips on small periods and for long-term trading.

The Hrum indicator was created to neutralize temporary pauses and rollbacks. It analyzes price behavior and, if there is a temporary weakness in the trend, you can notice this from the indicator readings, as in the case of a pronounced change in trend direction. Entering the market is not difficult, but staying in it is much more difficult. With the Giordano Bruno indicator and its unique trend line, staying on trend will become much easier!
Every rise and every fall is reflected in your emot

Point and Plot: The Anchored VWAP with Channel Bands tool is designed for traders of all levels, from beginners to seasoned professionals. Point to the price level you want to anchor to, plot the horizontal line, and watch as this versatile tool transforms your trading approach. User-Friendly Interface : Navigate the tool effortlessly with a user-friendly interface that ensures you never miss a crucial detail. Real-Time Analysis : Make informed decisions in real time with dynamic data that upda

The Sinas indicator for Forex can be used both for pips on short periods and for long-term trading. It tracks the market trend, ignoring sharp market fluctuations and noise around the average price. Catches the trend and shows favorable moments for entering the market with arrows. The indicator implements a type of technical analysis based on the idea that the market is cyclical in nature.

Adiciona marca d'água com nome do ativo em negociação. Pode ser ajustado definindo tamanho da fonte e coloração do texto. Testado com vários ativos do mercado B3 e Forex Adione ao gráfico e configure de acordo com a necessidade. Caso tenha problemas sinta-se a-vontade para nos avisar e providenciaremos a correção logo que possível. ______________________________
FREE
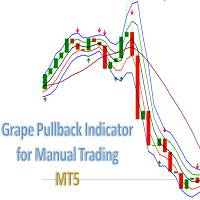
Indicador Grape Pullback for Manual Trading. Indicator (arrow) Type Strategy (Pullback) for all Symbols and Periodicity, Preferably from 30M periodicity. Can be used for manual trading. The indicator i s determined by strategies that is based on criteria for the location of candlesticks in the channel and for the Rsi and Market facilitation index indicators. Its workspace corresponds to channel of 3 bars of Bill Willians with a channel extension . BUY when there is a Green Arrow. StopLoss below

Let me introduce our ProfitPlotter indicator
We are developing a technical indicator best suited for analyzing trading performance. It can display statistics of all currency pairs and trades of different magic numbers categorized on the same chart. You can specify the time range, magic number, specific currency pairs or profit statistic curves of all currency pairs for analysis. You can also click to jump to order positions and view order details, which greatly improves the usage experience. Ma

Visual guide which divides the 24 hours into three trading sessions. The default setting is to show Asian , London and New York sessions. But, the session start and end hours can be adjusted as required.
The indicator is useful to develop trading strategies by making it easy to see the market behavior during the three sessions.
Inputs Time Zone Start and End hours (Please provide values in HH:MM format, like 02:00, not like 2:00. Both the hours and minutes should have 2 digits) Time zone
Camarilla Pivot Points is a math-based price action analysis tool that generates potential intraday support and resistance levels. Pivot price values are stored in output buffers within this indicator, enabling any Expert Advisor to utilize this indicator's data for trading purposes. This indicator offers the potential for developing numerous strategies. To explore some of these strategies, please visit the following websites: https://www.babypips.com/forexpedia/camarilla-pivot-points https:

This indicator is designed based on the Moving Origin indicator
When the moving origin indicator breaks the price, this indicator gives a signal
It is useful for better viewing of signals and analysis on them
Attributes: Can be used in all symbols Can be used in all time frames Too many signals Simple and quick settings Easy way to work
Settings: period: like moving average settings alarmShow: If you want to receive an alert in Metatrader after receiving the signal, enable this setting
a
FREE

Hi All ! I want to share with you my favorite indicator to identify strong trend bias. It helps me a lot with my entries and exits. You can use it on any market and any instrument. It works best on daily tiimeframe 1D but you can also use it on 1H and be carefull with lower timeframes This indicator uses MACD, RSI and Stoch. The idea is simple, when MACD crosses above a Signal line and RSI > 50 and Stoch > 50 we consider the trend is going UP on the opposite we consider its DOWN Feel free to us
FREE
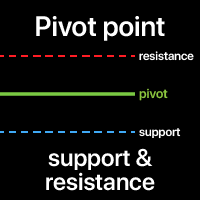
A Pivot point is used to determine the overall market trend. The pivot level itself is the average of the high and low, and the closing price from the previous bar.
On the next bar trading above the pivot point is thought to indicate ongoing bullish sentiment, while trading below the pivot point indicates bearish sentiment.
The pivot point is the basis for the indicator, but it also includes other support and resistance levels that are projected based on the pivot point. All these levels h
Correlation value between two Symbols. A value of +1 means a complete positive correlation; A value of -1 means a complete inverse correlation; A value of 0 means there is no explicit correlation (prices do not depend on each other, or the correlation is random); My #1 Utility : includes 65+ functions | Contact me if you have any questions In the settings of the indicator, you can configure: Symbols (currency pairs) to be used in calculations.
Leave one value empty if you want one of the
Simple alert system which will alert you on your mobile terminal, email and on the chart whenever RSI crosses below the overbought level or above the oversold level. Use this alert system, so you don’t have to watch the chart all day for the RSI levels to break.
INPUTS: 1. RSI Period- (Default is 14). Number of candles the RSI indicator will look back for the calculations. 2. OB Level- (Default is 70). This is the Overbought level or Upper level for the RSI indicator. 3.

まず第一に、この取引ツールはノンリペイント、ノンリドロー、ノンラグの指標であり、プロの取引に理想的ですことを強調する価値があります。
オンラインコース、ユーザーマニュアル、デモ。 スマートプライスアクションコンセプトインジケーターは、新米から経験豊富なトレーダーまで、非常
に強力なツールです。Inner Circle Trader AnalysisやSmart Money Concepts Trading Strategiesなど、20以上の有用な指標を1つに組み合わせています。このインジケーターはスマートマネーコンセプトに焦点を当て、大手機関の取引方法を提供し、彼らの動きを予測するのに役立ちます。
特に、流動性分析に優れており、機関がどのように取引しているかを理解しやすくしています。市場のトレンドを予測し、価格の動きを慎重に分析するのに優れています。機関の戦略とトレードを合わせることで、市場の動向についてより正確な予測ができます。このインジケーターは多目的であり、市場構造を分析し、重要な注文ブロックを特定し、さまざまなパターンを認識するのに優れています。
このインジ

究極の反転取引戦略を発見してください!
あらゆる取引セッションで反転を識別する技術を解き放つ強力なインジケーターを紹介します。推測に別れを告げて、精度にこんにちは!
当社のインジケーターはバイサイド流動性 (BSL) とセルサイド流動性 (SSL) の両方を綿密にマッピングし、情報に基づいてエグジットの意思決定を行うための知識を提供します。
しかし、それだけではありません。この戦略では、単一のアプローチに限定されません。また、BSL と SSL の流動性を活用してロンドンのブレイクアウトを利用することもでき、多用途性とさらに大きな利益の可能性を提供します。
**これが例です:**
価格がバイサイドの流動性から上昇し、自信を持ってエントリーレベルを超えたときを想像してみてください。これは、取引に参加し、単純かつ強力な戦略であるセルサイド流動性に照準を合わせる合図です。
**この戦略を選択する理由**
1. **実証済みの収益性:** この戦略は時の試練に耐え、一貫した収益性の実績に裏付けられています。一

//--- input parameters input int InpFastEMA = 12; // Fast EMA period input int InpSlowEMA = 26; // Slow EMA period input int InpSignalSMA = 9; // Signal SMA period input ENUM_APPLIED_PRICE InpAppliedPrice = PRICE_CLOSE; // Applied price
伝統的なMACDとMQLプラットフォームを結集した2種類の指標結合バージョンは、市場動向を効率的に分析し、より効果的で、より簡潔で、より直感的に分析することができる。 ご購入とご利用に感謝します。より良いアドバイスがありましたら、コメントエリアにコメントしてください。私は最初に返事をします。ここであなたが市場で十分なお金を稼いだことをお祝いします。

//--- input parameters input ENUM_TIMEFRAMES InpPeriod = PERIOD_D1; // Period input int InpBandsShift = 15; // Shift
アイコンに他の任意の周期のろうそく図の終線を表示する指標で、市場の動きを効率的に分析することができ、より効果的で、より簡潔で、より直感的である。 ご購入とご利用に感謝します。より良いアドバイスがありましたら、コメントエリアにコメントしてください。私は最初に返事をします。ここであなたが市場で十分なお金を稼いだことをお祝いします。
アイコンに他の任意の周期のろうそく図の終線を表示する指標で、市場の動きを効率的に分析することができ、より効果的で、より簡潔で、より直感的である。 ご購入とご利用に感謝します。より良いアドバイスがありましたら、コメントエリアにコメントしてください。私は最初に返事をします。ここであなたが市場で十分なお金を稼いだことをお祝いします。

This indicator automatically identifies demand and supply zones on a number of 1000 candles or more, and you can change that number of settings.
It also carries a high level of accuracy in describing the type of each zone, as it contains:
Weak areas .
Untested areas . Strong areas . Role-taking areas . Areas tested + number of times visited . Areas to which a return is expected, depending on the direction . The indicator contains alert zones.
For signals and more free indicators, you ca
FREE

Introduction to the Candle Time Indicator The Candle Time Indicator for MetaTrader 5 (MT5), helps users know how much time on a candlestick is remaining. This is a simple but incredibly powerful and useful tool. To download the Dagangduit CandleTimer.ex5 indicator, check the bottom of this post. It’s one of the best forex time indicators in its category. The function of the indicator will not change, even if you change the name of the indicator. The candlestick countdown timer will tell you how
FREE

Indicator can be used for dxy correlation trading. it calculates the dollar index (USDX or DXY) using the EUR/USD, USD/JPY, GBP/USD, USD/CAD, USD/CHF and USD/SEK currency pairs. In order to trade them, you need to find a confirmed technical analysis pattern on the DXY chart and look for a correlated currency pair that has the same picture on its price chart.
The formula used for calculation is the following: USDX = 50.14348112 × EURUSD -0.576 × USDJPY 0.136 × GBPUSD -0.119 × USDCAD 0.09

Let us introduce you to a new era of neural indicators for financial markets! Intelligent Moving is a unique indicator that trains its neural network in real time! You no longer need to look for the optimal indicator parameters for each specific situation. No more late signals. The artificial intelligence is able to adapt itself and predict any market movements.
Visually, the indicator is drawn as a main solid moving average line, two dotted lines of standard deviations and signal arrows. For
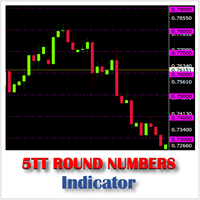
Like Support and Resistance levels, Round Numbers refer to price levels ending in one or more zeros, such as 125.00, 1.0350, 0.8750, 74.50, etc. These are psychological levels where financial institutions and traders expect price to either stall, retrace or breakthrough. On a price chart these figures are generally considered to rule off levels at the 50 and 100 mark. 5TT Round Numbers Indicator makes it absolutely easy for the trader to identify these levels on the chart without the laborious a

The QQE indicator is a momentum-based indicator used to identify trends and sideways. The Qualitative Quantitative Estimate (QQE) indicator works like a smoothed version of the popular Relative Strength Index (RSI) indicator. QQE extends the RSI by adding two volatility-based trailing stops. This indicator is converted Qfrom Trading View QQE MOD by Mihkel00 to be used in MT5 Version.

About the Proinsta78MT5 Indicator
The dots show a strong direction of movement, if there are no dots, then the movement changes or there will be a trading corridor with an exit. The profit depends on the timeframe, the larger it is, the more you can earn on the movement. I close on average after every 150-200 points.
I have shown the conditions for the signal in the form of screenshots in the screenshots 1-2photo section. Also in the third photo, the signals are visible and marked on the gr

Best Pivot Point Indicator display pivot points and support and resistance lines for the intraday trading. It calculates them using its own formula based on the previous trading session The indicator can display the following levels in addition to plain pivot points: Previous session's High and Low, today's Open. Sweet spots. Fibonacci levels. Camarilla pivots. Midpoint pivots.
FREE

KT Supply and Demand indicator identifies and plots key supply and demand zones. It achieves this by analyzing swing points and integrating them with a multi-timeframe analysis, ensuring that only the most crucial supply-demand zones are highlighted. This advanced method highlights the regions where prices are likely to reverse, stemming from significant supply-demand zones established by recent price movements.
Features
Precision Analysis: Our refined algorithm is designed to accurately pi

The Jackson Auto Candlestick Pattern . It a powerful price action tool which auto detect and alert a hided powerful candlestick patterns . It came with few different chart skins. You can use this indicator alone to make profit, but it powerful when you combine it with trendlines, You can download The Jackson Auto Trendlines for free Link : UCRW695l9Wgg2ucnnf5DL5Vw List of Candlestick Pattern it detect 1. Bullish & Bearish Engulfing's 2. Top and Bottom Tweezer 3. Bullish and Bearish Harams 4.
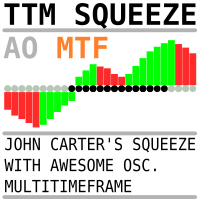
The same indicator as here Скачайте Технический индикатор 'John Carters TTM Squeeze with MACD Multitimeframe' для MetaTrader 5 в магазине MetaTrader Market (mql5.com) , but instead of MACD, Bill Williams' AO (Awesome Oscillator) is used. It goes well with a sleeping Alligator to determine periods of "compression-calm", which may be followed by significant movement.
It is useful to use an indicator from a higher timeframe (coefficient 5 or 6) to determine the possible direction of a breakout.

Enhance your trading strategy and optimize your market entries with the Power MA Rectifier Indicator, now available for sale on the MetaTrader 5 (MT5) Market platform. This innovative indicator combines the power of Moving Averages (MA) with a rectification algorithm, providing traders with valuable insights to make informed trading decisions. Key Features: Moving Averages Integration : The Power MA Rectifier Indicator leverages Moving Averages to analyze market trends, helping traders identify

Daily Monitoring : The indicator automatically calculates and displays the daily drawdown on your trading chart, allowing you to see how well you're performing on a daily basis. Risk Management : By monitoring daily drawdown, traders can better manage their risk. It helps to keep daily losses within acceptable limits. Real-Time Information : Daily drawdown is updated in real-time, providing accurate and up-to-date information about your trading performance. How to Use: Activate the "Daily Drawd
FREE

The "Dagangduit Spread Indicator" is a versatile tool designed to provide traders with essential information about the current spread in the chart window. This indicator offers customizable features, including font parameters, display location on the chart, spread normalization, and alerts to enhance your trading experience. Key Features: Real-time Spread Display : The indicator displays the current spread in real-time on your trading chart, allowing you to stay informed about the cost of execut
FREE

This indicator Displays current spread in the main window of the chart. You can modify the font parameters, indicator's position and the normalization of the spread value. The spread is redrawn after each tick, ensuring the most current and active spread value. This can be useful for brokers with variable spreads or with spreads that are widened often. You can also enable a spread label to be shown near the current Bid line. you can also set alert : Email, and push notifications.

This indicator is based on the MACD indicator
Also, some candlestick patterns are used in it to identify better signals
Can be used in all symbols
Can be used in all time frames
Easy to use method
Adequate settings
Settings: period: The number of candles used to calculate signals. pFast: Like the MACD indicator settings pSlow: Like the MACD indicator settings
alarmShow: If you want to receive an alert in Metatrader after receiving the signal, enable this setting alarmShowNoti: If you
FREE

Introducing Moon Spiker – Your Lunar Gateway to Precision Trading on MetaTrader 5! Elevate your trading experience to astronomical heights with Moon Spiker, a cutting-edge indicator designed to harness the celestial powers for precise analysis and decision-making. Say hello to an innovative tool that will send your trading strategy rocketing to the next level! Designed exclusively for MetaTrader 5, Moon Spiker is meticulously crafted to cater to the discerning trader focused on the 1-hou

The SuperTrend indicator is a popular technical analysis tool used by traders and investors to identify trends in the price of a financial instrument, such as a stock, currency pair, or commodity. It is primarily used in chart analysis to help traders make decisions about entering or exiting positions in the market. this version of super trend indicator is exactly converted from trading view to be used in MT5

Support And Resistance indicator that can display round levels and zones . It shows them directly on the chart, providing an easy help when you want to set stop-loss or take-profit level, or when you want to see the next market target. If an asset price is moving down and bounces back up, the level is called support (think: price floor). If an asset price is moving upward and hits a level where it reverses downward, this is called resistance (think: price ceiling).

An indicator based on candlestick patterns
To catch short-term and long-term trends
If it gives a signal in the direction of the trend, it is long term
And if it gives a signal in the opposite direction of the trend, it is short term
Too many signals
Can be used in all symbols
Can be used in all time frames
Attributes: Too many signals Can be used in all symbols Can be used in all time frames Simple settings Simple and fast usage With author lifetime support
Settings: Candle back: Th
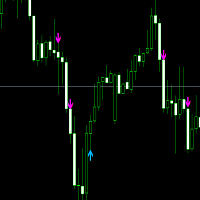
This offer is limited to a temporary period. Entry signal :follow the blue arrow for a buy trade and the Pink for a sell. Buy Trade: When the blue arrow appears, you wait until the candle completely finishes. Then you enter into a Buy Trade as soon as the next candle appears. Now wait until you hit TP1 from the Buy Goals box, then close the trade with a profit. Sell Trade: When the Pink arrow appears, you wait until the candle completely finishes Then you enter into a Buy Trade as soon as the n

Inverted Price Action est un outil financier qui reflète graphiquement les mouvements des prix comme s'ils étaient inversés, ce qui peut aider les traders et les investisseurs à avoir une perspective différente sur les tendances et les mouvements du marché.
Lorsque la souris est positionnée sur l'indicateur, il réagit en modifiant sa couleur pour correspondre à celle du graphique principal, tandis que le graphique sous-jacent est assombri. Cette fonctionnalité peut aider les utilisateurs à se

Cet indicateur technique affiche la tendance du marché ainsi que les niveaux de support et de résistance tracés aux points extrêmes de l'indicateur ZigZag standard. Il classe les formes à cinq points en fonction de l'ordre des points de haut en bas.
Le motif dynamique est basé sur les quatre premiers zigzags droits. Dans cet indicateur, tous les motifs sont considérés comme dynamiques. Pour respecter cette condition, le concept de mutation du marché a été artificiellement introduit et l'algor
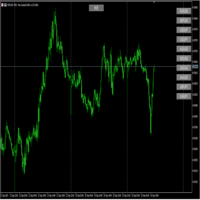
The Symbol Changer Indicator is a powerful tool designed to enhance your trading experience by providing quick access to switch between different financial Instruments on your MetaTrader 5 platform. Quickly switch symbols and Show/Hide Buttons. A clean and intuitive graphical interface ensures that traders of all experience levels can use this indicator with ease.
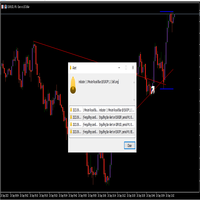
Swing trading is a method in which traders attempt to take advantage of market fluctuations. They buy a security when they believe the market will rise and sell if they feel the market will fall, which, as you can imagine, is common in most trading strategies, irrespective of trading style.
The four most frequently occurring patterns in the swing trading domain are reversal, retracement (or pullback), breakouts, and breakdowns.
FOR MORE INFO Message Us
Work All currency pair,
work all

The ZigZag indicator's main objective is to highlight significant price movements by filtering out minor price fluctuations. It enables the visualization of trends by eliminating market "noise," which can assist traders in making more informed decisions. Adding the Fibonacci indicator, which is a powerful tool for identifying potential support and resistance levels in financial markets.

This indicator is based on the RSI indicator
Also, some candlestick patterns are used in it to identify better signals
Can be used in all symbols
Can be used in all time frames
Easy to use method
Adequate settings
Settings: period: The number of candles used to calculate signals. alarmShow: If you want to receive an alert in Metatrader after receiving the signal, enable this setting alarmShowNoti: If you want to receive an alert on your mobile after receiving a signal, enable this sett
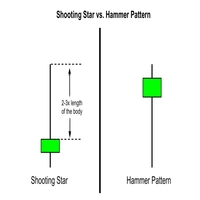
The Candlestick Reversal Alert for MT5 is your ultimate tool for identifying potential trend reversals in the financial markets. This powerful indicator is designed exclusively for MetaTrader 5 (MT5) and is packed with features to help you stay ahead of market movements. Key Features: Customizable Reversal Criteria: Tailor the indicator to your trading style by adjusting parameters such as lower wick size, top wick size, and top wick percentage. Historical Analysis: Specify how many historical c

Top indicator for MT5 providing alert and notification for symbols if any price freezes!
Guys, try to buy at least one month version for testing purposes! This indicator displays the current time for multiple Forex pairs and alerts when there's a disconnection between broker and PC time. It'll be very help full for trading platforms administrator who are monitoring hundreds of symbols in a time.
無料インジケーター - 無制限のアカウント - すべての無料製品についてはここをクリックしてください
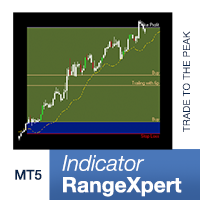
市場で完璧な機会を特定し 、ブレイクアウトを通じて 強いトレンド を追跡する場合、この RangeXpert インジケーターは 非常に貴重なサポートを提供します。このインジケーターは私が 初心者やセミプロ 向けに特別に開発したもので、市場機会を正確に特定し、取引戦略を最適化できる優れた分析機能を提供します。 RangeXpert は、複数のポジションの強みと 洗練された利益配分を 活用して、困難な市場状況においても適応性と回復力の向上を実証します。この アルゴリズムにより、 取引に参加する理想的な時間を見つけることができ、 RangeXpert を 使用するすべてのトレーダーの成功率が向上します。
高精度の AUTOTRADING 取引システム (EA) が利用可能になりました:
RangeXpert MT5 » https://www.mql5.com/de/market/product/103454
主な利点 完璧なエントリーゾーン 視
FREE

Zeusインジケーターのご紹介:トレーディングでの究極の利益ブレークスルーをサポートするツール。 このインジケーターは、ブレイクアウト戦略と深い分析の必要性を排除し、トレーディングを簡素化します。設定した時間フレームに基づいてゾーンを自動的に描画し、ストップロス(SL)、テイクプロフィット(TP)、トレーリングストップのレベルを提案します。 Zeusインジケーターは、価格が買いポイントまたは売りポイントに近づいた際に、すぐに通知し、シグナル矢印を表示します。さらに、4つの異なるテイクプロフィットレベルとさまざまなトレーリングストップオプションの推奨も行います。 このツールは初心者から熟練のトレーダーまで対応しています。 チャンネルサポート: こちらをクリック ストア: こちらをクリックしてください。
MT4バージョン: こちらをクリック おすすめ: 時間枠: M5またはM15 通貨ペア: すべての通貨ペアと互換性があります アカウントタイプ: すべてのアカウントタイプと互換性があります おすすめのストップロス: Zeusインジケーターが提供するSLの提案をご利用ください お

El indicador utiliza múltiples marcos de tiempo para analizar las mejores entradas de compra en el auge 1000. Está diseñado para ayudar a operar únicamente en picos de auge. el indicador tiene dos flechas; los rojos y azules. la formación de la flecha roja indica que debe estar preparado para una flecha azul que es una señal de entrada de compra. el indicador no ofrece puntos de salida. siempre recopile 3 pips, es decir, si ingresó a una operación a 10230,200, puede salir a 10260,200 con SL a 1
FREE

The Market Structures MT5 indicator finds and shows the Break Of Structures (BoS) pattern on the chart. The pattern is an important part of the Smart Money Concepts (SMC) system.
The appearance of a pattern means that the price breaks the last peak of an uptrend, or the last bottom of a downtrend. This indicates a change in the existing trend structure and the beginning of a new movement.
BOS is a technical analysis tool used to identify trend reversals.
The set of input parameters is simple
FREE

Welcome to Propsense, the best solution for new and veteran traders with a simple FREE strategy! NEW to MT5! This indicator is a unique and affordable trading tool built on the teachings of a former bank trader. With this tool, you will be able to see inefficient points with ease. Additionally, traders will have a clean Heads Up Display which will show your running and closed P/L in pips AND currency units. As a highly requested option, a candle timer has been added which will allow you to j

This indicator is converted from UT Bot alerts indicator by @QuantNomad of Trading View to MT5. its considering ATR and creating new candles on chart and also is giving good entry points based on its candles. all buffers of new candles and also entry signals are included as buffer so can be used easily on any EA. there are also some different strategies on the internet that can be used or contact me to create it for you.
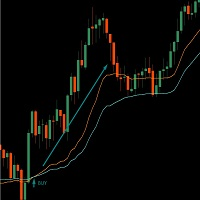
This indicator is built at the intersection of two VMA (Variable Moving Average, or VIDYA or Variable Index Dynamic Average) indicators. Flexible settings will allow you to more accurately find the entry point. The fast one crosses the slow one and this is a signal to buy or sell. Works on all instruments. Brief Description of the VMA Indicator: VMA (Variable Moving Average, also known as VIDYA or Variable Index Dynamic Average) is an exponential moving average that automatically adjusts the smo
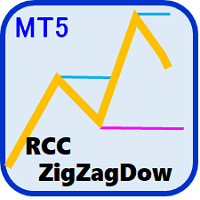
ZigZag と ダウ理論 による目線固定&ReviewCandleChart対応で過去検証の強い味方。「目線迷子」に悩む方におすすめのツール
概要 「RCCZigZagDow」インジケータは、ZigZag波動に対して、ダウ理論に基づく判断を支援するツールとなります。 ZigZag波動をベースとしてダウ理論の継続点を導き出すことによって、トレンドの把握を誰が行っても同じになるという利点があります。 現在のトレンドは「上げ」「下げ」それとも「レンジ」なのか波動のロジックが明確で、その結果の目線も明確。「客観性」と「再現性」を確保できます。 「目線迷子」に悩む方におすすめします
客観性と再現性の確保
このインジケータは、ZigZag(統一基準)を使用して市場の波動を客観的かつ再現可能に評価し、ダウ理論に基づく判断を支援します。 また、自動描画機能により、環境認識にかかる時間を大幅に短縮し、過去の検証をサポートします。 このように、誰が使用しても同じ結果が得られることが重要であり、それ以降の異なる解釈は個々の視点に委ねられます。 特定のタイミングでの共通認識を促進するツールとして
MetaTraderマーケットは、他に類のない自動売買ロボットやテクニカル指標の販売場所です。
MQL5.community ユーザーメモを読んで、取引シグナルのコピー、フリーランサーによるカスタムアプリの開発、支払いシステムを経由した自動支払い、MQL5Cloud Networkなど、当社がトレーダーに対して提供するユニークなサービスについて詳しくご覧ください。
取引の機会を逃しています。
- 無料取引アプリ
- 8千を超えるシグナルをコピー
- 金融ニュースで金融マーケットを探索
新規登録
ログイン