YouTubeにあるマーケットチュートリアルビデオをご覧ください
ロボットや指標を購入する
仮想ホスティングで
EAを実行
EAを実行
ロボットや指標を購入前にテストする
マーケットで収入を得る
販売のためにプロダクトをプレゼンテーションする方法
MetaTrader 5のための新しいテクニカル指標 - 14

Trend Following with Adaptive Weighted Average (AWA) Indicator The Adaptive Weighted Average (AWA) indicator is is a powerful technical analysis tool designed to provide highly accurate trading signals across various symbols and timeframes. This indicator leverages a unique Adaptive Weighted Average (AWA) calculation, combining multiple moving averages with user-defined weights, and incorporates advanced filtering techniques to minimize noise and whipsaw signals. The indicator is particularl
Is Zero Lag profitable? Not always, different system is for different pairs. You can play around with this indicator from Mladen, I have modified it with Bollinger Bands over T3.
You can change the period and how it calculate. MT4 version soon will be released too. Please leave a review , it helps us and we will share more indicators. .... Thank you and happy trading
FREE

Never miss a trading opportunity again and stay up-to-date with latest market developments even while on the go - welcome to The Notifier . No need to watch your charts all day: receive real-time alerts from all your favorite indicators - by push notifications and on-screen alerts. This tool notifies you on every every new (indicator) high/low, or also regularly with just a summary of the total highs/lows within the last X minutes. It also comes with its own built-in notifications that can be
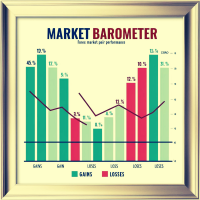
Market Barometer is a cheat code for trading, it acts as a "barometer" for market sentiment across various pairs, showcasing their changes. You can tell right away what to trade. You can trade trends or reversals. MT4 Version: https://www.mql5.com/en/market/product/127406 Market Barometer is a powerful tool designed to track and visualize the percentage changes across multiple currency pairs. By analyzing the price shifts of different forex pairs, it helps you understand how they are correla
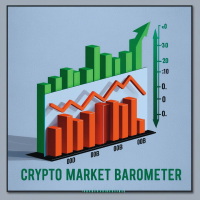
Crypto Market Barometer is a special crypto version of Market Barometer: https://www.mql5.com/en/market/product/127467 and is a cheat code for trading cryptos, it acts as a "barometer" for market sentiment across various pairs, showcasing their changes. You can tell right away what to trade. You can trade trends or reversals. Crypto Market Barometer is a powerful tool designed to track and visualize the percentage changes across multiple crypto pairs. By analyzing the price shifts of different

Momentum Explosion Pro is an advanced trading indicator designed to help traders identify and capitalize on powerful market movements. By analyzing momentum and volatility dynamics, this tool provides clear buy and sell signals, empowering traders to make precise and timely decisions. Key Features: Momentum and Explosion Signals: Accurately detects shifts in market momentum and explosive price movements to highlight profitable opportunities. Customizable Alerts: Stay informed with notificati
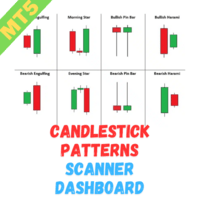
The Candlestick Pattern Scanner Dashboard MT5 is a powerful tool for monitoring candlestick patterns across multiple currency pairs and timeframes. It organizes detected patterns in a grid format, displaying the pattern's short form and how many candles ago it appeared (e.g., BUEN(3) for a Bullish Engulfing pattern detected three candles ago). You can find the MT4 version here Candlestick Pattern Multicurrency Scanner MT4 For detailed documentation click here Candlestick Pattern Detection: Id

The Ichimoku Multicurrency Scanner Dashboard MT5 is a powerful trading tool designed for monitoring multiple currency pairs and timeframes using Ichimoku Kinko Hyo. It organizes signals in a grid format, with symbols grouped by base currencies and timeframes, ranging from M1 to MN1. Traders can enable or disable specific timeframes to suit their strategies. You can find the MT4 version here Ichimoku Cloud Multicurrency Scanner MT4 For detailed documentation click here Ichimoku Integration: The

The Parabolic SAR Multicurrency Scanner Dashboard MT5 is a comprehensive tool for monitoring multiple currency pairs and timeframes using the Parabolic SAR (PSAR) indicator. It organizes signals in a grid format, displaying each symbol’s status across timeframes from M1 to MN1. Traders can enable or disable specific timeframes based on their strategies. For detailed documentation click here Parabolic SAR Integration: The dashboard uses the PSAR indicator with customizable parameters for Step and
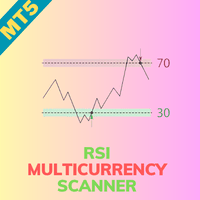
The RSI Multicurrency Scanner Dashboard MT5 is a powerful tool designed to monitor multiple currency pairs and timeframes using the Relative Strength Index (RSI). It organizes signals in a grid format, displaying each symbol’s status across timeframes from M1 to MN1. Traders can enable or disable specific timeframes to suit their strategies. You can find the MT4 version here RSI Multicurrency Scanner MT4 For detailed documentation click here RSI Indicator Integration: The dashboard supports fou
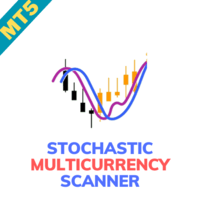
The Stochastic Multicurrency Scanner Dashboard MT5 is a powerful tool for monitoring multiple currency pairs and timeframes using the Stochastic oscillator. It organizes signals in a grid format, displaying each symbol’s status across timeframes from M1 to MN1. Traders can enable or disable specific timeframes to suit their strategies. You can find the MT4 version here Stochastic Oscillator Multicurrency Scanner MT5 For detailed documentation click here Stochastic Oscillator Integration: The
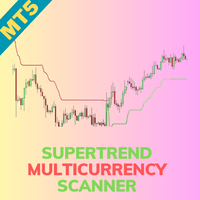
The Supertrend Multicurrency Scanner Dashboard MT5 is a powerful tool designed to monitor multiple currency pairs and timeframes using the Supertrend indicator. It organizes signals in a grid format, displaying each symbol’s trend status across timeframes from M1 to MN1. Traders can enable or disable specific timeframes to align with their strategies. You can find the MT4 version here Supertrend Multicurrency Scanner MT4 For detailed documentation click here Supertrend Integration: The d

Description:
This indicator adds customizable buttons for symbols (currency pairs) and timeframes directly onto the chart. It allows traders to quickly switch between different symbols and timeframes by simply clicking on the respective buttons. The indicator also includes a toggle button to show or hide all the symbol and timeframe buttons, providing flexibility in chart customization. Key Features: Symbol Buttons: Automatically generates buttons for symbols from the Market Watch or allows man

A professional-grade Bollinger Bands percentage analyzer.
Transform your trading strategies with the BBPCT Indicator, an advanced Bollinger Band Percentage indicator developed by iDevelop.expert. This tool is tailored to provide traders with a clear and actionable visualization of price movements relative to Bollinger Bands, along with insightful overbought and oversold signals.
Key Features: Dynamic Histogram Visualization: A dual-colored histogram for quick identification: Green bars indicat
FREE
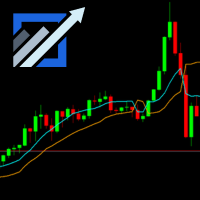
Boost your trading accuracy with the SSL Channel Indicator , designed to identify trends and precise entry points. This dynamic tool adapts to all trading instruments and timeframes. Perfect for scalpers, day traders, and swing traders, the SSL Channel Indicator simplifies market analysis, helping you trade confidently and effectively. Unlock your trading potential today! MT4 Link- https://www.mql5.com/en/market/product/127493
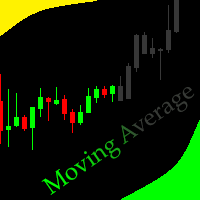
this Moving Average indicator is like no other, making trading easier for you,the settings are preset and can't be changed but don't let that stop you because it's highly accurate.
If the candle closes above the line you enter buys and below then you go for sells, this is build to help beginner traders on their journey to becoming profitable
Easy and quick to understand
FREE

Do Youe use Multi Epert Advisor? You need this Indicator ...
TradeResultsByMagic Overview This indicator creates a detailed trading report in a separate window, displaying performance metrics for trades grouped by magic numbers across multiple symbols. It shows various metrics including deal counts, lot sizes, prices, profits, win rates, and exposure percentages. Key Features Tracks multiple magic numbers (up to 1024) Supports multiple symbols per magic number (up to 100 per magic) Displays cus
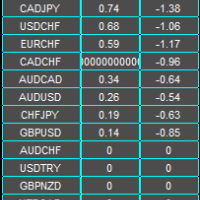
Abbeyfx Swap Dashboard displays your broker swap/interest rate. The implied swap/interest rate differential is for all currency pairs you have in your market watch. Interest rate differential: The key factor traders consider is the difference in interest rates between two currencies involved in a pair, known as the "interest rate differential Impact on currency value: A higher interest rate typically makes a currency more attractive, causing its value to rise relative to other currencies with lo

Price Position Indicator....
This indicator tells you exactly when to buy or sell in the market with alerts, it works on any time frame and with any market of your choice, it is highly accurate and is definitely worth the investment, this indicator performs well with the moving average indicator i also have for sale, be sure to check out my profile to see my products.
it gives out buy and sell signals based on where the current price is, it follows the trend as well.
【R】【Y】【M】 【R】【Y】【M】 【R】【Y】【M】
The Linear Regression Channel Indicator is a powerful technical analysis tool that helps traders capture price trends and potential reversal points. By calculating and displaying linear regression channels, bands, and future projections, this indicator offers an in-depth perspective on market dynamics. It aids in identifying overbought and oversold conditions, trend direction, and provides clear visual cues for potential future price movements.
STILL ON I
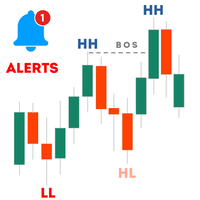
指標 Haven Market Structure は、どのタイムフレームにおいても市場の転換点や構造ブレイクを正確に識別するために設計された強力なツールです。この指標は、高値(HH)、低い高値(LH)、高い安値(HL)、低い安値(LL)を明確に表示し、構造ブレイク(BOS)のレベルも強調することで、トレーダーが潜在的な市場転換シグナルを捉えるのをサポートします。
その他の製品 -> こちらをクリック 主な機能: 転換点を特定するためのカスタマイズ可能な長さ: パラメーターの長さを調整することで、市場の転換点を正確に検出し、エントリーおよびエグジットのタイミングを最適化できます。 ローソク足の終値または現在の価格によるブレイクアウト確認の選択: ご自身の取引戦略に合わせ、ローソク足の終値または現時点の価格に基づいてブレイクアウトを確認する方法を選択できます。 ラインとマーカーの視覚表示のカスタマイズ: 色、線の太さ、マーカーの表示方法を調整して、より直感的なグラフィカル表示を実現し、技術分析を容易にします。 BOS通知 (CHoCH): MetaQuotes IDとMetaT
FREE

Special offer : ALL TOOLS , just $35 each! New tools will be $30 for the first week or the first 3 purchases ! Trading Tools Channel on MQL5 : Join my MQL5 channel to update the latest news from me ICTの 反転フェアバリューギャップ (IFVG) の概念を活用した Inversion Fair Value Gaps Indicator でその力を解放しましょう!この最新ツールは、フェアバリューギャップ (FVG) を次のレベルに引き上げ、反転したFVGゾーンを特定して表示します。これらは、価格修正後に形成される重要なサポートおよびレジスタンスエリアです。スキャルパー、スイングトレーダー、長期投資家のいずれであっても、IFVGインジケーターはリアルタイムでの意思決定にとって貴重な洞察を提供します。 MT4バージョンはこちら: Inversion Fair Val

インジケーター Haven FVG は、市場を分析するためのツールで、チャート上で非効率性の領域(Fair Value Gaps、FVG)を特定することができ、トレーダーに価格分析と取引決定のための主要なレベルを提供します。 他の製品 -> ココ 主な特徴: 個別のカラー設定: ブルFVGの色 (Bullish FVG Color)。 ベアFVGの色 (Bearish FVG Color)。 柔軟なFVGの視覚化: FVGを検索するための最大ローソク足数。 FVGゾーンの追加延長(特定のバー数)。 FVGの塗りつぶしを有効にするオプション。 中央線(Middle Line): 線の色とスタイルの選択(例:点線)。 線の太さの調整。 一般設定: FVGを現在のバーまで拡張。 塗りつぶしのある歴史的なFVGを除外し、最新のデータに焦点を当てる。 チャート上の非効率性の領域を分析し、根拠のある取引決定を行う簡単で効果的な方法。
FREE
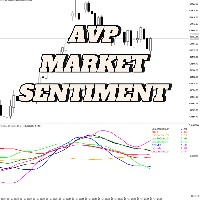
AVP Market Sentiment は、同じサブチャートウィンドウ内で複数のアセット間の関係を分析するために開発されたツールです。特に、相関関係がよく研究されているティッカー(例:先物インデックスとVIX)の比較に役立ちます。複数のティッカーを同時に監視し、1つまたは複数のティッカーについて意思決定を行いたいときに非常に有用です。このツールでは、プラットフォームで使用する移動平均の種類や、これらの平均の期間、各線の色をカスタマイズすることができます。計算が速く、分析において非常に柔軟で軽量なツールです。 変動収入市場における市場分析の重要性 変動収入のダイナミックな世界では、市場分析はリターンを最大化し、リスクを最小化しようとする投資家にとって不可欠なツールです。グローバルな金融市場の複雑さは、通貨ペア、金や銀などの貴金属、先物インデックス、そしてVIX(ボラティリティインデックス)を含むさまざまなアセット間の相互関係を深く理解することを求めます。 グローバルな相互関係 金融市場は複雑に相互接続されています。ある市場の動きは、他の市場に大きな影響を与える可能性があります。たとえば
Special offer : ALL TOOLS , just $35 each! New tools will be $30 for the first week or the first 3 purchases ! Trading Tools Channel on MQL5 : Join my MQL5 channel to update the latest news from me 概要
OA SnR Powerは、サポートおよびレジスタンスレベルの強度を識別して評価するために設計された強力なツールです。取引量、反発頻度、再テスト回数などの重要な要素を組み込むことで、このインジケーターは市場の重要な価格ゾーンを包括的に可視化します。 その他の製品を見る: すべての 製品 OA SnR Powerの仕組み 高値と安値の特定 このインジケーターは、ローカル高値と安値を計算するための高度なアルゴリズムを使用します。 ユーザーはゾーン幅の設定を調整でき、サポートおよびレジスタンスの潜在的なレベルを正確に検出します。 主要レベルのフィルタリングと統合
FREE

Arrow Micro Scalper は、スキャルピングと短期取引用に設計されたインジケーターで、あらゆるチャートや金融商品 (通貨、仮想通貨、株式、金属) に統合されています。
彼女は仕事で波動分析とトレンド方向フィルターを使用しています。 M1 から H4 までのタイムフレームでの使用が推奨されます。
インジケーターの操作方法。
インジケーターには設定を変更するための 2 つの外部パラメーターが含まれており、残りはデフォルトですでに構成されています。 大きな矢印はトレンド方向の変化を示し、青い矢印は下降トレンドの始まりを、ピンクの矢印は上昇トレンドの始まりを示します。 「 Only trending direction 」パラメータは、内部トレンドを使用するモードを有効または無効にし、独自のトレンドを使用するか、トレンドを使用せずに作業する機会を提供します。また、トレンド矢印とシグナルのみのトレンド矢印の表示を有効または無効にします。 小さなシグナル矢印、インジケーターの最も重要なオブジェクト、ピンクは「買い」トランザクション、青は「売り」トランザクション。 「 Smooth

MetaTrader 用 Slope Channel インジケーター
あらゆる取引スタイルに適応できる市場トレンド分析ツールをお探しですか? Slope Channel – 価格の方向性や市場の主要レベルを特定する信頼できるアシスタントです! Slope Channel とは? Slope Channel は革新的なインジケーターで、チャート上に傾斜チャネルを構築し、ローカル極値に基づいてそのパラメーターを自動計算します。このツールは最適なチャネルオプションを強調表示し、変化する市場条件に迅速に適応することを可能にします。 ユニークな特徴 チャネル角度の自動計算: インジケーターはチャネルの傾斜角を表示し、そのタイプを示します: 収束(正の角度): チャネルの狭まりと価格圧力の増加を示します。 発散(負の角度): 範囲の拡大と不安定性の可能性を示します。 最新データの更新: チャネルは新しいバーごとに再計算され、最新データが使用されます。 幅広い応用 このインジケーターは以下に適しています: スキャルピング – 短期的な変動の分析。 デイトレ
FREE

BoomCrash Turbo
「最大のスピードと精度で取引!」 BoomCrash Turboは、MetaTrader 5プラットフォームでBoomおよびCrashインデックスに特化して設計された強力な半自動インジケーターです。結果を向上させ、市場のチャンスを最大限に活用したいトレーダーに最適です。 インジケーターの特徴:
高精度のシグナル:エントリーとエグジットのリアルタイム通知。
高速な意思決定:市場の動きに迅速に対応するのに最適。
簡単な設定:使いやすいテンプレートと最小限の設定で開始可能。
フルサポート:Boom 300–1000およびCrash 300–1000に対応。 なぜBoomCrash Turboを選ぶのか? 高精度のシグナルで利益を向上。 低リスクから攻撃的な取引まで多様な戦略に対応。 自動計算により時間を節約。 使用条件: プラットフォーム:MetaTrader 5。 タイムフレーム:1分。 リスクレベル:預金に応じて調整可能。 このインジケーターは誰に向いているか? シンプルな取引ソリューションを探している初心者。 結果を向上させ

Combo chart "Pillar Candles" If you prefer to trade without indicators, then this indicator will be the only one in your arsenal. It will transform your chart and make your market analysis clearer.
What problem does this indicator solve? The most important thing in successful trading is to see the OHLC values clearly. Most traders use the Japanese Candlestick chart type. But it has a significant disadvantage. Because of the different thickness of bodies and shadows, the human eye can no long

Includes almost all the concepts related to Volume Profile: POC , Value Area , Developing POC , Anchored VWAP , Volume Delta ; since the “Total” in its name. It is fast in its calculations and simple to work with.
Features:
1. Selectable calculation timeframe to find most traded levels.
2. Capable of calculating Volume Profile based on tick data
3. Adjustable histogram bars by their count.
4. Adjustable histogram bars by their height (price range).
5. Showing Value Area (VA

Trend Indicator with Adaptive Color Change: The Perfect Tool for Effective Trading! Looking to determine the trend direction with maximum precision? Meet our trend indicator , which dynamically changes the color of its moving average based on the current market direction. This tool is suitable for both beginners and experienced traders, helping you make informed decisions with clear, actionable signals. What You’ll Get: Adaptive Trend Analysis : The moving average changes its color according to

Trend Lines Supports and Resistances is an indicator that analyses the market structure, identifies Pivot Points, displays active Support/Resistance zones and trend levels.
Main Features: Defining and displaying Pivot Points. Analyse Pivot Points to build and display trend lines. Setting up visual display of trend lines. Setting up trend lines broken notifications. Analyse Pivot Points to define and display support and resistance levels. Setting up visual display of support and resistance leve
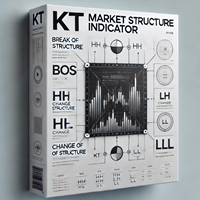
The KT Market Structure intelligently detects and displays Break of Structure (BOS) , Change of Character (CHoCH) , Equal Highs/Lows (EQL) , and various significant swing high/low points using our proprietary algorithm for accurate pattern detection. It also offers advanced pattern analysis by effectively demonstrating the captured profit for each pattern. A fully automated EA based on this indicator is available here: KT Market Structure EA MT5
Features
Accurate Pattern Detection: Our advance

Gold XAUUSD Scalping Indicator The Gold XAUUSD Scalping Indicator is a powerful trend-following tool crafted for traders who specialize in scalping. This indicator is optimized for the M5 timeframe , ensuring precise signals, but it is also versatile enough to be used on M1 and M15 charts to suit various trading strategies. Key Features Trend-Following Accuracy : Identifies high-probability buy and sell opportunities by analyzing trend direction effectively. Multi-Timeframe Compatibility : Best

The Simple ICT Concepts Indicator is a powerful tool designed to help traders apply the principles of the Inner Circle Trader (ICT) methodology. This indicator focuses on identifying key zones such as liquidity levels, support and resistance, and market structure, making it an invaluable asset for price action and smart money concept traders. Key Features Market Structure : Market structure labels are constructed from price breaking a prior swing point. This allows a user to determine the curr
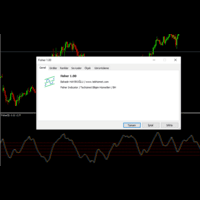
With Fisher level indicator. Many settings can be changed by the user, indicator created with original calculation. You can adjust the levels you create according to yourself and provide more stable displays. What is Fisher indicator: It transforms data that does not normally show a normal distribution, such as market prices. In essence, the transformation helps to better identify price reversals on a chart by making peak swings relatively rare events.
FREE
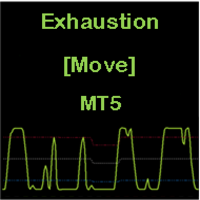
CONSTITUTION Exhaustion [Move] is an indicator consisting of an oscillator and three dynamic levels (upper, middler, lower). The inputs can be used to adjust the oscillator, dynamic levels and warning signals. It is designed for the MT5 platform only. APPLICATION This indicator should be used with a trend filter [e.g. moving averages, MA 200]. It detects the exhaustion of correction movements within a trend, thus giving entry points for new trades. It is usually used in the RENKO chart for SCA

iExposure Fox Wave – Comprehensive Position Monitoring Indicator iExposure Fox Wave is an advanced MetaTrader indicator designed to provide detailed monitoring of all open trading positions in a clear, tabular format. This tool is perfect for traders who want all essential trade information in one place. Key Features: Symbol: Displays the instruments (currency pairs or other symbols) with open positions. Deals: Number of open trades (transactions) for each symbol. Buy lots & Buy price: Total vol

Indicador com regra de coloração para estratégias que utilizam Inside Bar! Quando rompe a barra inside, se for para cima, compra e posiciona o stop loss na mínima da barra inside. Se romper para baixo, vende e posiciona o stop loss na máxima da barra inside. Pode ser aliada a tendências de outros tempos gráficos e outros filtros.
Grupo de sinais gratuito no telegram: https://t.me/InsideBarRST
FREE
Rinse and Repeat indicator for 3 day/session/week setups. Indicator daily features: Daily close/high/low Weekly open/high/low/close Month open/high/low/close Daily breakouts Daily failed breakouts Asia/London/New York sessions Inside days Outside days Green days Red days
Indicator weekly features:
Weekly breakouts Week dividers Indicator other features: Dashboard with bar end countdown and running PnL
FREE

Copytrading en Tiempo Real – Comunidad Ola Trading Si ya probaste nuestras operaciones en modo demo , ahora podés dar el siguiente paso y comenzar a copiar operaciones en tiempo real junto a nuestra comunidad. En esta sección, tendrás acceso a señales reales de trading operadas por el equipo de Ola Trading , activo de lunes a domingo . Una vez que te suscribas, vas a poder copiar nuestras operaciones directamente en tu cuenta real . ¿Cómo comenzar? Suscribite en nuestra página a través de

Safe travel is possible only on a road with good markings and correct road signs . Due to the very active use of my indicator on MT4 , I decided to switch it to MT5 . The indicator shows : - pulse waves ( bold sloping lines ) ; - corrective waves ( thin inclined waves ) ; - Series of waves up ( blue ) ; - wave series down ( purple ) ; - wave series lengths ( numbers near the zigzag vertices ) ; - breakdown levels of a series of waves ( short green and red lines ) ; - profit targets ( Fibonacci g
This is the Super Trend Dashboard MT5. This dashboard will scan multiple timeframes in MT5 platform, from M1 chart to D1 chart. It will send the buy/sell signals by alert on the platform or sending notification to your phone or message you via a email.
The buy signal is generated when the super trend line flip from SELL to BUY. The sell signal is is generated when the super trend line flip from BUY to SELL.
The up trend color will be displayed depending on the current Super Trend value.
This is the Heiken Ashi Dashboard MT5. This dashboard will scan multiple timeframes and symbols in MT5 platform, from M1 chart to D1 chart. It will send the buy/sell signals by alert on the platform or sending notification to your phone or message you via a email.
The buy signal is generated when the heiken ashi bar changes its color from red to white. The sell signal is is generated when the heiken ashi bar changes its color from white to red. The up/down trend color will be displayed depend
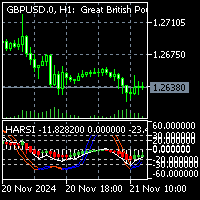
To get access to MT4 version please click here . This is the exact conversion from TradingView:"Heikin Ashi RSI Oscillator" by "jayRogers" The screenshot shows similar results from tradingview and Metatrader when tested on ICMarkets on both platforms. This is a light-load processing indicator. It is a non-repaint indicator. I removed colored areas option to fit into metatrader graphics. Buffers are available for processing in EAs. You can message in private chat for further changes you need.
The MACD Divergence Indicator is a powerful tool designed to identify Classical (Normal) Divergences on the MACD, which can signal potential market reversals or continuation trends. Divergences occur when the price and the indicator move in opposing directions, highlighting potential shifts in momentum. What is a Classical (Normal) Divergence? Classical Divergences are categorized into two main types: Bullish Divergence: Occurs when the price forms lower lows, but the MACD forms higher lows. Thi
This is the ADX Dashboard MT5. This dashboard will scan multiple timeframes in MT5 platform, from M1 chart to D1 chart. It will send the buy/sell signals by alert on the platform or sending notification to your phone or message you via a email.
The buy signal is the cross over of DI+ and DI- The sell signal is the cross under of DI+ and DI-.
The up trend color will be displayed when DI+ is greater than DI- The down trend color will be displayed when DI+ is less than DI- The value of ADX value wi

This indicator combines two tools: MACD and OsMA . MACD is displayed as two lines: The black line represents the main MACD line. The orange line represents the MACD signal line. OsMA Histogram is shown in two colors: Green bars indicate growth. Red bars indicate decline. You can customize the line colors and thickness in the settings. This indicator serves as an addition to the Combo View Impulse System indicator but can also be used independently. Parameters: Fast EMA

FTU Qs Buy Sell Arrow MT5
The indicator is for MT5 platform, can be used stand alone but best combined with other indicators or strategies. Many arrow changes at certain times, so best to filter the signals using minimum one concept or strategy Combines various indicators such as stochastic, rsi and moving average to draw an arrow for suggestion of entry or change in trend
Indicator Features: Sell and Buy arrows with settings Visual and sound alert Colour change, more features coming soon Ne

This indicator combines several functionalities: Value Zone Displays two exponential moving averages (EMAs): 13-period EMA in red. 22-period EMA in blue. Impulse System (based on Dr. Alexander Elder's methodology) Candles are color-coded to indicate trade restrictions: Red candles prohibit buying. Green candles prohibit selling. Blue candles allow both buying and selling. Recommended for use on two timeframes for enhanced analysis. 3x ATR Channel A channel based on 3 times the AT

Description: The "Supports and Resistances with Daily Pivots v2" indicator is a comprehensive tool that displays pivot points and support/resistance levels on the chart. It provides both daily, weekly, and monthly pivot levels, helping traders identify potential turning points and support/resistance areas. The indicator also includes alerts to notify traders when the price reaches these levels.
Key Features Pivot Point Types: Standard Pivot: Calculates pivot points using the standard method. F
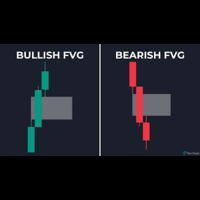
It identifies fair value gaps which are currently valid. Settings: Bullish FVG Color: To set the color of bearish FVGs. Bearish FVG Color: To set the color of bearish FVGs. Minimum Size: For filtering the signals. The restricts a minimum size for the FVG to be considered valid. For custom additions you can reach out to developer here MT4 Version available here

Introducing PivotWave – your ultimate trading companion that redefines precision and market analysis. Designed with traders in mind, PivotWave is more than just an indicator; it’s a powerful tool that captures the pulse of the market, identifying key turning points and trends with pinpoint accuracy. PivotWave leverages advanced algorithms to provide clear visual signals for optimal entry and exit points, making it easier for traders to navigate volatile market conditions. Whether you are a begin

RXTL indicator Indicator is based on ATR to calculate trend and direction bias Works on all timeframes
Required for the other EA to work accordingly Download and ensure it is placed in the Indicator folder Do inbox me for any questions
installing instructions 1) Download RXTL indicator 2) If indicator does not appear, refresh indicator tab 3) Drag indicator to active chart 4) Use it alongside with other EA
FREE

Индикатор собирает данные из биржевого стакана, суммируя отложенные ордера на покупку или продажу. Далее, по сумме ордеров определяется общее направление, куда смотрят участники рынка. Если суммарные покупки/продажи превышают определенный коэффициент, то производится сигнал. Настройки: Timer=5 // указывается как часто обновлять данные по рынку в секундах. Чаще чем раз в 10 секунд ставить не рекомендуется. X-size =700 // размер окна по оси Х. Y-size=650// размер окна по оси Y. Only "Market Watch"

Swing Points Pro v2 – Enhanced Highs and Lows Indicator with Push Notifications Overview :
The Swing Points Pro v2 indicator is a powerful and reliable tool designed to help traders identify critical swing highs and lows on their charts. Whether you trade Forex, Stocks, or Crypto, this updated version provides advanced features to enhance your market analysis, with real-time push notifications for key market movements. Key Features : Accurate Swing Identification : Pinpoints major swing highs a

Pro Thunder V10: バイナリーオプション取引の究極のインジケーター! Pro Thunder V10 で取引を次のレベルへ引き上げましょう!最先端の ニューラルネットワークAI技術 に基づいたこの革新的なインジケーターは、比類のない精度と信頼性を提供するよう設計されています。リアルタイムの非リペイント信号から、変動する市場条件でもシームレスなパフォーマンスまで、 Pro Thunder V10 はあなたの取引における究極のパートナーです。 主な特徴: 圧倒的な精度: 高精度の信号で市場を制覇。重要なニュースイベントを含むあらゆる市場状況で実証済み。 OTC対応: OlympTrade、Pocket Option、Quotex、Binomo、IQ Option などのプラットフォームで完璧に動作。 MT5専用: 最も先進的な取引プラットフォームである MetaTrader 5 のために特別に設計されています。 パフォーマンスダッシュボード: 勝敗や信号を直感的に追跡できる使いやすい画面。 永久アクセス: 一度の購入で、すべてのアップデートに生涯アク
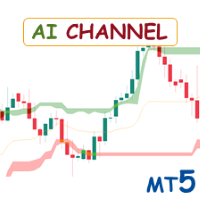
Special offer : ALL TOOLS , just $35 each! New tools will be $30 for the first week or the first 3 purchases ! Trading Tools Channel on MQL5 : Join my MQL5 channel to update the latest news from me AI Channels インジケーターは、クラスタリング分析における強力な機械学習技術である ローリングK-平均クラスタリング を使用して、価格の基礎的なトレンドについてリアルタイムの洞察を提供します。このインジケーターは、クラスタ化された価格データに基づいた適応チャネルを作成し、トレーダーがトレンド方向や市場の状況について情報に基づいた判断を下せるようにします。 インジケーターにはリスク管理に柔軟性を持たせるため、 トレーリングストップオプション も設定内に含まれています。 MT4バージョンを見る: AI Channels MT4 他の製品を見る: すべて
FREE
MLD RSI MT5: カスタマイズ可能なアラート付きのRSIを最大限に活用 はじめに
MLD RSIインジケーターは、クラシックな相対力指数(RSI)にアラート機能やトレンド確認を追加したMT5用の強力なツールです。このインジケーターは、初心者から経験豊富なトレーダーまで幅広く適しており、Forex、株式、仮想通貨、シンセティック指数など様々な市場で活用できます。 RSIとは?
RSI(相対力指数)は、価格の勢いを0から100の範囲で測定するテクニカル指標です。 70以上は買われすぎを示します。 30以下は売られすぎを示します。 強いトレンドが発生している市場では、RSIの従来の信号が誤解を招く可能性があります。MLD RSIはRSIの解釈を向上させ、誤った信号を避け、取引のエントリーポイントを最適化します。 MLD RSI MT5の主な機能と利点 RSIの重要レベルに対するカスタマイズ可能なアラート : 買われすぎ(デフォルトは70)、売られすぎ(デフォルトは30)、およびRSIの中間ライン(50)に対して独立したアラートを提供。 トレンドの方向に応じたアラートを設定し、関
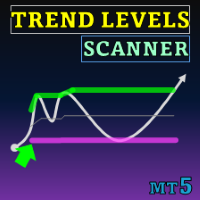
Special offer : ALL TOOLS , just $35 each! New tools will be $30 for the first week or the first 3 purchases ! Trading Tools Channel on MQL5 : Join my MQL5 channel to update the latest news from me トレンドレベル (Trend Levels) インジケーターは、相場の動きにおける重要なトレンドレベル(高値、中値、安値)を特定するために綿密に作られています。カスタマイズ可能な過去期間の最高値、最安値、および中値に基づくリアルタイム計算により、トレーダーにトレンドの動向と強さについて構造化された視点を提供し、精密かつ情報に基づいた取引判断を支援します。 MT4バージョンはこちら: Trend Levels MT4 他の製品を見るには: 全製品 トレンドレベルインジケーターの主な特徴と使用方法 トレンド変化シグナル インジケーターは、選択した入力期間内の最高値と
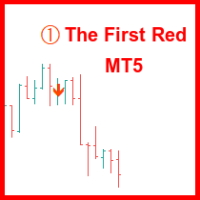
「The First Red」インジケーターは、ダリウシュ・ダルゴ(Dariusz Dargo)が考案した戦略に基づき、「The First Red」戦略および「Second Red」、「First Green」、「Second Green」などの拡張条件を満たすローソク足をチャート上で特定してマークするために設計されています。この戦略は、局所的な極値の分析とMACDオシレーターのシグナルを中心に展開されています。 第一の赤いローソク足(First Red Candle): ローソク足が局所的な最高値を形成し、MACDヒストグラムが下降方向に転じたときに「First Red」としてマークされます。 チャート上のシンボル:ローソク足の上に赤い下向きの矢印。 第二の赤いローソク足(Second Red Candle): 「First Red」に続く第二の下降ローソク足で、方向転換を確認します。 チャート上のシンボル:ローソク足の上に赤い数字「2」。 第一の緑のローソク足(First Green Candle): ローソク足が局所的な最安値を形成し、MACDヒストグラムが上昇方向

フィボナッチの力を解き放て! Adaptive Fibonacci Trend Ribbon (AFTR) 登場! あなたのトレード戦略を革命的に変える準備はできていますか?AFTR は単なるインジケーターではなく、トレンドを捉え、リバーサルを分析し、比類なき明確さで正確な取引を行うための究極のツールです。フィボナッチ数列と高度な移動平均線の組み合わせにより、正確性と柔軟性を追求するトレーダーのために設計されました。 差をつける主な機能: フィボナッチの精度を持つマルチ移動平均線 直感的なトレンド検出 動的に色付けされたトレンドゾーン あらゆる市場条件に対応できるカスタマイズ性 トレンドリボンは、移動平均線間を色で塗りつぶし、トレンドの強さや弱さに応じて変化します。キーレベルやリバーサルポイントを容易に識別し、自信を持って取引機会をつかむための視覚的な確認が得られます。 トレードを強化するインサイト: フィボナッチを駆使した市場支配。 トレンドとリバーサルを自信を持って識別。 直感的で迅速な意思決定。 AFTRで取引を強化し、市場の動きをクリアにマッピングしましょう。初心者からプロま

SS7Traderが提供する Neural FX Indicator でAIの力を解き放ちましょう。この高度な神経ネットワークベースのツールは、さまざまな市場での取引を最適化するように設計されています。Forex(外国為替)、株式、暗号通貨、指数、XAUUSD(ゴールド)など、どの市場で取引していても、この強力なインジケーターは、変更されることのない安定した買いと売りのシグナルを提供し、リアルタイムで自信を持って意思決定を行うことができます。 Neural FX Indicator はMetaTrader 5 (MT5)専用で提供されており、世界で最も信頼されている取引プラットフォームの1つと完全に互換性があります。すべての時間枠に対応しており、異なる取引スタイルにシームレスに適応し、あらゆる市場条件で成功を収めるために必要な柔軟性を提供します。 主な特徴: マルチマーケット対応: Forex、株式、暗号通貨、指数、XAUUSDなどに対応。 非リペイント技術: 安定した信頼性のあるシグナルを提供し、正確な意思決定をサポート。 AI駆動: 最先端の神経ネットワークアルゴリズムに基づき、高
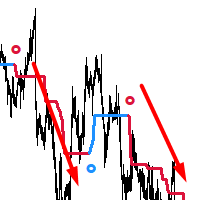
AdaptiveTrendHunter - 適応型トレンド検出インジケーター
主な特徴: 色分けによる簡単なトレンド識別(上昇トレンドは青、下降トレンドは赤) 矢印でマークされた明確な売買シグナル 市場のボラティリティに対するスマートな適応 カスタマイズ可能なトレンド確認設定 新規トレードシグナルのオプションアラート機能 使用方法: トレンドフォロー: 青いラインは潜在的な上昇トレンドを示します 赤いラインは潜在的な下降トレンドを示します トレンド転換の確認には色の変化を待ちます エントリーシグナル: 上向き矢印は買いのタイミングを示唆 下向き矢印は売りのタイミングを示唆 必ず矢印がメインのトレンドラインの色と一致していることを確認 トレード管理: トレンドラインをダイナミックなサポート/レジスタンスレベルとして使用 潜在的なトレンド反転のための色の変化を監視 独自の利確戦略とリスク管理ルールと組み合わせて使用 重要な注意点: シグナルは現在の足で形成され、足の展開に伴い再描画される可能性があります 適切なリスク管理を常に行い、インジケーターのシグナルだけに依存しないでください 実取引

Smart Volume Box is designed to give MetaTrader users a powerful, analytical tool for uncovering the hidden dynamics in the market. This precision-built tool, complete with user-friendly settings, integrates essential volume insights and advanced features like Volume Profile, VWAP (Volume Weighted Average Price), and Point of Control (POC) levels. Unlike typical indicators, Smart Volume Box doesn’t provide specific trade signals but instead offers a clearer perspective on market trends, makin

トレンドリスクインジケーター PRT は、価格変動のトレンド部分を見つけ、バッファー内の値によってトレンドの存在を示します。 フラット取引に使用して、取引が実行されるチャネル (D1 に推奨) から価格が抜ける可能性がある場合に取引を無効にすることができます。
2 つの入力パラメーターがあります:
• バンド範囲 - バンド計算範囲 • 偏差 - 偏差値 (許容されるチャネルの幅) Trend Risk Indicator PRT finds trendy parts of the price movement and indicates the trend presence by a value in the buffer. Can be used for flat trading to disable trading when there is a possibility of price exiting the channel (recommended for D1) , in which trades are performed. It has two input
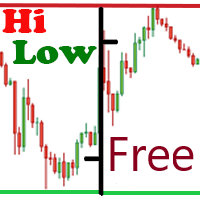
The free version of the Hi Low Last Day indicator . The Hi Low Levels Last Day indicator shows the high and low of the last trading day . The ability to change the color of the lines is available . Try the full version of the Hi Low Last Day indicator , in which additional indicator features are available : Displaying the minimum and maximum of the second last day Displaying the minimum and maximum of the previous week Sound alert when crossing max . and min . levels Selecting an arbitrary audio
FREE

Makuchaku Super Order Block
Introducing the "Makuchaku Super Order Block" – an all-in-one, powerhouse trading tool that combines the market’s most effective indicators in one, intuitive interface. This is more than just an indicator; it's a comprehensive market intelligence solution. Engineered for peak performance and precision, OBFVG is the best indicator of 2024 and a must-have for every serious trader. Let's dive into the key features of this indicator and how each can enhance your trading
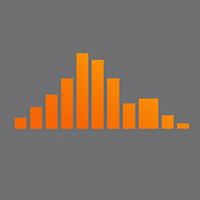
The indicator shows the price change of the current or any other instrument since the beginning of the day / week . You can choose to display it in points or as a percentage relative to the opening price of the beginning of the period . The indicator is made in the form of a histogram with two colors , for ascending and descending price changes . You can also choose which tool to show the data for . The data will be displayed on the current chart .
FREE

Introducing the Fair Value Gap Indicator : A Simple and Effective Trading Tool The Fair Value Gap Indicator is designed to help traders easily identify and utilize Fair Value Gaps (FVGs) in their trading strategies. FVGs highlight price imbalances that the market often revisits, offering potential trade entry or exit opportunities. Whether you're a beginner or an experienced trader, this indicator simplifies the process of spotting these valuable zones, allowing you to trade with clarity and co
FREE
MetaTraderマーケットが取引戦略とテクニカル指標を販売するための最適な場所である理由をご存じですか?宣伝もソフトウェア保護も必要なく、支払いのトラブルもないことです。これらはすべて、MetaTraderマーケットで提供されます。
取引の機会を逃しています。
- 無料取引アプリ
- 8千を超えるシグナルをコピー
- 金融ニュースで金融マーケットを探索
新規登録
ログイン