YouTubeにあるマーケットチュートリアルビデオをご覧ください
ロボットや指標を購入する
仮想ホスティングで
EAを実行
EAを実行
ロボットや指標を購入前にテストする
マーケットで収入を得る
販売のためにプロダクトをプレゼンテーションする方法
MetaTrader 5のための新しいテクニカル指標 - 5

次の反転のシグナルを受け取る | ゲインレートの統計を最適化する | 価格がテストするゾーンを取得する。 | 非リペイント、非遅延インディケータ - マニュアルおよび自動売買に最適 - すべての資産、すべての時間単位に対応 発売時69 ドル - その後 149ドル 購入後、 推奨セッティングについては、このチャンネルで私に連絡してください。
MT4 バージョン | TrendDECODER と PowerZONES を使った完全な方法を入手する
切って走れ!
BladeSCALPERを使えば、これらの予測可能なM&Wの動きのほんの一部を切り取ることができるのです! お気に入りのアセットに繋いで、利益を上げて、群衆から逃げましょう。
何のことでしょう?
最も予測しやすいパターンとして、「ダブルトップ」と「ダブルボトム」が挙げられ、文字がこれらのパターンを明示することから、一般的に「M」と「W」と呼ばれています。
BladeSCALPERは、スキャルピングをシンプルかつ簡単にするための革新的な技術を凝縮しています。 Scal

精密な取引分析を指先で:次世代取引分析ソフトウェア 市場に出回っている一般的な取引分析ソフトウェアは、時間別または週別の損益率統計のみを提供することが多く、より正確な取引分析のニーズを満たしていません。しかし、実際の取引市場では、毎日が独自の状況を呈しています。月曜日は静かで、水曜日は3倍のオーバーナイト金利で活発になり、金曜日は重要なデータ発表で非常に活発になります。明らかに、毎日統計分析を行うことは科学的ではなく、週単位で分析する方が理にかなっています。しかし、週足チャートは各日の統計的な状況のみを示しており、時間ごとの変化を捉えることができません。さらに、特定の銘柄は、ロングポジションとショートポジションで大きな違いを示すため、個別の分析が必要ですが、これは現在の取引分析ソフトウェアには欠けています。
時間単位が粗すぎることに加えて、既存の取引分析ソフトウェアは、戦略のフィルタリングの点でも不足しています。銘柄名のみでフィルタリングを行うことは、1つの銘柄で複数の戦略が同時に実行されている可能性があるため、科学的ではありません。同様に、マジックナンバーのみを頼りにフィルタリ
FREE

革新的なメタトレーダーテーマビルダーで取引チャートに命を吹き込みましょう!
テーマビルダーを使えば、あなたのスタイルや好みに合った取引環境を作ることができます。使いやすいインターフェースとメタトレーダーとの完全な統合により、チャートのルック&フィールを完全にコントロールすることができます / MT4無料版
特徴 完全カスタマイズ: ローソク足の色やチャートの背景を簡単に変更し、独自の取引スタイルを反映させることができます。ソフトでプロフェッショナルな色調から、鮮やかで大胆な色まで、可能性は無限です。 無限の創造性: 様々な色の組み合わせやスタイルを試して、あなたの個性や好みに合った完璧な外観を見つけましょう! 使いやすさ: 当社のツールは、初心者トレーダーでも直感的に使いやすいように設計されています。数回クリックするだけで、チャートを完全にカスタマイズし、全く新しいルック&フィールを与えることができます。 取引体験の向上: 視覚的に魅力的な取引環境は、見て楽しいだけでなく、金融市場の取引中の集中力を高めます。
使用方法 以下のビデオをご覧ください
FREE

Trend based on Extremum Levels and Volatility インジケータは、トレーダーが異なる時間枠でト レ ン ド の ブ レ ー ク ポ イ ン ト や 利 食 い の 可 能 性 の あ る レ ベ ル を 特 定 す る た め に 設 計 さ れ た 、便 利 な ツ ー ル で す 。
このインディケータは、FX、先物、株式、指数、コモディティ、 暗号通貨市場で使用できます。
この万能インディケータは、局所的な極値、ボラティリティ、平均 価格乖離に基づいてトレンドを構築し、小さなタイムフレームでも大きな タイムフレームでも使用できる貴重な情報を提供します。
Trend based on Extremum Levels and Volatility インジケータの特長は、入力パラメータに依存しない局所的な極値を考慮できる ことで、市場トレンドを分析するための、より客観的で信頼性の高いツールと なります。このアプローチにより、インジケータを過去のデータに当てはめ て収益性を誇張する可能性がなくなり、付加価値が高まります。これにより、
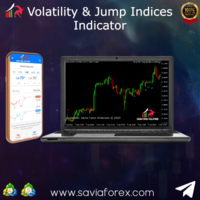
Volatility Index Pro Indicator The Savia Forex Solutions Volatility Index Pro Indicator gives you highly accurate entries on all Volatility Indices and Jump Indices. The Volatility Index Pro Indicator is dynamic and powerful and is optimized for all timeframes. Trade with improved confidence and maximize your success rate. Benefits Dynamic and Powerful. Volatility Index Pro Indicator is fully optimized for all chart timeframes. Volatility Index Pro Indicator works with Volatility Indices and Jum

The technical indicator, TrendGenius , is based on the values of statistical trading indicators. It allows you to predict the future value of an asset. Calculations are carried out according to a certain algorithm based on data on quotes for a certain period. The tool was created to simplify technical analysis and is used on various markets and exchanges, including cryptocurrency ones.
A change in direction, from the point of view of market fundamentals, means a shift in trading interest to

SmartTrend Analyzer is a reliable non-repainting indicator that will interest any trader.
SmartTrend Analyzer is a tool that analyzes all five aspects (opening price, high, low, closing price, and volume) based on mathematical calculations. With the algorithm of the forex indicator SmartTrend Analyzer, you can quickly determine which trend is developing in the market at the moment. The SmartTrend Analyzer technical indicator is presented on the chart as a set of points for easy interpretati

The "Trend Tandem" indicator is a trend analysis tool in financial markets that helps traders determine the direction of price movement.
Options:
RISK: Determines the level of risk taken into account in the trend analysis. The higher the value, the more aggressively volatility is taken into account. SSP (SSP Period): Defines the period of the moving average used to identify a trend. The higher the value, the smoother the trend signal will be. CountBars: Determines the number of bars on whic

The outside bar indicator shows a range of inside bars and the breakout up and down from the range. The breakout is always displayed at the start of a new range and is extended until another breakout. The calculation always takes place at the start of a new candle. So it is displayed accordingly in all time frames. In inside bar ( insidebar ) trading you can see the top and bottom of a range.
In outside bar ( outsidebar ) trading, the breakout from a range and thus the trend following.
The c
FREE

IDixie is an indicator which shows open and close values of the American dollar index, DXY or "Dixie". The indicator is calculated from weighted values of 6 major symbols: EURUSD, USDJPY, GBPUSD, USDCAD, USDSEK, and USDCHF. In addition to "Dixie" values, the indicator also shows a moving average. You can set the period of the moving average. When bars of the indicator break through the moving average, this creates good opportunities to enter the market. As a rule, signals from this indicator are
FREE

The "Trend Orbital" indicator is a tool for tracking trends in the financial asset market. It is based on the analysis of price data and provides a visual interpretation of the current direction of price movement.
Options: InpAmplitude: Amplitude - determines the amount of volatility that the indicator takes into account when determining the trend. Group "Arrow": InpCodeUpArrow: Up Arrow Code - Defines the arrow symbol to display an uptrend. InpCodeDnArrow: Down Arrow Code - Defines the arrow

This indicator is used to detect spike movements in Boom and Crash pairs in Deriv company and enter into transactions. The pairs used are Boom300, Boom500, Boom1000, Crash300, Crash500, Crash1000.
When the indicator gives an arrow sign in the expected direction, the transaction is entered and Stop Loss should be placed on the support/resistance areas shown by the indicator.
The indicator does not repaint. It is not used for trend following, but for entering transactions in the direction of

Boom and Crash Pro Indicator The Savia Forex Solutions Boom and Crash Pro Indicator gives you highly accurate entries on all Boom and Crash Indices. The Boom and Crash Pro Indicator is dynamic and powerful and is optimized for all timeframes. Trade with improved confidence and maximize your success rate. Benefits Dynamic and Powerful. Boom and Crash Pro Indicator is fully optimized for all chart timeframes. Whether price action is an uptrend, downtrend or trading sideways, Boom and Crash Pro Ind

The DYJ StochasticSignalSource is displayed as two lines. The main line is called %K. The second line, called %D, is a Moving Average of %K. The %K line is usually displayed as a solid line and the %D line is usually displayed as a dotted line. There are several ways to interpret a Stochastic Oscillator. four popular methods include: Buy when the Oscillator (either %K or %D) falls below a specific level (for example, 20) . Sell when the Oscillator rises above a specific level (for example, 80)
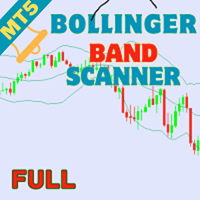
Welcome to the next level of trading sophistication with the Bollinger Bands Scanner for MT5! Elevate your trading experience and unlock enhanced insights and efficiency with our powerful MT5 indicator. Key Features: Effortless Bollinger Bands Scanning: Seamlessly harness the power of the Bollinger Bands Scanner to scan multiple assets effortlessly. Receive instant alerts when specific Bollinger Bands conditions are met, ensuring you're always ahead of market movements. Comprehensive Dashboard I
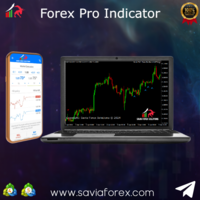
Savia Forex Pro Indicator (MT5) The Savia Forex Solutions Forex Pro Indicator gives you highly accurate entries on all Forex/Currency pairs, Indices and Cryptocurrencies. The Forex Pro Indicator is dynamic and powerful and is optimized for all timeframes and ALL Currency pairs, Indices, Commodities, and Cryptocurrency pairs. Trade with improved confidence and maximize your success rate. Benefits Dynamic and Powerful. Forex Pro Indicator is fully optimized for all chart timeframes. Forex Pro Indi

indicator is no repaint trend indicator. when white stars up to Red histogram that is probably end of long trades. when White stars up to Blue histogram that is probably end of down trades. indicator can use all pairs and lower than weekly charts, to use weekly chart need to at least 500 bars data on back.and lowering processing value 500. it is also suitable for 1m charts. indicator hold long way to go. there is not too many signals.

The MACD 2 Line Indicator is a powerful, upgraded version of the classic Moving Average Convergence Divergence (MACD) indicator.
This tool is the embodiment of versatility and functionality, capable of delivering comprehensive market insights to both beginner and advanced traders. The MACD 2 Line Indicator for MQL4 offers a dynamic perspective of market momentum and direction, through clear, visually compelling charts and real-time analysis.
Metatrader4 Version | All Products | Contac
FREE

This particular moving average adjusts to the average number of highest highs and lowest lows recorded over a defined period, thereby accommodating changes in trend strength. Utilizing this moving average in a crossover system or as dynamic support/resistance can yield compelling outcomes. Configuration: Length: Determines the indicator's period, with larger values delivering smoother outcomes. Application: The Dynamic Trend Adaptive Moving Average functions akin to conventional moving averages,
FREE

MOST is applied on this RSI moving average with an extra default option added VAR/VIDYA (Variable Index Dynamic Moving Average)
MOST added on RSI has a Moving Average of RSI and a trailing percent stop level of the Moving Average that can be adjusted by changing the length of the MA and %percent of the stop level.
BUY SIGNAL when the Moving Average Line crosses above the MOST Line
LONG CONDITION when the Moving Average is above the MOST
SELL SIGNAL when Moving Average Line crosses belo

QuantAlgo Signal is one of our best Premium Indicators.
It was designed with an intention of giving traders clear and precise entry signals.
It's main strength is in the possibility of simulating the trades and giving you realistic results.
With this features it is incredibly simple to find the settings you like the best!
QuantAlgo Signal is very simple to use, therefore it is suitable for both beginning and experienced traders.
Features: Precise Entries Backtesting simulation

1. CONSTITUTION Salmon Momentum is a momentum indicator based on the RSI. It consists of two momentum oscillators (Waterfall and Salmon) and three floating levels (upper, middler and lower). It is designed for the MT5 platform only. 2. OPERATION CONDITIONS Buy signal: When the Waterfall [thick line] is above the upper band. Salmon [dotted line] crosses middler band . Sell signal: When the Waterfall [thick line] is below the lower band. Salmon [dotted line] crosses middler band . 3. RECO

Introducing the 'No Nonsense Reversal Megaprofits' indicator for MetaTrader 5 (MT5), your ultimate tool for identifying trend reversals with precision and confidence. This powerful indicator is designed to cut through the noise of the markets and pinpoint crucial turning points with ease. Powered by advanced algorithms, 'No Nonsense Reversal Megaprofits' analyzes price action and key market dynamics to accurately detect when a trend is about to reverse. Whether you're a novice trader or a season
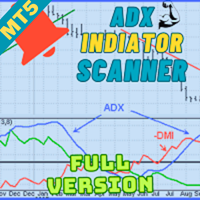
Welcome to advanced trading with the ADX Multicurrency Scanner for MT5! Elevate your trading experience with our powerful MT5 indicator, meticulously designed to offer seamless currency scanning and real-time insights. Key Features: Effortless Multicurrency Scanning: Unlock the full potential of the ADX Multicurrency Scanner for MT5 by effortlessly scanning multiple currencies. Receive instant alerts when specific conditions are met, ensuring you stay ahead of the market and capitalize on every
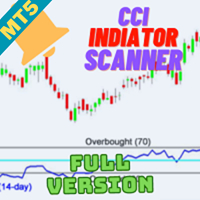
Welcome to the world of advanced trading with the CCI Multicurrency Scanner for MT5! Elevate your trading experience with our powerful MT5 indicator meticulously designed for seamless analysis and real-time insights. Key Features: Effortless CCI Scanning: Unlock the full potential of the CCI Multicurrency Scanner for MT5 by effortlessly scanning multiple currency pairs. Receive instant alerts when specific Commodity Channel Index (CCI) conditions are met, ensuring you stay ahead of market moveme
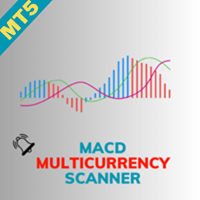
Welcome to the world of advanced trading with the MACD Multicurrency Scanner for MT5! Elevate your trading experience with our powerful MT5 indicator meticulously designed for seamless analysis and real-time insights. Key Features: Effortless MACD Scanning: Unlock the full potential of the MACD Multicurrency Scanner for MT5 by effortlessly scanning multiple currency pairs. Receive instant alerts when specific Moving Average Convergence Divergence (MACD) conditions are met, ensuring you stay ahea

This indicator obeys the popular maxim that: "THE TREND IS YOUR FRIEND" It paints a Blue line for BUY and also paints a RED line for SELL. (you can change the colors). It gives alarms and alerts of all kinds. IT DOES NOT REPAINT COLOR and can be used for all currency pairs and timeframes. Yes, as easy and simple as that. Even a newbie can use it to make great and reliable trades. https://www.mql5.com/en/market/product/115553

Welcome to the future of trading! Are you ready to elevate your trading game to new heights? Introducing a groundbreaking trading indicator that is set to redefine the way you approach the markets. With its unparalleled features and cutting-edge technology, this indicator is not just another tool in your arsenal – it's your secret weapon for success. Imagine having access to real-time alerts that keep you ahead of the curve, ensuring you never miss a lucrative opportunity. Picture a tool that w
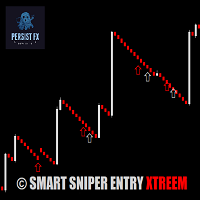
The Smart Sniper Entry XTREEM Spike Detector is a cutting-edge indicator specifically designed for traders who focus on the volatile Boom and Crash markets. This powerful tool detects spikes with an impressive 85% accuracy when combined with price action analysis.
*Key Features:*
- *High Accuracy:* 85% accuracy in detecting spikes, ensuring you can make informed trading decisions - *Market Specific:* Optimized for Boom and Crash markets, providing precise signals in these volatile environme

The "Moving Average Range Painter" is a robust MetaTrader 5 (MT5) indicator meticulously crafted to illustrate the fluctuating range between an exponential moving average (EMA) and a simple moving average (SMA) on any financial chart. This tool offers traders a comprehensive visual depiction of the price range within which an asset is oscillating. Here's a succinct interpretation of what this range signifies for technical analysis: Trend Dynamics : The range delineated by the EMA and SMA unveils
FREE
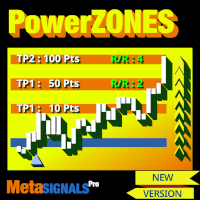
3,4,5回タッチされた戦略ゾーンを即座に取得し、価格を磁化します。>> パワーゾーンに応じたTP1/TP2/TP3のポイントまたはバリューを自動的に取得します。>> リスクとリワードの比率の安全性を視覚的にチェックします。 非リペイント、非遅延インディケータ - マニュアルおよび自動売買に最適 - すべての資産、すべての時間単位に対応 期間限定キャンペーン - その後 99ドルに戻る 購入後、 推奨セッティングについては、このチャンネルで私に連絡してください。 MT5 version | MT4 version
主な特徴 ダイナミックパワーゾーン: 本当に強いサポートとレジスタンスレベルを瞬時に視覚化し、正確なエントリー、ストップロス、TP1/2/3を可能にします。 カスタマイズ可能なアラート: ブレイクアウトイベントのカスタマイズ可能なアラートで、潜在的な取引機会をお知らせします。 マルチタイムフレーム分析: 異なるタイムフレームをシームレスに切り替えて、市場トレンドとプライスアクションを包括的に把握できます。 ユーザーフレンドリーなインターフェース:
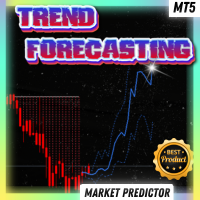
This indicator is unstoppable when combined with our other indicator called Katana . After purchase, send us a message and you could get Katana for FREE as a BONUS!
PROMO FOR THE MT5 version: $55 for a very limited time! Next price is $105. The Trend Forecasting indicator is a very unique & easy tool that is able to make prediction about future price movement based on the signals generated by MACD. It helps you have an estimation on the areas that the price may develop in

クリティカルゾーンは、より正確なマーケットエントリーを求める手動トレーダーのために特別に作成されました。このインディケータは、チャート上の最も関連性の高いサポートとレジスタンス、 およびそれらのブレイクアウトとリテストを計算することで、高度なアルゴリズ ムを使用して関心領域を検出します。このインディケータは、潜在的に有利な買い/売りの機会が検出された場 合にアラートと通知を送信するように設定でき、トレーダーが画面/ MT4 バージョンの前にいないときでも取引機会を把握することができます。
価格は$300に達するまで徐々に上昇します。次の価格 --> $69
特徴 リペイントなし このインディケータは、新しいデータが到着してもその値を変更しません 取引ペア すべてのFXペア 季節性 すべての季節性
パラメータ ===== サポートとレジスタンスの設定
計算のために参照するバー // サポートとレジスタンスのレベルを計算するために、現在のバーから 逆方向のバーの範囲。
===== 条件
ブレイクアウト // ブレイクアウト検出のオン/オフ

アカウントの残高とシンボルのスプレッドをリアルタイムで監視できる優れたユーティリティツール これにより、データを正確に特定する方法、たとえばプロップファームの口座を持っているかどうか、正しいラベレージやスプレッドが操作されているかどうかなどを知り、正確なロットを作成する方法がわかります。
レバレッジとスプレッドインジケーターの組み合わせ。 取引口座のレバレッジとスプレッドを自動チェックするためのツール。 すべてのブローカー外国為替株で働いています。 ブローカー外国為替のレバレッジ変更を監視したり、経済ニュースの発表中に拡散したりする場合に役立ちます。 現在のシンボルのリアルタイムスプレッドチェック。 取引口座のリアルタイムレバレッジチェック。 高速更新による分かりやすいデザイン 等
FREE

メタトレーダー用ボリュームプロファイルインジケーターで、ボリューム分析の威力を実感してください! / MT4バージョン
ベーシックボリュームプロファイルは、取引の最適化を目指すマニュアルトレーダーのために特別に設計されたインジケーターです。ボリューム・プロファイル・インジケータは、市場の動きをより深く理解したい本格的なトレーダーにとって不可欠なツールです。当社の革新的なソリューションにより、取引量が価格にどのように分布しているかを明確かつ簡潔に視覚化することができます。これにより、支持線・抵抗線、集積・分配ゾーン、重要なコントロール・ポイントなど、主要な注目エリアを特定することができます。特定の日の取引量を表示する通常の出来高インジケーターとは異なり、ベーシック・ボリューム・プロファイルは特定の価格における取引量を表示します。
当社のインジケータは、直感的でカスタマイズ可能なインターフェイスを備えており、お客様の取引の好みに合わせてカスタマイズすることができます。
特徴 価格チャート上に出来高プロフィールを明確に表示。 出来高の多いエリアと少ないエリアを素早く識別。

Volatility Doctor RSIをご紹介します。これは、信頼できるRSI指標を基に構築された画期的なツールであり、これまでにないトレーディング体験を提供するために設計されています。
当社のインジケーターは、リアルタイムのRSI読みを提供するだけでなく、選択した時間枠と好きな取引シンボルにおいて、RSIの読みが将来の10ステップ先にどこに位置するかを正確に予測します。
適応型インテリジェンス:このツールは市場に適応し、あなたのユニークなトレーディング戦略にシームレスに統合され、意思決定プロセスを向上させます。
Volatility Doctor RSIで今日からトレーディングを高めましょう。
あなたに平和と繁栄、そして利益をもたらす取引を願っています。
Gamuchirai Zororo Ndawana
Volatility Doctor.
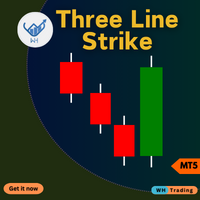
MetaTrader 5 (MT5) 用の ThreeLine Strike インジケーター 。この高度なツールは、市場における潜在的な反転を正確かつ簡単に特定できるように設計されています。
初心者でも経験豊富なトレーダーでも、このインジケーターは取引の意思決定を強化し、利益を最大化することができます。 Contact me after purchase for guidance 主な特徴: 正確な反転シグナル : テクニカル分析で実証済みのローソク足形成である 3 本のラインのストライク パターンに基づいて、潜在的なトレンドの反転を検出します。 カスタマイズ可能な設定 : ストライクパターン、時間枠、視覚的な設定を調整可能なパラメータを使用して、インジケーターを自分の取引スタイルに合わせてカスタマイズします。 リアルタイムアラート : 3 本の線のストライクパターンが形成されると即座に通知が届くので、重要な市場機会を逃すことはありません。 ユーザーフレンドリーなインターフェース : 直感的なデザインにより、シグナルを簡単に解釈し、取引戦略に統合できます。 互換性 : 既存の MT

Structure Blocks: a structured way to analyze market structure
This indicator is for you if you are a price action or smart money concept trader. It identifies market trends' ultimate highs and lows and intermediaries' swing lows and highs. It adjusts based on candles' body where most of the volume is, disregarding wicks. Need help or have questions? I am Lio , don't hesitate to reach out! I am always available to respond, help, and improve. How it works:
Each block consists of a move wit
FREE

Breakouts with strong momentum are challenging to catch. The purpose of the Super Breakouts Monitor is to identify such market conditions. This indicator is inspired by a concept from renowned Technical Analyst Tushar Chande, who combines two highly adaptive indicators, VIDYA and the Dynamic Momentum Index (both his creations), to capture the early stages of a successful breakout. At Minions Labs, we've added our unique enhancements to adapt these great ideas for modern markets like stocks, cryp

Chart Clarity Dashboard
The Chart Clarity Dashboard provides clear insights into price movements for various financial instruments like currency pairs, cryptocurrencies, equities, commodities, and indices. This dashboard displays detailed price information in real-time, making it easier for traders to make decisions quickly. It shows price movements down to the second, giving you essential data before you trade or analyze charts. Chart Clarity Dashboard allows you to monitor price changes acr

High Low Swing (HLS) Indicator
The HLS indicator is a technical analysis tool designed to identify swing highs and lows in the market, aiding swing traders in making informed decisions. It offers an adjustable "degree" parameter, allowing you to customize the sensitivity to strong price movements based on current market conditions.
Features:
• Clear Buy/Sell Signals: The indicator plots signals directly on the chart, simplifying trade identification.
• Adjustable Swing Strength: The "
FREE
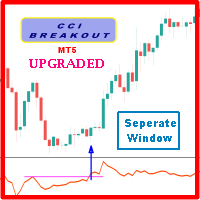
Probability emerges to record higher prices when Commodity Channel Index breaks out oscillator historical resistance level when exhibit overbought values. Since, oscillator breakout of support and resistance have similar effect as price breaks support and resistance levels, therefore, its highly advised to confirm price breakout with oscillator breakout; certainly, will have the same output in short trades. Concept is based on find swing levels which based on number of bars by each side of peak
FREE

Volume Clarity Pro The Volume Clarity Pro provides clarity in the movement of price for any financial instrument, including currency pairs, cryptocurrencies, equities, commodities and indices. The Volume Clarity Pro maps out where price is consolidating, retracing, resisting or settled in areas of support. The Volume Clarity Pro accurately displays the month's price action, offering crucial data about your selected trading pair for chart analysis and trade initiation. The Volume Clarity Pro is

This comprehensive technical indicator calculates and plots up to 3 moving averages with 3 different periods. By employing three moving averages of distinct lookback periods, the trader can confirm whether the market has indeed experienced a change in trend or whether it is merely pausing momentarily before resuming its prior state. SX Golden MA Pack for MT4 is available here . The shorter the moving average period, the more closely it tracks the price curve. When a security initiates an upt
FREE

Subscribe to the 'MA7 Trading' channel to receive notifications about new programs, updates and other information. Ask questions in the profile on the MQL5 .
Description of work
The 'MA7 Clover' indicator is based on candle shapes. Shows the 'Pin Bar' candle pattern. Detailed information about the 'MA7 Clover' indicator.
Indicator settings
General settings: Min body size ; Max body size ; Min nose size ; Max nose size .
Message settings: Send message to the terminal (Alert) – permission

This DYJ PowerSignalSource is a complete trading system based on ATR technical indicators. This indicator will analyze and record the trend intensity of each cycle and current currency pair from M1-MN
DYJ PowerSignalSource creates a trend intensity and entry point signal list display by evaluating this data. When the trend percentage reaches 75% or greater, we consider it a strong currency. If the trend intensity percentage reaches 100%, we consider it the strongest, and a warning will pop up
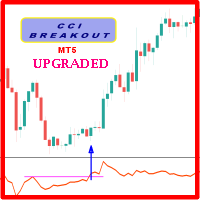
Probability emerges to record higher prices when CCi oscillator breaks out oscillator historical resistance level when exhibit overbought values. Since, oscillator breakout of support and resistance have similar effect as price breaks support and resistance levels, therefore, its highly advised to confirm price breakout with oscillator breakout; certainly, will have the same output in short trades. Concept is based on find swing levels which based on number of bars by each side of peak or troug
FREE

This script provides a moving average tailored for use as a signal line in a moving average crossover system. The moving average will maintain a divergence from the price during ranging markets, while aligning closely with a regular moving average during trending markets. Settings Length : Period of the moving average How to Use Moving average crossover strategies often incorporate a "signal" line, a slower moving average used to gauge the overall trend. This signal line works alongside a faste
FREE

Bollinger Bands % or Bollinger Bands Percentage is one of the indicators used in the Sapphire Strat Maker - EA Builder .
It is calculated using the following formula:
Perc = (CLOSE_PRICE - LOWER_BOLLINGER) / (UPPER_BOLLINGER - LOWER_BOLLINGER) * 100
Thus, by taking the difference between closing price to the lower band and dividing it by the difference of the upper and the lower price levels of a Bollinger Bands indicator, we can calculate this indicator.
It shows how far the price is f
FREE

Higher Timeframe Chart Overlay will display higher timeframe candles, including the number of candles high/low you specify.
You no longer need to switch timeframes to check the candles. Everything can be shown in one chart. Get Full Version - https://www.mql5.com/en/market/product/115682 Please feel free Contact me if you have any questions regarding this tool.
FREE

The Breakout Line in technical analysis serves as a crucial tool for understanding market dynamics and potential shifts in price direction. It's designed to highlight rapid accelerations or declines in the market's trajectory. Unconventional Analysis : The Breakout Line is not your typical technical indicator; it's tailored to capture swift market movements, offering a unique perspective on price trends. Angle of the Breakout Line : The sharper the angle formed by the Breakout Line, the stronger

Expected Range is a great tool for understanding the possible price deviation from daily open price.
This Indicator can be interpreted as follows --> I want to identify a price level with an "x%" probability of the price revisiting it.
Then you choose these "x%" price levels and the indicator is gonna find them for you.
So for example, if you select value of 15, it means that the indicator is gonna find you a price level which has a 15% chance of price revisiting it.
You can choose up
FREE

I'm excited to introduce you to the fifth bar on Martin Armstrong's Forecast Array - The Trading Cycle .
This innovative tool represents a transverse form of cyclical frequency analysis, offering a unique perspective on market trends.
The model employs a color-coded system for easy interpretation. In this model, green signals the ideal timing for highs, red indicates ideal lows, and yellow signifies a convergence of highs and lows occurring simultaneously. This intuitive approach allows

This indicator generates a moving average that adjusts towards the price as a trend continues to form new higher-highs or lower-lows, based on the identified trend. Settings Length : Determines the initial smoothing factor of the moving average (2 / (Length + 1)), and also sets the period for calculating rolling maximums/minimums. Increment : Controls the increment in smoothing factor (2 / (Increment + 1)) for each new higher-high or lower-low. Lower values result in a faster converging moving
FREE

The Squeeze Index aims to measure the action of price being squeezed, and is expressed as a percentage, with higher values suggesting prices are subject to a higher degree of compression.
Settings
Convergence Factor: Convergence factor of exponential envelopes.
Length: Period of the indicator.
Usage
Prices being squeezed refer to the action of price being compressed within a tightening area. Prices in a tight area logically indicate a period of stationarity, price breaking out of
FREE

BS Time Band是一个很好的波段交易指示器,这个指标可以单独使用,但是最好是配合 StartPoint 一起使用效果更好,适用于任何时间框架,非常适合喜欢做波段交易的朋友。它能很好的体现出一个波段的完整信息,你可以很快的从这个指示器上寻找到最佳的预警区域,然后配合 StartPoint 找到最佳的buy位置和最佳的sell位置,也能很好根据指示器去坚守自己的持仓定订单。指标不含有未来函数,不会重新绘制,不仅能够应用到自己的手动交易过程中,还能完全可以写入到自己的EA中。(如果你感觉到这个指标能够帮助你进行更准确的交易,请帮忙给个好评,希望我的作品能够帮助更多有需要的人) =================参考使用方法=================== 此指标可以适用于任何交易品种。 做波段建议参数 timeFame:M5 如果配合 StartPoint 建议 StartPoint 的参数为(240,60)
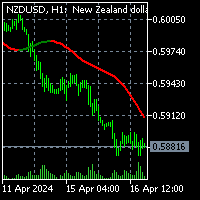
To download MT4 version please click here. - This is the exact conversion from TradingView: "Sentiment Range Ma" By "ChartPrime". - This is a non-repaint and light processing load indicator - You can message in private chat for further changes you need. - All input options are available. - Buffers are available for processing within EAs. - Highlight option is omitted as does not show good in Metatrader.

To download MT4 version please click here .
- This is the exact conversion from TradingView: " PA-Adaptive Hull Parabolic " By "Loxx".
- This is a non-repaint and light processing load indicator
- You can message in private chat for further changes you need.
- All input options are available.
- Buffers are available for processing within EAs.
- Highlight option is omitted as does not show good in Metatrader.
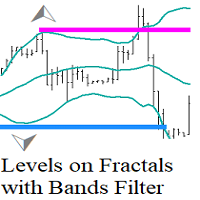
Levels on Fractals with Bands Filter は、ボリンジャーバンド・インディケータでフィルタリングされたフラクタルに基づくレベルです。
Levels on Fractals with Bollinger Bands Filterは、フラクタルの組み合わせとボリンジャーバンドインジケータを使用してサポートレベルとレジスタンスレベルを特定するテクニカル分析ツールです。
使い方
フ ラ ク タ ル が ボ リ ン ジ ン ガ ー バ ン ド の 外 側 バ ン ド の 後 ろ に 形 成 さ れ る と( ボ ラ ティリティ・ブレイクアウト)、価格が極端な水準に達し、方向転換する可 能 性 が あ る こ と を 示 し ま す 。
これらのレベルは、支持線と抵抗線として使用できます。
フ ラ ク タ ル が ボ リ ン ジ ン ガ ー バ ン ド の 上 位 バ ン ド よ り 上 に 形 成 さ れ た 場 合 は レ ジ ス タ ン ス レ ベ ル と な り 、下 位 バ ン ド よ り 下 に 形 成 さ れ た 場 合 は サ
FREE

移動平均線付き出来高は、移動平均線を使ったシンプルで分かりやすい出来高インジケーターです。
使い方は?
サポート/レジスタンス・レベルやトレンド・チャネルのボラティリティ・ブレイクアウトからエントリーする際のシグナルのフィルタリングに適しています。また、出来高によってポジションを決済するシグナルにもなります。
入力パラメータ
Volumes - リアルまたはティックの出来高。 MA_period - 移動平均期間。
移動平均線付き出来高は、移動平均線を使ったシンプルで分かりやすい出来高インジケーターです。
使い方は?
サポート/レジスタンス・レベルやトレンド・チャネルのボラティリティ・ブレイクアウトからエントリーする際のシグナルのフィルタリングに適しています。また、出来高によってポジションを決済するシグナルにもなります。
入力パラメータ
Volumes - リアルまたはティックの出来高。 MA_period - 移動平均期間。
FREE

Trend Master Chart、必要なトレンド指標です。 チャートをオーバーレイし、色分けを使用してさまざまな市場のトレンド/動きを定義します。 2 つの移動平均と異なるオシレーターを組み合わせたアルゴリズムを使用します。 これら 3 つの要素の周期は変更可能です。 どの時間枠やペアでも機能します。
上昇トレンドまたは下降トレンド、およびこのトレンドへのさまざまなエントリーポイントを一目で識別できます。 たとえば、顕著な上昇トレンド (薄緑色) では、このトレンド内のさまざまな市場インパルスが濃い緑色のローソク足で表示されます。 設定可能なアラートを使用すると、これらの衝動を決して見逃すことがなくなります。
MT4のバージョンです。
入力パラメータ:
Period 1: 高速期間移動平均。
Period 2: 低速期間の移動平均。
Oscillator period: オシレーター周期。
Sell/Buy alert: 市場衝動アラート、トレンドエントリーポイント。 Bullish/Bearish alert: トレンドが
FREE

「NakaTrend」をご紹介します:MetaTrader 5向けの究極のトレンド検出器!
取引体験を革命化する準備はできていますか?NakaTrendは、トレンドの変化を精密かつ簡単に特定するための頼りになるインジケーターです。
NakaTrendを使用すると、市場の変化を見逃すことはありません。上昇トレンドが発生すると、NakaTrendは緑のドル記号でそれを示し、買い注文を入れるタイミングを示します。そして、トレンドが下降に転じると、赤いドル記号が現れ、売り注文を入れる絶好のタイミングを示します。
しかし、それだけではありません:NakaTrendは、手動で注文を入力できるようにすることで、取引をコントロールする力を与えます。あなたの直感とNakaTrendの洞察力が、利益をもたらす結果に導くでしょう。
推測や時代遅れの指標に依存する日々は過ぎ去りました。NakaTrendは、信頼できる明確で実行可能なシグナルを提供するために高度なアルゴリズムを活用しています。
そして、NakaTrendはMetaTrader 5内で直接動作するため、取引ルーティンに統合す
FREE

NakaSideをご紹介します - あなたの究極の市場機会指標!
利益の出る取引の機会を見逃すことにうんざりしていますか?取引を次のレベルに引き上げる準備はできていますか?もう探す必要はありません。NakaSideが登場し、取引方法を革命へと導きます!
NakaSideは単なる一般的な指標ではありません。複雑な金融市場を自信を持ってかつ正確に航海するための秘密兵器です。高度なアルゴリズムと先進的なテクノロジーを駆使して、NakaSideは上昇トレンドと下降トレンドの両方でトレンドの変化を検出し、利益の出る機会を見つけるように設計されています。
NakaSideが上昇トレンドの変化を検出すると、鮮やかな緑色のドル記号が表示され、購入の機会があることを示します。逆に、トレンドが反転すると、目立つ赤いドル記号が表示され、売却の機会があることを示します。
しかし、ここでNakaSideが本当に際立つのは、トレンドの特定に留まらないところです。他の人が苦労する横ばい市場では、NakaSideが光を放ち、チャート全体に複数のドル記号を散りばめ、多数の潜在的なエントリーポイントを示

Pips Hunter PRO は数年かけて開発され、前作の改良版です。この強力なインジケーターは、マーケットと価格の履歴を分析し、売買エントリーを生成します。これらのエントリーの計算には、複雑な統計的対数だけでなく、連動する様々なインジケーターを使用し、不利なエントリーをフィルタリングして排除します / MT4バージョン 。 ストラテジーの高い効率性を維持するための絶え間ない探索により、価格は徐々に上昇し、1000ドルに達します。次回価格→ 69ドル
特徴 リペイントなし
このインディケータは、新しいデータが到着してもその値を変更しません
ラグなし このインディケータはラグがありません 取引ペア
すべてのFXペア (できればEURGBP)
時間枠
すべての時間枠
パラメータ ===== 表示
矢印の距離 // シグナル(矢印)とローソク足の距離
===== アラート
ポップアップアラート // MT4ターミナル用のアラート
プッシュ通知 // 携帯電話向けアラート
メールアラート // メールアラート
===== チャ

Moving Average Scanner、チャートを変更せずに複数の時間枠にわたる傾向を一目で確認するのに最適なマルチタイムフレーム スキャナーです。
9 つの時間単位にわたって、選択した最大 4 つの移動平均を使用できます。 これは完全に構成可能で、単に「ドラッグ アンド ドロップ」するだけでグラフ上のどこにでも移動できます。
移動平均は 4 つの異なる計算方法で設定できます。 移動平均の数と期間の数に基づいてアラートを設定することもできます。
MT4版はこちら。
入力パラメータ:
スクリーナーのレイアウト:
グラフ上に表示されるスキャナーの希望のサイズと表示テキストのサイズを調整できます。
移動平均:
4 つの異なる移動平均期間と 4 つの計算方法 (単純/指数/平滑化および線形加重) を設定できます。
アラート:
アラートを設定するには、アラートをトリガーするために選択した移動平均と組み合わせた希望の時間枠数 (強気/弱気) を選択するだけです。
ポップアップ/プッシュ通知とメールでアラートが可能。 アラートテキ

WHY IS OUR FXACCCURATE LS MT5 THE PROFITABLE ? PROTECT YOUR CAPITAL WITH RISK MANAGEMENT
Gives entry, stop and target levels from time to time. It finds Trading opportunities by analyzing what the price is doing during established trends. POWERFUL INDICATOR FOR A RELIABLE STRATEGIES
We have made these indicators with a lot of years of hard work. It is made at a very advanced level.
Established trends provide dozens of trading opportunities, but most trend indicators completely ignore them!

** NOTE: This indicator uses realtime data. Thus DO NOT download Demo version. If you still need demo version, please refer to free version .
Symbol Chart Changer is an indicator/utility that offers you the option to switch between symbols and timeframes.
You can choose any symbol and timeframe on the same chart with just a few clicks. In addition, this indicator also shows the profit of the symbol through the color of the buttons.
Features: Click buttons on the chart to monitor all your
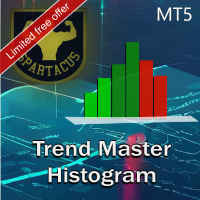
トレンド チャート ヒストグラムは、2 つの移動平均と複数のオシレーターを使用するアルゴリズムに基づくインジケーターです。 カラーコードのおかげで、トレンドを素早く特定し、市場の最大の衝動を利用することができます。
明るい色はトレンドを示し、暗い色は衝動を示し、灰色は市場に参入すべきではないことを示します。
MT4版はこちら。
入力パラメータ:
- 期間 1 (高速期間)
- 期間 2 (低速期間)
- 発振器周期
次の 2 種類のアラートを有効にできます。
- 弱気/強気アラート (市場のトレンドが変化したとき)。
- 売買アラート(強い衝動がある場合)。
アラートのテキストは完全にカスタマイズ可能で、好きなものを入力できます。
アラートはポップアップ、電子メール、プッシュ通知で利用できます。
SPARTACUS2024

This indicator can be used to display Support and Resistance levels according to the Malaysian SNR concept , in which Support and Resistance are exact levels of a line chart. Malaysian SNR
There are 3 different horizontal levels in Malaysian SNR: A-Level : This level is located at the peak of this line chart. (shape looks like the letter A) V-Level : Level at the valley of a line chart, (shape looks like the letter V) Gap-Leve l: This level is located at the Close/Open gap between two cand

Higher Timeframe Chart Overlay will display higher timeframe candles, including the number of candles high/low you specify.
You no longer need to switch timeframes to check the candles. Everything can be shown in one chart. MT4 Version : https://www.mql5.com/en/market/product/115680 Almost everything can be change as you want. You can change/set:
- Choose different colors for the body and top/bottom wicks.
- Panel's height and width.
- The width of the body and wicks
- Change backgrou
MetaTraderマーケットは、履歴データを使ったテストと最適化のための無料のデモ自動売買ロボットをダウンロードできる唯一のストアです。
アプリ概要と他のカスタマーからのレビューをご覧になり、ターミナルにダウンロードし、購入する前に自動売買ロボットをテストしてください。完全に無料でアプリをテストできるのはMetaTraderマーケットだけです。
取引の機会を逃しています。
- 無料取引アプリ
- 8千を超えるシグナルをコピー
- 金融ニュースで金融マーケットを探索
新規登録
ログイン