YouTubeにあるマーケットチュートリアルビデオをご覧ください
ロボットや指標を購入する
仮想ホスティングで
EAを実行
EAを実行
ロボットや指標を購入前にテストする
マーケットで収入を得る
販売のためにプロダクトをプレゼンテーションする方法
MetaTrader 5のための新しいテクニカル指標

MonetTrend — Премиум-индикатор для торговли по тренду (M30, H1, H4)
MonetTrend — это мощный и визуально понятный трендовый индикатор, созданный для торговли на таймфреймах M30, H1 и H4. Он идеально подходит для работы с волатильными инструментами, такими как: • Золото (XAUUSD) • Криптовалюты (BTCUSD) • Валютные пары (EURUSD, USDJPY и др.)
Ключевые особенности MonetTrend: • Автоматическое отображение Take Profit 1 (TP1) и Stop Loss (SL): После появления сигнала индикатор сразу показывает: • TP
Haven CBDR は、ICTの「Central Bank Dealers Range(CBDR)」をチャート上に表示する、使いやすいインジケーターです。このプログラムは、CBDRの価格レンジを示す長方形を描画し、さらに標準偏差ラインを追加表示して、サポートとレジスタンスの可能性のある水準を確認できます。CBDRの時間帯、表示するカレンダー日数、色、グラフィック要素のスタイルなどを自由に設定でき、チャートのテーマに合わせて配色も自動調整されます。また、日足ローソクの始値を示す垂直線も描画し、市場の動きを把握しやすくします。 その他の製品 -> こちら トレーダーの使い方: パラメータ設定:
必要に応じて、セッションの開始・終了時間を調整し、表示設定(色、長方形の枠線スタイル、標準偏差ライン、マーカーなど)をカスタマイズします。 レンジ分析:
表示された長方形を活用して、選択した期間内のCBDR価格帯を素早く視覚的に確認できます。標準偏差ラインによって、反転やトレンド継続の可能性のあるレベルを特定できます。 トレードシグナルの探索:
日足ローソクの始値を示す垂直線と、セッション
FREE

シンプル、直接的、そして効率的 — それが Bars Trend and Pivot Support の真髄です。
このシステムを使用すると、グラフ上での分析を容易にする直感的なツールを利用できます。選択した期間に基づいて重要なサポートとレジスタンスを自動的にマークし、ピボット ラインを強調表示します。これらはすべて、ユーザーの好みに応じて有効化および無効化のオプションを備えています。
ダッシュボードには、D1、H4、H1、M30 の時間枠でのローソク足の方向も明確に表示され、さまざまな取引アプローチに不可欠な戦略的洞察が提供されます。
さらに、システムは現在のスプレッドと次のローソク足の形成までの残り時間を実用的な方法でチャートに統合して通知します。
私のメインインジケーター「ブルートフォーストレンド」と一緒に使用してください: https://www.mql5.com/en/market/product/132647?source=Site +Market+My+Products+Page
FREE

Crystal Volume Indicator – MT5のためのスマートなボリューム分析ツール Crystal Volumeは、価格の動きの背後にある隠れた市場の強さを視覚的に解釈するために設計された、先進的で使いやすいボリューム分析インジケーターです。価格アクションとボリュームのダイナミクスを組み合わせて、 Buying Climax(買いのクライマックス) 、 Selling Climax(売りのクライマックス) 、 弱いローソク足 などの重要なイベントを強調表示し、反転や継続の可能性があるゾーンを簡単に見つけられるようにします。 主な機能: 実際のボリューム分析(ティックまたはリアルボリュームに対応) カラー付きヒストグラム 買い・売りのクライマックス検出 弱いローソク足をハイライト トレンド確認用の移動平均ライン カスタムルックバックウィンドウ ローソク足方向によるカラー設定オプション ボリュームイベントの分類: 買いのクライマックス:非常に高いボリューム、高値でクローズ 売りのクライマックス:非常に高いボリューム、
FREE

SMCセッションインジケーターは 、ICTコンセプト、流動性ハント、 セッションベースの戦略 に頼る スマートマネートレーダー 向けに作られた高精度ツールです。機関投資家レベルのトレーダーが使用する最も実績のある人気のコンセプトを使用して、重要なセッションベースの取引ゾーンをシームレスにマッピングします。このオールインワンセッションインジケーターは、 ICTアジアレンジ、ロンドンブレイクアウト、ニューヨークレンジ、ICTロンドンオープンキルゾーン、ICTニューヨークオープンキルゾーン、オープニングレンジブレイクアウト(ORB) ( ロンドン、ニューヨーク、東京を カバー)、強力な ミッドナイトオープニングレンジ など、最も効果的で確率の高いレンジ戦略をチャートにオーバーレイします。また、 シドニー、東京、ロンドン、 ニューヨーク などの 主要な外国為替取引セッション も強調表示します。各レンジは 、タイムボックス手法を使用して最高の精度で描画され、 主要な FVG(フェアバリューギャップ)、レンジスイープ、セッションの高値/安値、 および潜在的な マーケットメーカーの操作ゾーン

簡単に本当の市場の強さを見抜く — 初心者でも安心。
MSI(モメンタム・シャドウ・インジケーター)は初心者にもプロにも最適です。
市場に本当に勢いがあるかどうかを示してくれるので、自信を持って「買い」や「売り」の判断ができます。 迷わない。推測しない。
本物かどうかを教えてくれるシンプルなラインだけ。 とても使いやすい — すべてのレベルに対応
明確な売買シグナル
20分以上のチャートで最も効果的、スキャルピングにも対応 合成ボラティリティ指数で最も効果を発揮します。ニュースの影響を受けないため、純粋なモメンタムシグナルを得られます。
仕組み:
チャート上に3本のラインを表示: 短期トレンドライン(黄色) 長期トレンドライン(青色) 過去の価格を追うモメンタムシャドウライン(白色) 上昇シグナル:
価格が黄色と青色のラインを上抜け、シャドウも上にある場合:
強い上昇モメンタムを示し、買いのチャンス。 下降シグナル:
価格が両ラインを下抜けし、シャドウも下にある場合:
強い下降モメンタムを示し、売りのチャンス。 シャドウが価格と一致していない場合、モメンタムが

Volume Thermal Visionでボリュームの力を体感 トレーディングを次のレベルへ引き上げる準備はできていますか?MetaTrader 5用の究極のボリュームインジケーター、Volume Thermal Visionを紹介します。ボリューム分析を戦略的優位に変えるこのインジケーターは、高確率のトレード機会を見極めたいトレーダー向けに開発され、VSA(Volume Spread Analysis)、ICT(Inner Circle Trader)、SMC(Smart Money Concepts)、Wyckoffなどの手法に最適です。EURUSD、GBPUSD、US30などの通貨ペア/インデックスの市場動向を解読するのに役立ちます。 なぜVolume Thermal Visionを選ぶのか? 高度なボリューム分析: 12段階のカラーレベルでボリュームの強弱を可視化し、蓄積、分配、機関トレーダーの動きを鮮明に捉えます。 独自のビジュアルプロトコル: Tactical、StealthMode、ThermalVision、NightVisionの4モードから選択可能。あなたのトレー

KT Fair Value Gap(FVG)は、市場における一時的な価格の不均衡ゾーンを特定し、視覚的に強調表示します。これらのギャップは、価格が継続する可能性のあるエリアとして機能するほか、時には反転ポイント(逆FVGとも呼ばれる)となる場合もあります。 強気のFVG: 緑色のボックスで表示され、上昇の勢いが再開される可能性のあるサポートゾーンとして機能します。価格がこのゾーンを埋めた後には、反転のきっかけとなることもあります。 弱気のFVG: 赤色のボックスで表示され、下降が継続される可能性のあるレジスタンスゾーンとなります。強気FVGと同様に、埋められた後に価格の反転が起こることがあります。
特徴 シンプルで見やすい設計: FVGゾーンを明確に表示するために一から設計されており、チャートの視認性を高め、トレーダーが集中しやすくなっています。 インサイトダッシュボード: 画面上のコンパクトなパネルにより、未処理(未補完)および処理済みのFVGの割合を一目で確認できます。 完全にカスタマイズ可能: FVGの閾値、処理済み/未処理のギャップの表示、色や線の太さまで自由に調整できます。

**ICT OrderFlow Matrix** *機関投資家の需給の隠れた痕跡を表示します。*
---
### 機能概要 ICT OrderFlow Matrix は、銀行、ヘッジファンド、プロプトレーディングデスクが集中して注文を配置する正確なゾーンを自動で特定しプロットします。これらのOrder Blocksは真のサポート&レジスタンスレベルとして機能し、手動描画は不要です。
---
### 主な機能 - **Order Block 検出** 価格変動をスキャンし、機関投資家の需給バランスの歪みを検出、シェーディングされた S/R ゾーンとして表示。 - **動的なゾーン削除** タップまたはブレイクされたゾーンはフェードアウトし、チャートは有効なレベルのみに集中します。 - **プロップデスクゾーン強調** プロのトレーディングチームが監視する反応可能性のあるエリアをマーキング。 - **カスタムアラート** ゾーンに価格が到達すると、ポップアップ、メール、モバイル通知で知らせます。
---
##
Volume Thermal Vision Basicは、著名なVolume Thermal Visionインジケーターの簡易版であり、ボリュームの強度を実用的かつ効率的に分析したいトレーダーのために設計されています。6種類の鮮やかな色で構成され、StealthMode、NightVision、FrostVisionなどの表示モードを備えています。これにより、ボリュームデータを戦略的かつ視覚的に明確に把握することが可能です。初心者にとっても使いやすく、また上級トレーダーの補助分析ツールとしても最適です。MQL5 Marketで完全版にアップグレードすれば、さらなる機能と分析オプションが利用可能になり、トレード戦略の強化と意思決定の最適化に貢献します。
FREE
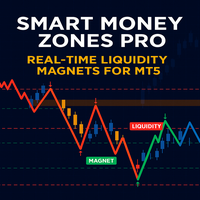
SM Zones Proインジケーターの機能をより深く理解したい場合は、まず無料のSM Zonesインジケーターをダウンロードして試してみることをお勧めします。このインジケーターは、単一のEURUSD銘柄を様々な時間枠で使用できるように調整されています。SM Zonesは、こちらのマーケットからダウンロードできます。SMZones Proは、SM Zonesとは異なり、最大10種類の銘柄を同時に分析できます。
スマートマネーマネジメント戦略の原則に基づいて開発されたSM Zones Proインジケーターは、MetaTrader 5 (MT5)プラットフォームのトレーダーにとって非常に便利なツールです。SM戦略で使用されるすべての重要なゾーン(市場構造、流動性が高まる価格水準、銘柄の価格が向かう「価格マグネット」ゾーン(不均衡、注文ブロック、fvg、ブレーカーブロック、緩和ブロック))をチャート上にグラフィカルに表示します。強気相場に影響を与えるゾーンは緑色で、弱気相場に影響を与えるゾーンは茶色で強調表示されます。これらのレベルは、価格変動の可能性のある領域を反映しており、多くの場合
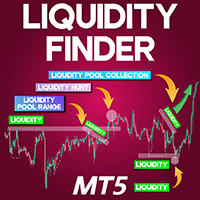
Liquidity Finder Indicator MT5
The Liquidity Finder Indicator MT5 is a specialized tool developed for the MetaTrader 5 platform, created to detect zones of market liquidity. This indicator functions by plotting both fixed and dynamic liquidity levels on the price chart. Blue-colored lines indicate zones of liquidity near recent highs, while red lines mark zones near significant lows. Static lines often align with common chart structures such as Double Bottoms and Double Tops, giving visual clar
FREE
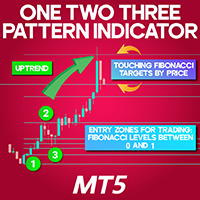
1-2-3 Pattern Indicator for MetaTrader 5
The 1-2-3 Pattern Indicator for MetaTrader 5 is a strategic analytical tool designed to pinpoint potential reversal zones in the financial markets. This indicator automatically identifies three significant swing points, forming a ZigZag structure that outlines the price path and calculates Fibonacci levels based on those decisive pivots. «Indicator Installation & User Guide» MT5 Indicator Installation | One Two Three 123 Pattern Indicator MT4 | ALL
FREE

Welcome. This tool is designed to help traders monitor the critical price level at which the account's margin level reaches 100%, providing valuable insights for risk management in trading. Advisor Description The "Margin Level 100%" indicator is a custom technical indicator for MetaTrader, designed to calculate and display the critical price level for a specific symbol where the account's equity equals its margin, resulting in a margin level of 100%. This level is crucial as it indicates the
FREE
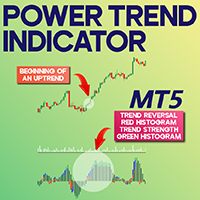
Power Trend Indicator for MetaTrader 5 The Power Trend Indicator for MetaTrader 5 is a dynamic trading utility designed to help traders pinpoint both the direction and momentum of ongoing market trends. This oscillator uses a color-coded histogram to visually represent trend strength. A red bar signifies a trend shift, blue indicates mild trend activity, green denotes strong momentum, and black reflects a flat or indecisive market. It's particularly useful for spotting trend reversals and rapid
FREE
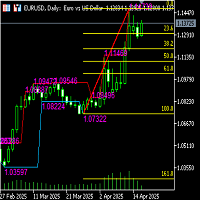
Functional description of automatic Fibonacci line indicator (including high and low channel lines) Indicator name Automatic Fibonacci retracement line + high and low channel auxiliary
Functional introduction This indicator combines the automatically identified high and low points of the band, automatically draws the Fibonacci retracement/extension line, and draws the highest and lowest price channel lines of the current analysis interval to provide traders with clearer support/resistance refe
FREE
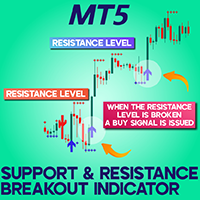
Support Resistance Breakout Indicator (SRBAI) download for MetaTrader 5 The Support Resistance Breakout Arrows (SRBA) indicator serves as a precision tool for mapping key price areas based on pivot structures. Specifically designed for MetaTrader 5 (MT5), the SRBAI indicator marks support zones with blue and resistance zones with red lines. Upon a confirmed breakout beyond these zones, it signals buying opportunities with blue arrows or selling opportunities with red arrows, accompanied by on-sc
FREE
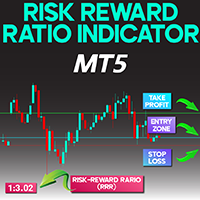
Risk Reward Indicator for MetaTrader 5
The Risk Reward Indicator for MetaTrader 5 is crafted to evaluate and display the Risk-to-Reward Ratio (RRR) with precision, placing the calculated value directly onto the trading chart.
This advanced risk assessment tool showcases the RRR in the upper-left corner of the screen and marks essential trade levels using three clearly defined horizontal lines:
• Green Line: Target Profit (TP)
• Red Line: Protection Stop (SL)
• Blue Line: Entry Point (EP) «Indic
FREE
A simple plotting box for your TP and SL markers. The best use case is showcasing signals to your community. I also have MT2DC, which can be used to submit signals to Discord via webhook. By utilizing this indicator, your followers can quickly see the open position along with its TP and SL levels. The indicator also displays the average open price, allowing you to set SL above the average for a safer trade Kindly leave 5-star rating and share with your friends if you like this indicator.
FREE
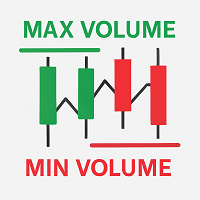
MaxVolumeTrendLines
This indicator visualizes the bars with the highest tick volume for each trading day, highlighting price levels where buyers or sellers showed notable activity. Description MaxVolumeTrendLines automatically detects the bar with the highest tick volume within each day (for a selected number of days) and displays horizontal lines on the chart: Green line at the Low — for bullish bars (close above open). Red line at the High — for bearish bars (close below open). Line thicknes
FREE

Discover the power of harmony in the markets with this advanced harmonic pattern indicator. Designed for demanding technical traders, this indicator automatically detects 11 of the most popular harmonic patterns, including the Gartley, Bat, Crab, Butterfly, Shark, Cypher, and many more.
Thanks to its dynamic dashboard, you can easily manage the visibility of patterns on the chart, activating or deactivating the ones you want in real time without overloading your platform. This flexibility allo
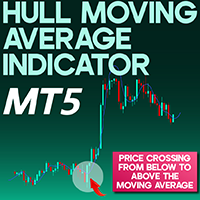
Hull Moving Average Indicator MetaTrader 5
The Hull Moving Average (HMA), developed by Alan Hull, offers a refined alternative to conventional moving averages by delivering faster responsiveness and improved trend accuracy. Integrated into the MetaTrader 5 (MT5) platform, this indicator is tailored to help traders better recognize short-to-medium-term market directions. By using the Hull MA, traders can fine-tune their trade entries and exits with enhanced timing. «Indicator Installation & User
FREE
Elevate Your Trading with Advanced Anchored Volume Weighted Average Price Technology Unlock the true power of price action with our premium Anchored VWAP Indicator for MetaTrader 5 - the essential tool for precision entries, strategic exits, and high-probability trend continuation setups. Write me a DM for a 7 day free trial. Anchored VWAP Plus gives traders unprecedented control by allowing custom anchor points for Volume Weighted Average Price calculations on any chart. With support for 4 sim
FREE

Welcome to the "Breakeven Line" indicator, version 1.1, developed by Sergei Ivanov in 2025. Visualize breakeven price levels for your trades with precision and ease. Advisor Description The "Breakeven Line" is a MetaTrader (MQL5) indicator that displays breakeven price levels for open buy and sell positions on the current symbol, factoring in commissions and swaps for accurate risk management. Key Features: Dual Lines: Plots Buy Breakeven (Dark Violet) and Sell Breakeven (Deep Pink) lines, show
FREE
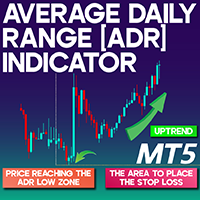
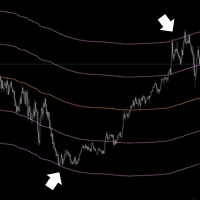
Average Daily Range (ADR) Indicator for MetaTrader 5 The Average Daily Range (ADR) Indicator for MetaTrader 5 is a powerful analytical tool developed for monitoring average price fluctuations within a trading day. It serves as an essential asset for evaluating market dynamics and intraday volatility. A price movement reaching the ADR High can indicate a potential exhaustion among buyers, often hinting at an upcoming pullback. Conversely, when the price moves toward the ADR Low, it might represen
FREE
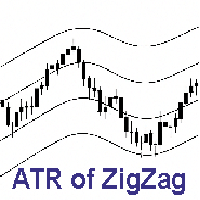
ZigZag Channel Indicator – A Simple Way to Read Market Structure! This indicator automatically calculates the average distance of ZigZag waves and draws a visual channel:
The upper line reflects the average distance of upward waves.
The lower line reflects the average distance of downward waves. Instantly understand market rhythm and price swings.
Use it to identify targets, exits, reversals, and false breakouts.
Perfect for trend analysis, pattern recognition, and measuring move str
FREE
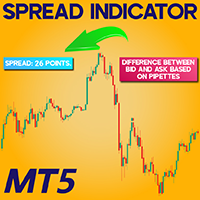
Spread Indicator download For Meta Trader 5
The Spread Indicator is a practical utility designed for MetaTrader 5 (MT5) that highlights the gap between the Bid and Ask prices directly on the chart. Positioned in the upper-left corner of the screen, it presents the current spread in real-time using pipettes (points), providing traders with a clear view of market costs. «Indicator Installation & User Guide» MT5 Indicator Installation | Spread Indicator Download for MT4 | ALL Products By Trad
FREE

RSI Heatmap Indicator for MetaTrader5
The RSI Heatmap Indicator for MetaTrader5 is a powerful visual tool designed to measure the momentum of multiple currency pairs based on the Relative Strength Index (RSI). It detects and highlights overbought and oversold conditions across several timeframes and displays them in a heatmap located at the bottom left section of the chart. This visual representation helps traders quickly assess the overall market sentiment. Green tones signal potential buying
FREE

Crystal Volume Profile Auto POC Indicator by Muhammad Jawad Shabir
Version: 1.74 Crystal Volume Profile — Smart Volume Visualization for Precise Trading Decisions Crystal Volume Profile is a lightweight yet powerful indicator developed for MetaTrader 5, designed to provide traders with a clear and insightful view of market volume activity. Whether you're a day trader or swing trader, this tool enables you to identify high-impact price levels by highlighting where trading volume is most conc
FREE
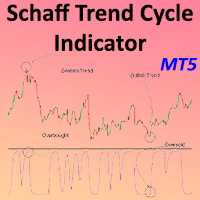
Schaff Trend Cycle Indicator for MetaTrader5
The Schaff Trend Cycle Indicator for MetaTrader5 is a momentum-based oscillator that helps detect potential reversal zones on the price chart. It is built using a hybrid model of the MACD (Moving Average Convergence Divergence) and the Stochastic Oscillator. This indicator marks readings below the 25 level as potential buying zones (oversold), while values above 75 suggest overbought conditions. The visual movement is depicted by a curved purple line
FREE

The VIX Index, or CBOE Volatility Index, is an indicator designed for MetaTrader 5 that transforms historical volatility into an easy-to-interpret oscillator, placing the volatility range between 0 (minimum) and 100 (maximum) based on a configurable normalization period.
Unlike a simple ATR, this oscillator shows you on the chart when volatility is abnormally low or high compared to its recent behavior. Additionally, the indicator provides context and information about the famous VIX Volatility
FREE
As the suggested, with this indicator you are able to switch from one symbol or timeframe to another in the same single chart. So forget about opening tons of chart on your screen! It's not designed for ICT or SMC trader, but if you are that kind of trader you still can use it. Imagine you have a strategy containing various indicators and settings, on a single chart you can screen the entry opportunity then move to the next symbol or timeframe.
FREE
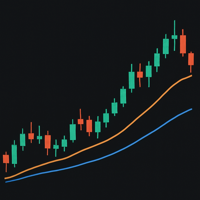
The 13- and 21-period exponential moving averages (EMA) on a 15-minute gold chart are used to identify short-term trends and potential trading signals. When the 13-period EMA crosses above the 21-period EMA, it is considered a bullish signal indicating a possible price increase. Conversely, when the 13-period EMA crosses below the 21-period EMA, it is considered a bearish signal indicating a possible price decline.
These crosses are used to determine entry and exit points. For example, when a
FREE
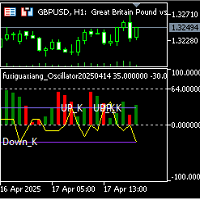
Fuxi Hexagram Oscillation Signal Alert Indicator — An Innovative Trading Tool Combining I Ching Philosophy with Modern Quantitative Analysis 1. Product Overview The Fuxi Hexagram Oscillation Signal Alert Indicator is a cutting-edge technical analysis tool that integrates ancient Chinese I Ching (Book of Changes) philosophy with modern financial market data analysis. By converting K-line (candlestick) chart behavior into dynamic hexagram structures, the indicator provides traders with real-time t
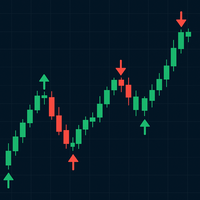
Trend Mark is a versatile trading indicator designed to highlight high-probability entry points using visually intuitive arrows directly on the chart. It analyzes price action and market momentum to identify potential trend reversals or continuations, displaying upward or downward arrows when specific trade conditions are met. Suitable for both beginners and experienced traders, Trend Mark can be used across multiple timeframes and instruments, making it a powerful tool for scalping, day trading

AstroBias Indicator: Precision in the Angle of Your Trend The AstroBias Indicator is more than just a trend direction tool. It also tracks the change in the angle of the price slope , allowing traders to filter signals using angular filters . This makes it especially useful for building automated trading bots based on its signal logic. Key Benefits of AstroBias Indicator Highly Sensitive to Price Action AstroBias responds quickly to real-time price movements, providing clear and timely sign

Sonic Edge Meter: Precision for Reversals and Price Surges Sonic Edge Meter is a powerful indicator built on original algorithms for extremum detection . It’s specifically designed to identify market reversals and sharp directional moves , giving you a clear signal before they happen. How Does Sonic Edge Meter Work? The indicator notifies you of potential turning points or price spikes by displaying visual markers directly on the chart:
Blue dot — signal to buy
Red dot — signal to sell
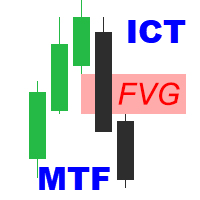
ICT Fair Value Gaps MTF Unlock the power of Fair Value Gaps (FVGs) across multiple timeframes using the ICT Fair Value Gaps Multi - Timeframe Indicator —a precision tool built for traders who follow the Smart Money Concept (SMC) . Key Features : Multi-Timeframe FVG Detection : Automatically identifies Fair Value Gaps from higher timeframes (M15, H1, H4, etc.) and plots them on your active chart for immediate insight. Break of Structure (BOS) & Change of Character (CHoCH): Clearly marked BOS

Candle Confirm Color
What Is It?
The Candle Pattern Confirmations is an advanced indicator for MetaTrader 5 (MT5) designed to identify and confirm candlestick patterns with high probability of trend reversal or continuation. It visually highlights candles that form Engulfing (Bullish/Bearish) and Inside Bars patterns, assisting traders in making more assertive decisions with real-time confirmation.
Main Features
Automatic Pattern Detection
- Detects Bullish Engulfing and Bearish Engulfin
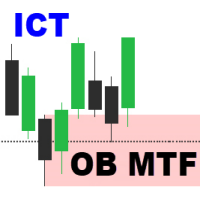
Order Block Multi Timeframe The Order Block Multi Timeframe is a powerful tool for Smart Money Concept (SMC) traders, combining high-accuracy Order Block detection with real-time Break of Structure (BOS) and Change of Character (CHoCH) analysis across multiple timeframes. Smart Money Insight, Multi-Timeframe Precision This indicator automatically identifies institutional Order Blocks —key price zones where large players have entered the market—and plots them directly on your chart. It also track

This MT5 indicator provides real-time updates of classic Renko charts. Renko charts focus on price movement, filtering out noise and highlighting trends. What are Renko candles? Renko charts display price movement using "bricks" of equal size, ignoring time. A new brick is drawn only when the price moves by a specified amount. They help visualize trends by removing time-based noise.
Parameters - BrickSizePoints (20): Renko brick size in points - HistoryDepthSec (3600): Historical data to ini
FREE

Multi-MA Ribbon Overlay (6 EMAs + 250 SMA)
This indicator displays six exponential moving averages (15, 25, 35, 45, 60, 70)(YOU CAN CHANGE THE VALUES) and a slow 250-period simple moving average to help visualize market momentum and trend structure. It’s designed as a clean trend-ribbon for scalpers, intraday, and swing traders. ️ Disclaimer:
Trading forex and CFDs on margin carries a high level of risk and may not be suitable for all investors. Leverage can work for or against you. Always u
FREE

This is a Free Display Dashboard for The ArbitrageATR Recovery MT5 EA. This indicator is used to track existing Total hedge positions (Account Summary) , Balance, Equity, P/L and Symbols, Correlation Status. Please adjust size and colours according to your desired preference. Feel free to message me if there are any queries required. Please note that this an indicator and not a Utility or Expert Advisor.
LINK TO THE EA: https://www.mql5.com/en/market/product/131269?source=Site+Market+Product+
FREE

Pivot Points Indicator – Your Technical Compass in the Market Unlock powerful levels of market structure with our Pivot Points Indicator – a classic tool enhanced for modern trading! Designed for MetaTrader5, this indicator automatically calculates and displays daily, weekly, or monthly pivot levels along with key support and resistance zones. Whether you're a scalper, day trader, or swing trader, pivot levels help you identify potential reversal points , entry zones , and take-profit targ
FREE

Fractal Model Indicator for Metatrader , meticulously crafted around the renowned Fractal Model by TTrades. This powerful tool empowers traders to navigate price action with precision, leveraging multi-timeframe analysis to anticipate momentum shifts, swing formations, and trend continuations. Designed for MetaTrader , the Fractal Model Indicator combines advanced algorithmic insights with customizable features, making it an essential addition for traders seeking to capitalize on expansive mar

This indicator is converted from Pinescript to MQL5 and consisting of buffers for the range lines as well, its not only object.
The Range Detector indicator aims to detect and highlight intervals where prices are ranging. The extremities of the ranges are highlighted in real-time, with breakouts being indicated by the color changes of the extremities.
USAGE Ranging prices are defined by a period of stationarity, that is where prices move within a specific range.
Detecting ranging marke

The Accumulation and Distribution indicator is a volume-based indicator that was essentially designed to measure underlying supply and demand. This is accomplished by trying to determine whether traders are actually accumulating (buying) or distributing (selling). This is accomplished by plotting a cumulative total of the money flow volume for each period. This indicator can reveal divergences between volume flow and actual price to primarily affirm a current trend or to anticipate a future reve
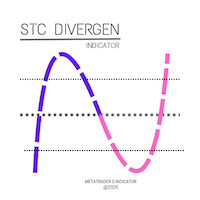
Overview The Stochastic Divergence Indicator is a powerful tool designed to detect potential market reversals by combining the popular Stochastic Oscillator with divergence analysis. Divergence occurs when the price moves in the opposite direction of the indicator, signaling a possible trend exhaustion or reversal. This indicator visually marks bullish and bearish divergences on the chart, helping traders make informed decisions with greater confidence. Key Features • High Accuracy (No Repaint)

Alwinson Active Trades Info Simple. Informative. Instantly Visible on Your Chart. Alwinson Active Trades Info is a lightweight custom indicator that displays a real-time summary of your currently open trades —right on your chart. No more switching tabs just to see what pairs are active and how much lot size is in play. Key Features: Displays a list of all symbols with open positions in your trading account. Shows the dominant position type (BUY or SELL) per symbol. Calculates and displays t

To get access to MT4 version please contact via private message. This is the exact conversion from TradingView: "3rd Wave" by " LonesomeTheBlue ". The screenshot shows similar results from tradingview and Metatrader when tested on ICMarkets on both platforms. This is medium-load processing indicator and updates are available per bar close. This is a non-repaint indicator. All input options are available. Buffers are available for processing in EAs. You can message in private chat for further cha

Zone to Zone Indicator for MT5 Unleash the full potential of your trading strategy with the "Zone to Zone" indicator for MetaTrader 5. This advanced tool provides unparalleled precision and versatility, making it an essential addition to any trader's toolkit. Key Features: MT5 Compatibility : Seamlessly integrates with the MetaTrader 5 platform for a smooth and efficient trading experience. Accurate Historical Resistance/Support Zones : Effortlessly draw and identify key resistance and support

Do you find it difficult to track and manage your open positions across multiple different symbols in MetaTrader 5? Do you need a quick and comprehensive overview of your current market exposure and the performance of each symbol individually? The "Dynamic Exposure Table" indicator is your ideal tool! This indicator displays a clear and detailed table in a separate window below the chart, summarizing all your open positions and intelligently grouping them by symbol, giving you a complete view of

When there is no position, when changing the color, you can consider opening an order. With the fluctuation of the market, when the current color changes again, you need to close the position and leave. Suitable for different cycles, the trading rules are simple and require friends to explore on their own.
I hope friends who use this indicator can make a lot of money, rolling bigger and bigger like a snowball. thank you!

The TrendKiller Oscillator is a custom MetaTrader 5 (MT5) indicator designed to help traders analyze price deviations from a moving average, displayed in a separate window. It calculates the difference between a chosen price (e.g., close) and a moving average (default: 14-period SMA), producing a detrended value that oscillates around a zero line. Dynamic maximum and minimum levels, computed over a user-defined period (default: 50 bars), provide context for identifying overbought/oversold condi

SpectralEdge Periodogram - Cycle Analysis Indicator
Overview
The SpectralEdge Periodogram is a powerful technical analysis indicator for MetaTrader 5, designed to uncover hidden price cycles in financial markets using Fast Fourier Transform (FFT). By transforming price data into the frequency domain, this indicator reveals the dominant cycles driving market movements, enabling traders to identify repeating patterns and make informed trading decisions. Whether you're a day trader, swing trader

Este indicador calcula e exibe no gráfico o preço justo do mini índice (WIN) com base em dados fundamentais do mercado. Além disso, ele traça automaticamente linhas de suporte e resistência percentuais , ajudando você a visualizar zonas importantes de preço. É como ter uma régua financeira no gráfico, mostrando onde o preço "deveria estar", de forma objetiva, considerando o cenário macroeconômico!
O indicador usa uma fórmula de precificação de contratos futuros baseada em: O preço à vista do Ib

Fibonacci Trend Indicator for MT5 Unlock the power of Fibonacci analysis on your MetaTrader 5 charts!
Our Fibonacci Trend Indicator automatically plots dynamic support and resistance levels so you can spot trends, reversals, and breakout opportunities at a glance. Features & Advantages Automatic Fibonacci Levels
Instantly displays seven key Fibonacci retracement levels based on the highest and lowest prices from your chosen lookback period — no manual work required. Dynamic Trend Adaptatio
FREE

Percentage Range Consolidation O Percentage Range Consolidation é um indicador poderoso projetado para identificar zonas de consolidação de preço com base em variações percentuais ao longo do tempo. Ideal para traders que buscam detectar áreas de compressão de volatilidade e possíveis pontos de ruptura (breakout). Principais características: Identifica até 3 zonas de consolidação simultâneas, cada uma configurável de forma independente. Cálculo baseado na variação percentual entre a máxima e mín
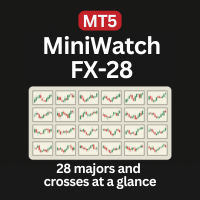
Monitor all 28 Forex pairs at once — clean mini charts, real-time price action, perfect for consistent price pattern traders. Designed for consistent, mechanical, and hybrid traders who repeatedly trade the same price action patterns — such as triangles, flags, trends, and supply/demand zones — across multiple symbols, without relying on indicators.
Core Features: Displays all 28 major Forex pairs in mini chart format , organized in a clean 4-row by 7-column layout. Powered by live price action
FREE

このインジケーターを購入された方には、以下の特典を 無料 で提供しています:
各トレードを自動で管理し、ストップロスとテイクプロフィットを設定し、戦略ルールに基づいてポジションを決済する補助ツール 「Bomber Utility」 様々な銘柄に合わせたインジケーターの設定ファイル(セットファイル) 「最小リスク」、「バランスリスク」、「待機戦略」 の3つのモードで使用できる Bomber Utility 用の設定ファイル このトレーディング戦略をすぐに導入・設定・開始できる ステップバイステップのビデオマニュアル ご注意: 上記の特典を受け取るには、MQL5のプライベートメッセージシステムを通じて販売者にご連絡ください。 オリジナルのカスタムインジケーター 「Divergence Bomber(ダイバージェンス・ボンバー)」 をご紹介します。これは、MACDのダイバージェンス(乖離)戦略に基づいた 「オールインワン」型のトレーディングシステム です。
このテクニカルインジケーターの主な目的は、価格とMACDインジケーターの間に発生するダイバージェンスを検出 し、将来の価格の動きを示す

NOTE: CYCLEMAESTRO is distributed only on this website, there are no other distributors. Demo version is for reference only and is not supported. Full versione is perfectly functional and it is supported. CYCLEMAESTRO , the first and only indicator of Cyclic Analysis, useful for giving signals of TRADING, BUY, SELL, STOP LOSS, ADDING. Created on the logic of Serghei Istrati and programmed by Stefano Frisetti ; CYCLEMAESTRO is not an indicator like the others, the challenge was to inter

Candle Volume Strength は、買い手と売り手の間で進行中の戦いについての洞察を提供する高度なボリューム分析インジケーターです。リアルタイムのボリューム シフトを計算して視覚化し、トレーダーがブレイクアウト、トレンド、リトレースメント、反転をより正確に確認できるようにします。
主な特徴: ボリュームベースの確認 – このインジケーターはティックボリュームの変化を監視し、買い手と売り手の間で市場力が移行したときに警告を発します。 トレンドとブレイクアウトの検証 – ボリューム分布を分析することで、トレーダーは市場トレンドとブレイクアウト シグナルの強さを確認できます。 反転とリトレースメントの検出 – ボリューム パターンは、価格変動の潜在的な転換点を特定するのに役立ちます。 サポートとレジスタンスの洞察 – 主要レベル付近でのボリュームの増加により、信頼性が向上します。 シンプルで効果的な視覚化 - 買いと売りの強さをヒストグラム バーとして表示し、簡単に解釈できるようにします。 Candle Volume Strength は、トレーダーがボリューム分析を活用し

ゼロラグEMAインジケーター(AI最適化)——プロ仕様の取引ツール
従来の移動平均の遅延を排除した次世代ソリューション。AI最適化アルゴリズムで市場の動きをリアルタイムに捕捉し、先手を打ちます。 主な機能: AI高速処理 : 遅延ほぼゼロ。トレンド転換を瞬時に検出。 多市場対応 : 外国為替、株式、暗号資産、商品に最適。 クリアなトレンド表示 : ノイズを除去し重要なシグナルを強調。 早期シグナル : 通常のEMAより早く強気/弱気の動きを捕捉。 動的な色変化 : 緑/赤のカラーシフトで方向を即時認識。 カスタマイズ可能 : 期間と価格ソースを自由に設定。 マルチタイムフレーム : 1分足から月足まで対応。 柔軟な戦略設計 : RSI、MACD、フィボナッチと併用可能。 選ぶ理由: 実戦検証済みアルゴリズム : ライブ環境で信頼性を証明。 初心者からプロまで : 簡単操作で高精度な結果。 市場適応力 : あらゆる相場環境で有効。 対象ユーザー: 迅速なシグナル確認を求めるトレーダー。 遅延による損失を削減したい投資家。 テクニカル分析ツールのアップグレードを目指す方。 AIが切り開く
FREE

I am a trader specializing in the development of rare , exclusive , high-performance trading bots designed for serious traders who are committed to achieving consistent profitability and success. This free indicator is more than just a visual tool—it powers the Midnight Throttle EA , an automated trading system that executes trades based on the precise market conditions this indicator observes. Midnight Watch : A Pro-Level Tool for Precision Market Analysis. An advanced , multi-functional MetaTr
FREE

RSI ABCDパターンファインダー:テクニカル戦略 1. インジケーターの仕組み 古典的RSI と ABCD調和パターン の自動検出を組み合わせたものです。 主要コンポーネント 標準RSI (調整可能な期間) 高値・安値マーカー (矢印) ABCDパターン (緑/赤の線) 過買(70)・過売(30)フィルター 2. MT5設定 period = 14 ; // RSI期間 size = 4 ; // 最大パターンサイズ OverBought = 70 ; // 過買水準 OverSold = 30 ; // 過売水準 Filter = USE_FILTER_ YES ; // 確認フィルター 3. 取引戦略 3.1. 買いエントリー(強気ABCD) 条件: RSIが以下を形成: 谷( A )→ 山( B )→ より高い谷( C ) D が過売域(30)より上だが C より下 確認:A-B-C-Dを結ぶ緑色の線 目標: TP1: B-Cの61.8% TP2: B-Cの100% ストップロス: D より下 3.2. 売りエントリー(弱気ABCD) 条件: RSIが以下を形成: 山( A
FREE
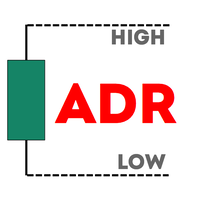
Haven Average Daily Range は、Forexやその他の市場における金融商品の平均日中レンジを計算し表示するインジケーターです。 その他の製品 -> こちら 主な特徴: 複数の期間(5日、10日、20日)に基づくADRの計算 レンジに到達した際にスタイルが自動で変更されるADRレベルの表示 取引日の開始と終了の明確な視覚的表示 表示設定のカスタマイズ(色、線の太さなど) より視覚的にわかりやすくするための価格ラベルの表示 このインジケーターは、トレーダーがボラティリティを評価し、反転の可能性のあるレベルを特定し、その日の取引目標を計画するのに役立ちます。 D1までのすべてのタイムフレームとあらゆる取引商品に対応しています。 トレーディングでの活用方法: ADRは、さまざまな方法で取引判断を下すのに効果的に使用できます。価格がADRの上限に近づいた場合、それは売りゾーンの可能性を示し、特に他の売られすぎのシグナルと組み合わせた場合に有効です。同様に、下限に到達した場合は買いのチャンスを示唆します。 また、このインジケーターを使えば、その日のさらなる値動きの可能性を評
FREE
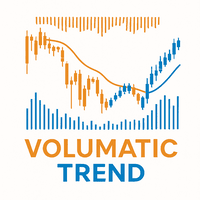
Volumatic Trend is a powerful, trend-following indicator that merges directional analysis with real-time volume behavior. By combining adaptive trend logic and volume overlays, it gives traders a detailed snapshot of market conviction and potential turning points. From instant trend shift detection to volume-weighted candle visuals, this tool brings deeper context to price movement. MT4 Version - https://www.mql5.com/en/market/product/136210/ Join To Learn Market Depth - https://www.mql5.co
FREE
「この秘密のトレーディングツールはプロップ会社によって禁止されている(彼らはあなたに知られたくない!)」
EAなしで究極のトレーディング・エッジを発見!(トレーダーのために、トレーダーによって作られました。 ロボットではなく、純粋なトレーディング・パワーです。)
偽のブレイクアウト、突然の反転、市場操作に苦戦していませんか?この強力なトレーディングツールは、マーケットが速く動くときでも、レーザー精度のシグナルを提供します! --------------------------------------------------------------------------------------------------- 私のおすすめ:- 最高の電波強度設定 FXペア、金、指数、暗号通貨など、あらゆる種類のシグナルに対応。 ご希望のTFを選択し、バックテスト前に入力タブからシグナル値を変更してください。 >> ( 4または5 ) >> 1m / 5m / 15m / 30m / 1H / 4H の場合 >> (2または3) >>日足/週足/月足用 -----------------

マルチタイムフレーム・キャンドル インジケーターは、トレーダーが短期の時間軸分析を高期の時間軸構造と整合させるのに役立つ強力な視覚化ツールです。選択した高期の時間軸(H1、H4、D1など)のキャンドルを現在のチャートに直接プロットすることで、チャートを切り替えることなく、市場全体の状況をより明確に把握できます。
このインジケーターが必要な人は誰ですか? このツールは次の場合に最適です。 スマート マネー コンセプト (SMC) / ICT より低い時間枠で取引を実行しながら、より高い時間枠のバイアスを利用するトレーダー。 日次またはセッションの勢いと同期を維持したいスキャルパーとデイトレーダー。 小さなチャートでエントリーを洗練させながら、HTF 構造をざっと確認したいスイング トレーダー。
価格アクション、需要と供給、またはトレンドフォローシステムのいずれを取引する場合でも、このインジケーターにより、エントリーはより長い時間枠の強さによって裏付けられます。
戦略の改善 マルチタイムフレームキャンドルは、次の点の改善に役立ちます。 方向性バイアスの確認 – 支配的なトレンドまた
Linear Trend Predictor ー - エントリ ポイントと方向サポート ラインを組み合わせたトレンド インジケーター。高値/安値チャネルを突破するという原理に基づいて機能します。
インジケーターのアルゴリズムは市場のノイズをフィルタリングし、ボラティリティと市場の動向を考慮します。
インジケーターの機能
平滑化手法を使用して、市場のトレンドと、買い注文または売り注文を開くためのエントリー ポイントを表示します。 任意の時間枠のチャートを分析して、短期および長期の市場の動きを判断するのに適しています。 あらゆる市場や時間枠に適応可能な入力パラメータにより、トレーダーはインジケーターを独自にカスタマイズできます。 設定されたインジケーター信号は消えず、再描画もされません。ローソク足の終値で決定されます。 いくつかの種類の通知が矢印と組み合わされています。 このインジケーターは、独立した取引システムとして使用することも、他の取引システムへの追加として使用することもできます。 あらゆるレベルの経験を持つトレーダーが使用できます。
主なパラメータ
Vol
MetaTraderマーケットは自動売買ロボットとテクニカル指標を販売するための最もいい場所です。
魅力的なデザインと説明を備えたMetaTraderプラットフォーム用アプリを開発するだけでいいのです。マーケットでプロダクトをパブリッシュして何百万ものMetaTraderユーザーに提供する方法をご覧ください。
取引の機会を逃しています。
- 無料取引アプリ
- 8千を超えるシグナルをコピー
- 金融ニュースで金融マーケットを探索
新規登録
ログイン