YouTubeにあるマーケットチュートリアルビデオをご覧ください
ロボットや指標を購入する
仮想ホスティングで
EAを実行
EAを実行
ロボットや指標を購入前にテストする
マーケットで収入を得る
販売のためにプロダクトをプレゼンテーションする方法
MetaTrader 4のためのエキスパートアドバイザーとインディケータ - 45

This is an unconventional version of the Heiken Ashi Smoothed indicator implemented as lines rather than a histogram. Unlike a usual histogram, the indicator draws the readings of the two moving averages in the form of colored lines.
Example If the candle crosses two indicator lines upwards, a trend is assumed to be changing from bearish to bullish. If the candle crosses two indicator lines downwards, a trend is assumed to be changing from bullish to bearish. The indicator is good at displayin
FREE

Blahtech Moving Average indicator is a multitimeframe version of the standard Moving Average indicator. It is also enhanced with customisable alerts, period breaks and other configuration options. The 50 day and 200 day moving averages are widely followed by investors and traders, with breaks above and below the MA lines considered to be signals of interest. Links [ Install | Update | Training | All Products ]
Feature Highlights Up to three timeframes Configurable calculation variab
FREE

The utility is designed to open Buy and Sell market orders and close all positions. Opening and closing positions by pressing the hot key. How to open and close positions with voice using the utilities of this type, see in the video under the description. https://www.youtube.com/channel/UCTpVWJkEic6TzoXr0qc9RIw/featured The keys "1", "2", "3", "4", "5", "6", "7", "8", "9", "0" send a request to open Buy orders with predefined values Lot , Take Profit, Stop Loss, Magic. The keys "Q", "W", "E", "
FREE

Multicurrency and multitimeframe modification of the indicator Bollinger Bands. On the dashboard you can see breakouts and touches of the Bollinger Bands. In the parameters you can specify any desired currencies and timeframes. The indicator can also send notifications when the price touches the Bollinger Bands, when the current volatility changes (expands or falls), and when the price touches all the bands. By clicking on a cell with a period, this symbol and period will be opened. This is MTF

Candle High Low
Indicator showing High and Low of X candles across a line.
Settings Candle number for calculation (>= 1 ) - Define the number of candles for the indicator to find the maximum and minimum of that period of candles. Continuation of the line's display to the right - If you want the High and Low line to extend to the right edge of the graph Line High Color - Set line color Line High Style - Set line style Line Low Color - Set line color Line Low Style - Set line style
FREE

こちら のMQL5コミュニティのKoala Trading Solutionチャンネルに参加して、最新のシグナルやKoalaのすべての製品に関するニュースを入手しましょう。参加リンクは以下にあります: https://www.mql5.com/en/channels/koalatradingsolution 説明 :
外国為替市場(PSAR)で専門的で人気のあるインジケーターの1つに基づいた新しい無料インジケーターをご紹介します。このインジケーターは元のパラボリックSARインジケーターの新しい変更です。プロSARインジケーターでは、ドットと価格チャートのクロスオーバーを見ることができます。クロスオーバーはシグナルではありませんが、動きの終わりの可能性について話します。新しい青いドットで購入を開始し、最初の青いドットの1 atr前にストップロスを配置し、最後にドットが価格チャートを横切るとすぐに終了できます。
売買シグナルを開く方法は? 最初の青い点によるオープンバイトレードと最初の赤いドットによるオープンセルトレード
正しいストップロスはどこにありますか? 安全なス
FREE

Rung トレンドインジケーター。インディケータは、価格変動の主な傾向を識別し、さまざまな色でマークしますが、主な傾向に対するノイズや短期的な価格変動を排除し、反応しません。 インディケータは、市場の現在のトレンドを決定するツールです。デフォルト設定では、価格がチャネル内で移動すると、インジケーターは上昇傾向(「強気」トレンド)、インジケーターは緑色の線でマークされ、下降トレンド(「弱気」)トレンドは赤色の線でマークされます。 、インジケーターは反応しません。コリドーまたは横方向の価格変動の値は、インジケーターの設定によって調整できます。
インジケーター設定の説明 striction_points-コリドーのサイズ(ポイント単位)。 factor_smoother-平滑化係数。 アラート-ユーザーデータを含むダイアログボックスを表示します。 Text_BUY-買いシグナルのカスタムテキスト。 Text_SELL-売りシグナルのカスタムテキスト。 Send_Mail- [メール]タブの設定ウィンドウで指定されたアドレスにメールを送信します。 件名-電子メールの件名。 Send_N
FREE
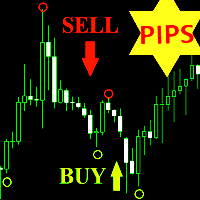
Pips Scalper Indicator - スキャルピング戦略に興味のあるトレーダーのために特別に設計された外国為替取引指標です。 スキャルピングは、トレーダーが小さな値動きの断片によって有利な取引を試みる取引戦略です。
インジケーターの使い方は?
インジケーターが通貨ペアのチャート上に緑色の円を描いたら、買い取引を開始し、20 ~ 25 ポイントのショート テイクプロフィットを設定します。 シグナルの 87% で、価格は矢印の方向に少なくとも 20 ピップス進みます。 したがって、このインジケーターを使用してスキャルピング システムで取引すると、1 日に複数の注文を開くことができます。 ストップロスを75ポイントのレベルに設定します。 または、価格が逆方向に期間 27 の移動平均を横切るとき。 インジケーターがチャート上に赤い円を描いたら、売り注文をオープンし、20 ~ 25 ポイントの量でショートのテイクプロフィットも設定します。 ストップロスを75ポイントのレベルに設定します。 または、価格が逆方向に期間 27 の移動平均を横切るとき。
Pips Scalpe
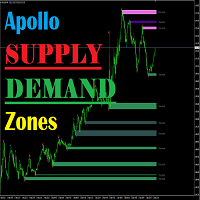
Apollo Supply Demand Zones は、サポートとレジスタンスのレベルを計算する指標です。このインジケーターは、使用する戦略に関係なく、すべてのトレーダーにとって絶対に役立ちます。この指標は、取引システムの主要な要素の 1 つになる可能性があります。このインジケーターは、現在の時間枠でレベルを計算し、MTF モードで動作して、より高い時間枠からのレベルを表示できます。この指標は、任意の時間枠で、任意の取引商品で絶対に使用できます。インジケーターは、実際に市場の全体像を表示するさまざまなタイプのレベルを示します。このインジケーターは音声アラートを提供するため、このインジケーターの操作が非常に 購入後、必ず私に書いてください!インジケーターの使用に関する推奨事項を共有します。あなたを待っている素晴らしいボーナスもあります!
The GJ_H1_220100009_S_HD_CF_SQX_SL20 is an algorithmic trading strategy for MetaTrader, tested on GBPJPY using the H1 timeframe from April 1, 2004, to April 24, 2024. There is no need to set up parameters, all settings are already optimized and fine-tuned.
Recommended broker RoboForex because of EET timezone.
You can find the strategy source code for StrategyQuant at the link: http://quantmonitor.net/listing/gbpjpy-macd-trader/
Key details are:
Parameters
MagicNumber: 220100009
M
FREE

ボリューム チャンピオンは、市場のボリュームを分析し、データをヒストグラム形式で表示するインジケーターです。市場分析の理論を掘り下げる必要はありません。インジケーターの読みに従うだけです。インジケーター バーは、市場ボリューム構造の分析に基づいて、価格変動の潜在的な方向性を示します。このインジケーターは、H4、D1、W1 などのより高い時間枠で使用するように設計されています。信号はレンダリングされません! 技術的には、インディケータは、トレーダーが望むように他の時間枠で使用できます。また、このインジケーターはどの通貨ペアでも使用できますが、USDJPY、EURJPY、EURUSD、GBPUSD、その他のペアなど、このインジケーターが最適に機能する通貨ペアがあります。購入後、インジケーターに最適な通貨ペアの完全なリストを提供します。 購入後ご連絡ください。サポートされている通貨ペアのリストと、取引をさらに収益性の高いものにするのに役立つ優れたボーナス指標を提供します!

The ' Average Bar Chart ' indicator was created to showcase the traditional Heiken Ashi calculation as an exotic charting style. This indicator is known for reducing chart noise for a smoother price action. A dditional indicators are recommended
Key Features Candlesticks for OHLC are removed from the chart. Average bars may be shown as complete bars without tails. All functionality and features of this exotic chart are inputs.
Input Parameters Chart Timeframe = PERIOD_CURRENT; - period to s
FREE
Strategy for trend trading. The indicator shows entry points and displays TakeProfit and StopLoss levels on the chart, as well as calculates the overall result. ATTENTION! TI Opti Pro – a powerful tool for testing the input parameters for the TrendImprovement indicator will allow you to quickly find the most profitable options for the input parameters. New project.
Description.
It is no secret to anyone that there is no universal indicator that would be profitable on all currency pairs and
FREE

「M1スキャルピングシグナル」は、M1タイムフレーム用に設計されたスキャルピングインジケーターです。このインジケーターは、価格の反転ポイントを示す矢印をチャートに表示します。赤い矢印は売りポジションへの価格反転を示し、緑の矢印は買いポジションへの価格反転を示します。すべての通貨ペアで使用できます。 利点: 再描画なし: インジケーターは過去のデータでシグナルを再描画しないため、安定した分析が保証されます。 使いやすさ: 簡単に設定でき、重要な反転ポイントをチャート上に視覚化します。 さまざまなタイムフレームのサポート: 1分足から日足まで、あらゆる時間枠で使用できます。 このインジケーターは、価格の反転ポイントを特定する強力なツールであり、トレーディングの精度を向上させたいトレーダーにとって欠かせないアシスタントとなります。 インジケーターの設定: ExtDepth: 分析の深さ(バーの数)。 ExtDeviation: 極値を確認するために必要な価格の偏差。 ExtBackstep: 誤ったシグナルを排除するためのバックステップ。

This is an implementation of the market cycle indicator described by Raghee Horner in the book "Forex Trading for Maximum Profit" . The current state of the market can be determined by analyzing the inclination angle of the exponential moving average (EMA) running on a period of 34 bars. If the EMA inclination is defined as the direction of the hour hand on the dial from 12 to 2 hours, then an uptrend is considered to be present; from 2 to 4 hours, the market consolidates; from 4 to 6 hours, a d
FREE

This is my own developed EA "Pearl"
It trades the whole market and tries to catch reversals. But it tries to trade within the overall D1-trend. It trades currency pairs only
It uses martingale-strategies. It does use flexible grids though. It is free to you when to increase the lotsize of grid levels A grid level can be skipped. If the price overruns a grid level and volatility is still high, a trade will not open. The EA waits till volatility has decreased. Grid distances can be extended b

Indicator for the 4th strategy of the Pipsurfer EA. This indicator will allow the user to visually see the points of entry for strategy 4 of Pipsurfer. In the settings you will be able to adjust the parameters to mix and match to your trading style and find the settings that you want to either trade manually or tune the EA to do. Strategy 4 uses a market structure trend continuation approach to trading and looks for confirmed highs in downtrends and confirmed lows in uptrends to find great trend
FREE

This product is a part of ON Trade Waves Patterns Harmonic Elliot Wolfe
you can test free version on EURJPY from this link Wolf Waves Indicator
ウルフウェーブを発見しよう - あなたの究極の取引ツール! どんな時間軸でも簡単にウルフウェーブを見つけるための強力なツールを探していますか?もう探す必要はありません!私たちのウルフウェーブインジケーターは、その仕事を簡単にこなします。なぜこのインジケーターがあなたにぴったりか、以下でご紹介します。 主な特徴: 自動検出: ウルフウェーブインジケーターは、複雑なアルゴリズムを使用して、チャート上のキーポイントを自動的に見つけ、対応するラインを描画します。手動でパターンを探す手間が不要です。 使いやすさ: このインジケーターはシンプルなデザインで、経験豊富なトレーダーからウルフウェーブ初心者まで、誰でも簡単に利用できます。 高精度: 数多くのウルフウェーブインジケーターの中で、当社のものは完璧

Emulate TradingView drawing experience with magnet snap to the nearest price.
Supported drawing tools: Vertical Line Horizontal Line Trend Line Horizontal Ray (Angle Trend Line) Fibonacci Retracement Rectangle
Input:
Threshold (px) : The distance in pixel unit to snap the crosshair to the nearest price.
Feel free to write the review, request more features or report bugs.
FREE

MTF Heiken Ashi MA is a multiple timeframe Heiken Ashi & Moving Average indicator. Fully customizable for advanced & unique Heiken Ashi & Moving Average calculations.
Key Features Modified appearance and appeal from the traditional using only H eiken Ashi MA bodies. MTF Higher or lower timeframes available making this it great for trends and scalping. There are many settings that can be non-repaint for signals at a new bar and at bar 0.
Inputs Timeframe = PERIOD_CURRENT - timeframe of Movin
FREE
通知を送信するための自動システム。これにより、サブスクライバーが取引端末からの取引イベントを見逃すことはありません。アカウントの取引操作に関する通知をTelegramメッセンジャーに送信するユーティリティ。 Step-by-step instructions for connecting the utility to a channel in Telegram -> HERE / MT5 -> HERE 利点: 簡単なセットアップと詳細な手順、 調整可能なスクリーンショットを送信する可能性、 絵文字を使用してカスタマイズ可能な通知テキスト、 完全または部分的な開始、終了、および注文の変更に関する通知の調整、 デフォルトで通知を送信する場合、テキストファイルは自動的にダウンロードされます。 保留中の注文の発注または削除に関する通知の調整、 記号とマジックナンバーによる便利なフィルタリング。 入力変数: TELEGRAM BOT AND CHAT SETTINGS Telegram bot token - Enter the token number received after

このインディケータは、インパルス・ローソクを検索し、チャートに表示します。 シャドーフィルターも搭載。また、ボリンジャーバンドのブレイクアウト・レベルも検 出します。 設定で多通貨ダッシュボードを有効にできます。 アラートは現在のチャートかリスト全体から選べます。 Blog-Link - Retest and Fake Breakout with UPD1
取引パターン トレンドの再テスト。 偽ブレイクアウト。 その他 。
EURUSD, GBPUSD, XAUUSD, ... M15、M30、H1。
入力パラメータ 。
基本。 Bars Count - インディケータが機能するヒストリーバーの数。 Coeff Period - 計算期間。 Min HL Coeff - ローソク足が検索される係数。デフォルト値は2.0ですが、より高いタイムフレームでより多くのシグナルを得るには1.5を設定します。 Shadow Filter - 値が高いほど、ローソク足上の影のサイズを大きくすることができます。50以下に設定するのが望ましい。
ローソク足の視覚化 。 C

В основе индикатора TDI лежат следующие индикаторы: RSI, Moving Average, Bollinger bands, но основным из них нужно выделить RSI, весь расчет индикатора завязан от его значений.
Зеленая линия (линия RSI) – сглаженные простой (по умолчанию) скользящей средней значения индикатора RSI, период сглаживания 2.
Красная линия (сигнальная линия) – сглаженные простой (по умолчанию) скользящей средней значения индикатора RSI, период сглаживания 7.
Синие линии – индикатор Bollinger bands по умолчанию п
FREE

Indicator automatically draw bullish and bearish engulfing without any rules. Bearish and Bullish engulf is well known area for supply and demand area marking. This indicator can be used in any strategy that required supply demand zone. Show Last Engulf : Enable this option to show unfresh engulfing Candle to calculate : set 0 will load all history bar and can use up more memory Bearish Engulfing Colour : Pick any colour that suit Bearish Engulfing Colour : Pick any colour that suit
-Use thi
FREE

The indicator defines the Bullish and Bearish Engulfing Bar. The pattern has greater reliability when the open price of the engulfing candle is well above the close of the first candle, and when the close of the engulfing candle is well below the open of the first candle. For an engulfing bar to be valid it must fully engulf at least one previous bar or candle - includes all the body and the wick. The engulfing bar can engulf more than one bar as long as it completely engulfs the previous bar.
FREE

FREE FOR A LIMITED TIME ONLY!!! The Ultimate Indicator For Trading Trend This indicator clearly shows you the strength of the market in one direction or the other, which means that you can trade knowing you are either with or against the market. When used in conjunction with the +3R principles you are sure to have some serious results. The +3R Principles Routine - This is when you trade and how often Rules - This is the rule you follow Risk:Reward - This is the percentage amount of your accoun
FREE

*This is tradingview indicator converted to mql4*
The Chandelier Exit Indicator is a popular technical analysis tool developed by Chuck LeBeau. It is designed to help traders identify potential exit points for their trades based on market volatility and the concept of trailing stops. The Chandelier Exit Indicator consists of three main components: Average True Range (ATR): The indicator utilizes the Average True Range, which measures market volatility. The ATR calculates the average range bet
FREE

SI Connectは、FX VolumeやSIEAの取引システムを利用するために、当社のサーバーへの接続を確立するユーティリティです。
SI Connectを使用するために端末を準備する技術的な手順 Web リクエストを許可し、[ Terminal Options ] -> [Subcategory Expert Advisors ] で許可された URL のリストに https://stein.investments を挿入してください。 ターミナルごとに1つのEAインスタンスを実行する必要がありますが、当社のデータセンターから最新のデータを取得するため、バックグラウンドで常に実行する必要があります。
ご質問がある場合は、プライベートメッセージを送信してください。
FREE

The Multi-Timeframe High Low Points (MTF High Low Points) indicator is a powerful tool for traders using MetaTrader 4 (MT4) to analyze price movements across different timeframes. This versatile indicator helps traders identify significant support and resistance levels by displaying the highest and lowest price points within a specified number of bars on multiple timeframes simultaneously. Key Features: Multi-Timeframe Analysis: MTF High Low Points allows traders to monitor high and low price le
FREE

Moving Average Dashboard Bars ago is a unique multi currency, multi time frame dashboard. The dashboard is very simple. You select two moving averages, the instruments and timeframes The Moving Average Dashboard Bars ago then shows how how many bars ago the moving averages made a bullish or bearish crossover. It also shows you in real time when there is a bullish or a bearish crossover. The indicator plots in a subwindow. The Moving Average Dashboard Bars ago can be beneficial if you are trading
FREE

SAFETYLOCKを使用すると、トレーダーは、すでにオープンしているポジションに反対の注文を設定することで、強い市場の反転を回避できます。
トレーダーまたはEAがポジションをオープンした場合、SAFETYLOCKは反対の保留中の注文をオープンします。ポジションが赤字になると、保留中の注文がアクティブになり、ロックが作成されます。 EAを使用すると、初期位置を閉じたり、トレーリングストップで作業したり、ロットを乗算したりできます。 ポジション価格に続いて、保留中の注文の始値を変更することもできます。 完全な説明 +DEMO +PDF 購入する方法
インストールする方法
ログファイルの取得方法 テストと最適化の方法 Expforex のすべての製品 基本的なパラメーター(ブログのパラメーターの完全な説明) MilliSecondsTimerForMonitoring- アルゴリズム実行の期間(ミリ秒単位)(デフォルトは1000 = 1秒)。 SymbolMonitoring -SymbolMonitoring = ALL_SYMBOL =アカウントの
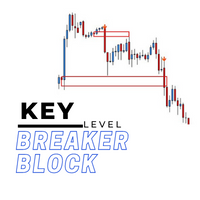
The key level breaker block indicator automatically draws breaker blocks for you on the chart. Breaker blocks are, in short, failed order blocks, but create strong support and resistance zones when price comes back to re-test them.
Advantages
The key level breaker block DOES NOT RE-PAINT, giving you confidence when a signal appears and also helps when looking back. The key level breaker block includes an on/off button on the chart to easily keep the charts clean after analysis by just o

Do you like scalping? Th is indicator displays information about the latest price quotes received from the broker. [ Installation Guide | Update Guide | Troubleshooting | FAQ | All Products ]
Identify tick trends easily A blue row means the price has increased A red row means the price has decreased Customizable colors and font sizes Display your desired amount of rows The indicator is non-repainting
Parameters Rows: amount of rows with data to display in the chart Font size: font size of th
FREE

株式取引を次のレベルに引き上げたいとお考えですか?
そのスマートなアルゴリズムとエキスパートの注文により、常にゲームの先を行くことができます。 上昇相場と下降相場から利益を上げ、トレンドを簡単に予測し、投資ポートフォリオを常に把握する - Stock Flow なら、それがすべて可能です!
インプットとアウトプットの注文は、どの MT4 プラットフォームでも見られる 2 つのインジケーター (MACD シグナル、モメンタム インジケーター、マネー フロー インデックス インジケーター) の組み合わせによって与えられます。
指標には、最高の純利益になるように最適な組み合わせで調整された期間とレベルの値があります。
また、ストップロスとテイクプロフィットが含まれており、ボラティリティが高まる時期に資本のセキュリティをもたらします。
エキスパートは、2021 年 1 月 1 日から 2023 年 1 月までの GBPUSD M30 履歴データでテストされました (MT4 での 2 年間のバックテスト)。
ダウンロードして自分でテストしてください。
Metatra
FREE

McS Super Trend -This is one of the most popular classic trend indicators. It has a simple setting, allows you to work not only with the trend, but also displays the stop loss level, which is calculated by this indicator. Benefits:
Instruments: Currency pairs , stocks, commodities, indices, cryptocurrencies. Timeframe: М15 and higher. Trading time: Around the clock. Shows the direction of the current trend. Calculates the stop loss. It can be used when working with trading. Three types of no
FREE

Features: Find these engulfing patterns: Simple Engulf Stick Sandwich Engulf Three Line Strike Rising Three Morning Star Doji Scanner is useful to make your strategy better. Don't always go by Win/Loss percentage. Because this tool is not based on past results. Basic Settings: For All Patterns You can set: First:Last Candle Ratio This will make sure that the earlier opposite candle is at least this given ratio in height as compared to the engulfing candle. This is not checked for Three Line Stri
FREE

Designed mainly for USDCAD 1H market. Minimum trading account 100 $. Expert advisor operates by unique Bands strategy and transaction algorithm.
settings: minBalance - minimum account balance for trading maxSpread - maximum allowed spread for trading maxLoss - maximum loss for stop trading lotControl - lot control and auto lot activation bandsPeriod - indicator period tradeProfit - profit for exit USEtradeRange - if true, will operate with range between trades tradeRange - range distance
FREE

This indicator is the basis for an Expert Advisor that can be categorized as "almost Grail". See details below. This indicator displays the projection of the Renko chart on the price chart. This projection is displayed as a stepped line, not as "bricks" (rectangles). See slides 1 and 2. Abbreviated name of the indicator: LRC – L ine of R enko on the price C hart. The principle of its construction is very simple. First, a grid of horizontal lines (levels) is bu
FREE

This EA trades the forex markets by a specific combination of ATR and parabolic SAR indicator signals and transaction management. the EA has stop loss and take profit. minimum trading account 500.
default settings for GBPUSD 1h. settings for optimization: ATRperiod lot sarStep sarMaximum tpFactor slFactor this EA(){ operates once per bar; fast methods of optimization are valid(){ user can optimize by model (control point); || (open prices only); }}
developed, tested and opti
FREE
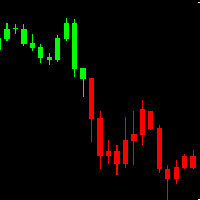
AH Candles MT4 AH Candles MT4 is a new product that allows identifying the current market phase (uptrend and downtrend ).
This indicator paints bars in different colors depending on the current state of the market trend ( Green and Red )
AH Candles MT4 is use for trading currencies
Advantages Suitable for intraday and swing trading. The indicator base on EMA method to calculate Period Parameters It can be used as a standalone tool or together with other indicators.
How to use
FREE

FCK Gold Killer Ea is a fully automated trading system that trades on the pairs XAUUSD, US500 on M1 Time Frame. FCK Gold Killer Ea uses an Advanced-Smart Breakout System for Scalping analyses the market conditions. This unique feature allows It’s pure Price Action trading, mean reversal system that utilizes peakedness of market distribution to identify trend reversals safely. This Scalping EA uses a unique trading system that combines sophisticated automated trading with user dis

This indicator continuously changes the color of candlestick borders and bodies, as well as the color of volumes in real time. The indicator is easy to use. The palette of colors is diverse. This product is a graphical solution, so it is difficult to describe what it does by text, it is easier to see by downloading it, besides the product is free. The indicator is suitable for bloggers who want to create a beautiful picture of a chart for video editing or traders who want to make their chart al
FREE
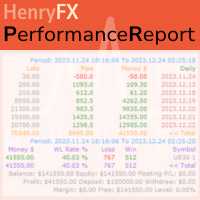
This Performance Report indicator is special design for some trader to analyst his/her performance.
FREE Version, included: - " Display Language "
- " Report Grouping "
- " Count Live Order "
- " Label Row Dis "
- " Label Font Size "
Performance Report Pro : : https://www.mql5.com/en/market/product/58287
Input Parameter: " Display Language "
:: [ English / Chinese ] Display language; " Report Title "
:: Show the report title as you want; " Report Groupin
FREE

Rua Pinbar This is an indicator to help you quickly identify pinbar candles in the chart. Can be used on any currency pair and any time frame you want. This indicator is often used to determine entry points. You can refer to the product here: https://www.mql5.com/en/users/phamruacoder/seller
A product of Ruacoder Get code indicator and robot (EA) as required.
FREE

This indicator shows the breakeven line level for the total number of open positions of the current symbol with P/L value and total volume. This indicator is helpful to decide the exit level when using a trading grid strategy. The style of the breakeven line is customizable to choose the color, line shape and font size of the positions description. Send mobile notification when crossing a positive P/L target
FREE

Defines extremes. This indicator consists of two parts. The first draws lines on the chart indicating low volatility in relative daily market activity. The second is responsible for determining the extremum and gives signals to buy or sell. This system is suitable for all instruments. It is recommended to use a timeframe from m15 to h4. Before using, you need to choose the settings for yourself. Configure lines deviation. Specify volatility coefficient. Advantages The indicator does not repaint
FREE
アドバイザー アシスタント「Breakeven quick stop loss」は、トレーダーが利益を維持し、リスクを軽減するのに役立つように設計されたツールです。このツールは、損益分岐点を迅速かつ確実に設定し、手動でもトレーディング アドバイザーを使用しても、取引中に大きな損失を回避できます。トロールとは異なり、SL は移動せず、オープン ポジションをロールバックまたはトレンドの急激な変化から保護するだけです。相場が変化する速度のため、これを手動で行うことは非常に困難です。これは、ブレイクアウト戦略を使用するトレーダーにとって特にありがたいものです。
デフォルト設定では、損益分岐点は 3 ポイントに設定されています。価格が目的の方向に 15 ポイントを超えるとすぐに、保護 SL がトリガーされます。標準 TP もインストールされています。
このプログラムを使用すると、トレーダーは、市場が突然変化した場合でも、預金が保護されることを確信できます。「Breakeven quick stop loss」を使用すると、損益分岐点を特定のレベルに設定して、損失を最小限に抑え、トレーダ
FREE

A simple but effective helper that will allow you to track both global and local market trends. The indicator combines the work of two oscillators: Stochastic and RSI. Both indicators can be set to any timeframe.
Advantages of Use Multitimeframe - you can adjust both indicators to the desired timeframes. To obtain the entry points, you can use the Elder's triple screen system. Highly customizable - you can configure not only the parameters of the indicators, but also their appearance (color an
FREE

The indicator is based on the classic CCI indicator. I recommend watching my advisor - Night Zen EA Doesn't redraw its signals. There are alerts for the incoming signal. It contains 2 strategies: Entry of the CCI line into the overbought zone (for buy trades ) / into the oversold zone (for sell trades ) Exit of the CCI line from the overbought area (for sell trades) / from the oversold area (for buy trades)
Settings: Name Setting Description Period Period of the classic CCI indicator Price C
FREE
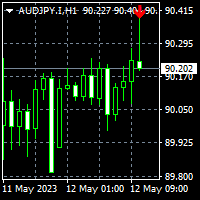
To get access to MT5 version please click here . This is the exact conversion from TradingView: "Hammer & ShootingStar Candle Detector" by "MoriFX". This is a light-load processing and non-repaint indicator. All input options are available. Buffers are available for processing in EAs. You can message in private chat for further changes you need. Thanks.
FREE

Here is the provided text with line breaks:
This is the logic of a Forex EA.
This EA is very unique.
Normally, entries are made immediately based on overbought and oversold values of the RSI indicator.
However, this EA is different.
It is slightly modified.
It doesn't enter immediately once it becomes oversold.
Instead, it waits a bit after oversold conditions to see a reversal before entering.
The same theory applies to overbought conditions.
After it becomes overbought, it
FREE

Main: Not martingale, not a grid; Working on all symbols;
Signals: There is a good rational algorithm. Work of two indicators: Stochastic and OsMA (you can set a separate Timeframe for each indicator)
Stop Loss/Take Profit: There is a good money management system (there are several type for trailing stop loss); There is virtual levels of Stop Loss / Take Profit; There is smart lot (percent by risk) or fix lot
Important: EA can work on closed candles, and on current candles; Quickly o
FREE
Introducing IT Divergence EA, your ultimate ally in maximizing profits across financial markets. Our Expert Advisor (EA) leverages the potent MACD and RSI indicators to automate trading with unparalleled accuracy.
Key Features :
Divergence Detection Strategy : IT Divergence EA is built on a robust strategy that harnesses the power of MACD and RSI indicators to spot divergences in the markets. Divergences serve as powerful signals for identifying potential buy or sell opportunities. Intell
FREE
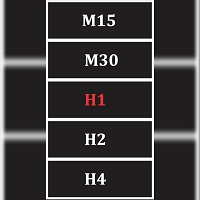
Seamlessly switch between 13 (9 mt4 default and 4 popular custom) time frame with this tool. Real ease of switching between default and custom time frames. Note indicator does not create custom time frame chart data, it only enables you to switch to and from them. Creating a custom time frame can be done using the default mt4 period converter script attached to a lesser default mt4 time frame. Example attach period converter on M1 and set period multiplier to 10 to have a custom M10 chart.
FREE

As the title says, this is an indicator that shows the current open market (session). It has 4 sessions with customizable schedule : 1. London session, 2. New York session, 3. Sydney session, 4. Tokyo session.
Indicator inputs: - The color of each session. - The open time and close time of the sessions. - The line width.
The objective of the indicator, is to follow each sessions, observe at what times are multiple sessions open, and thus take the chance of the high market movements.
FREE

FTUイディオテック このインジケーターはMT4プラットフォーム用で、単独で使用できますが、他のインジケーターや戦略と組み合わせるのが最適です。 macd、adxなどの様々なインジケーターを組み合わせて矢印を描き、エントリーやトレンド転換を示唆 YouTube で短い紹介ビデオをご覧ください: https://youtu.be/lCRJ3mFNyOQ インジケーターの特徴: 矢印の販売と購入 視覚と音による警告 トレンド継続 / 早期トレンド転換シグナル 新機能: 履歴内のバーの数を制限する バーから矢印までの距離を変更する 使用法: このインジケーターは、ほとんどの資産グループ、外国為替、商品、指数などで使用できます。 すべてのタイムフレーム、再描画なし、高速読み込み 私の FTU Predictor と組み合わせると、確実に優位性が得られます。 いくつかのアドバイス: 資金管理と規律が鍵であり、単一の戦略や指標が成功をもたらすことはありません。損失は発生するものであり、それをどのように回復するかを理解することが重要です。小さな勝ったり負けたりして、市場に恩返しすることがすべての日
FREE

A simple information indicator showing the time left before the opening of the next candlestick or bar.
About the concept of a timeframe A timeframe is the time interval considered in the technical analysis of free financial markets (the same applies to the global currency market), during which the price and other market data change. The smallest timeframe is the so-called tick. A timeframe is the time interval used to group quotes when drawing elements of a price chart (bars, Japanese candles
FREE

The Flag Streamer Pattern indicator is an indicator designed to find flag and pennant patterns. When the legend finds patterns, it draws lines on the graph screen. Magenta lines represent the streamer pattern. Aqua colored patterns represent the flag pattern. You can change the pattern colors according to your request. Our Popular Products Super Oscillator HC Cross Signal Super Cross Trend Strong Trend Super Signal Parameters fs- =======Channel Trend Setting===== Channel - Channel period setting
FREE

Bollinger Bands Tunnel EA is a free expert advisor developed with the idea to be useful for traders who love to trade using the popular indicator Bollinger Bands. Bollinger Bands Tunnel EA has very simple trading logic. It trades inside of the Bollinger Bands indicator. When the price crosses the Bollinger Bands upper line and reverses, the EA opens a SELL position. When the price crosses the Bollinger Bands lower line and reverses then the EA opens a BUY position. The algorithm of closing the
FREE
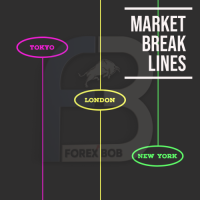
Market Break Lines is an utility tool to create a partition line at market openings/closings of Tokyo/London/NewYork sessions. This will help you to compare the market movements, volatility variations between the different markets.
Inputs: Inputs are simple to feed the time of Tokyo/London/NewYork sessions as per your broker server time Change Color and width of partition lines You can enable or disable any line (Hide/Show).
Please don't forget to support by giving handsome reviews/rating MT
FREE

Key Price Levels Indicator Indicator that shows the highs and lows for the significant price levels for past periods that could be potentially considered as reaction levels. The indicator displays the following price levels: Yesterday high and low The day before yesterday high and low Two days back high and low Last week high and low Last month high and low Last three month high and low (Quarter) Last year high and low
FREE

Introduction
Auto Chart Alert is a convenient tool to set alert for your trading in your chart. With Auto Chart Alert, you can set the alert line in one click in your desired location in your chart. You can even set alert over the sloped lines in your chart. Auto Chart Alert is a great tool when you have to watch out importnat support and resistance levels for your trading. You can receive the sound alert, email and push notification when the price hit the alert line at you desired location. A
FREE

Xmasterインジケーターの新しいより正確なバージョン。最も効果的で正確な式を得るために、世界中の200以上のトレーダーが、PCでこのインジケーターのさまざまな組み合わせの15,000以上のテストを実施しました。そしてここでは、正確なシグナルを表示し、再ペイントしない「Xmasterフォーミュラインジケーター外国為替再ペイントなし」インジケーターを紹介します。このインジケーターはまた、電子メールとプッシュによってトレーダーにシグナルを送信します。新しいティックが到着するたびに、75以上のパラメーターで市場を常に分析し、トレーダーに正確な売買シグナルを示します。また、このインディケータの助けを借りて、正しい方向で取引を開始するためにトレンドが現在どの方向に進んでいるかを確認できます。 新しい「Xmasterフォーミュラインジケーターforexno repaint」インジケーターはどのように機能し、古いバージョンと何が違うのですか? まず第一に、それは世界中のさまざまなトレーダーによって15,000回以上テストされた最も最適化された市場分析アルゴリズムです。 第二に、このインジケーター

インディケータは、前日に基づいて計算されたクラシックピボットレベルをチャートに表示します。 数式を計算する時間から選択できます。 フラットでの反転レベルでの取引。 トレンド市場では、それらをターゲットとして使用します。 取引を成功させるための戦略と組み合わせる 。 レベルはバッファを使用して構築され、利用可能な見積もり履歴全体に表示されます。
入力パラメータ 。
Start Hour - 1日の始まりの時間から。 00-デフォルト 。 Show Mid Pivots - 中間レベルを表示する 。
Visual Button - ボタン表示(有効/無効) 。 Corner - ボタンアンカー角度 。 X indent - ピクセル単位の水平パディング 。 Y indent - ピクセル単位の垂直パディング 。
Label Visual - 表示レベルラベル 。 Label Font Size - フォントサイズ 。 Label Shift Bars - バーの碑文のインデント 。 Label Tooltip - レベルの上のカーソルの下にテキストを表示する
FREE
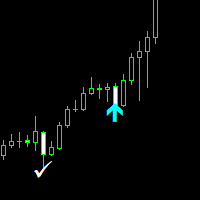
Nasdaq Savages Non-repaint indicator works on all timeframes 1 minute to 15 minutes timeframe for scalpers. 30 Minutes to Monthly timeframe for swing traders The Nasdaq Savages indicator comes with a top right info tab which tells you about the current buy or sell signal, Profit in pips, Stop loss and Target Red arrow is your sell entry signal the white right tick is your exit signal and take profit hit signal Light blue arrow is your buy entry signal the white right tick is your exit signal an

The Market Profile Indicator for MT4 displays the price levels and zones where increased trading activity happens. These zones with substantial forex trading activity provide the forex traders with the best entry levels, support, and resistance levels. Moreover, price levels indicate the best reversal zones. As a result, forex traders can identify BULLISH and BEARISH market trends and BUY and SELL entry points as well as the best reversal points. The indicator works well in all intraday timefram

---------- A TrendTrading Robot ----------
Hello everyone! I am a professional MQL programmer , Making EAs, Indicators and Trading Tools for my clients all over the world. I build 3-7 programs every week but I seldomly sell any ready-made Robots. Because I am fastidious and good strategy is so few... this EA is the only one so far I think its good enough to be published here.
As we all know, the Ichimoku indicator has become world popular for decades, but still, only few people knows the
Moving Average Crossover Scanner This Scanner scans two moving averages(MA) crossover across multi-currency pairs and multi-time frames and shows all the result in the dashboard. 1. The fast MA is about to cross up the slow MA - designated as "XUP". 2. The fast MA is about to cross down the slow MA - designated as "XDN". 3. The fast MA has just crossed up the slow MA - designated as "UP". 4. The fast MA has just crossed down the slow MA - - designated as "DN". Input parameters can be changed

The Robot's Logic
Check the longer time frame range, and if the price breaks that range, it opens an entry.
BUY and SELL entries are decided based on RSI overbought and oversold conditions.
The logic is very simple, but longer time frames such as H4 give the best performance. Please attach EA on the TF H4 and buy and sell entry is closed with profit target which is auto calculation.
FREE

Nonfarm Payrolls Expert advisor is a fully automated EA that can only be used to trade fundamentals and specifically NFP news releases. A nonfarm payrolls EA is a type of EA that is specifically designed to trade based on the nonfarm payrolls data releases. It is suitable for both beginners and experienced traders.
INSTRUCTIONS
* User should only active this expert advisor when expecting NFP NEWS release. * During this event the market is volatile and If it happens for whatever reason the
MetaTraderマーケットはMetaTraderプラットフォームのためのアプリを購入するための便利で安全な場所を提供します。エキスパートアドバイザーとインディケータをストラテジーテスターの中でテストするためにターミナルから無料のデモバージョンをダウンロードしてください。
パフォーマンスをモニターするためにいろいろなモードでアプリをテストし、MQL5.community支払いシステムを使ってお望みのプロダクトの支払いをしてください。
取引の機会を逃しています。
- 無料取引アプリ
- 8千を超えるシグナルをコピー
- 金融ニュースで金融マーケットを探索
新規登録
ログイン