YouTubeにあるマーケットチュートリアルビデオをご覧ください
ロボットや指標を購入する
仮想ホスティングで
EAを実行
EAを実行
ロボットや指標を購入前にテストする
マーケットで収入を得る
販売のためにプロダクトをプレゼンテーションする方法
MetaTrader 4のためのエキスパートアドバイザーとインディケータ - 38
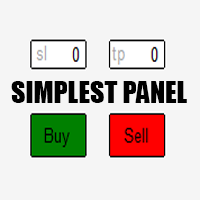
Just a simple panel that I created to make my trading life easier. Features: Buy and Sell with TP & SL right on chart Lot size is calculated by risk percentage Martingale - will open opposite position when SL hit (please don't enable unless you know what you are doing)
Will have more add-ons like Close-all button, Break-even, Trailing-Stop, etc. It's FREE so please leave your negative review somewhere else.
FREE
Highly configurable Macd indicator.
Features: Highly customizable alert functions (at levels, crosses, direction changes via email, push, sound, popup) Multi timeframe ability Color customization (at levels, crosses, direction changes) Linear interpolation and histogram mode options Works on strategy tester in multi timeframe mode (at weekend without ticks also) Adjustable Levels Parameters:
Stochastic RSI Timeframe: You can set the lower/higher timeframes for Stochastic RSI. Stochastic RSI
FREE
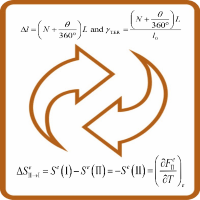
The intelligent algorithm of the Reversibles indicator determines the direction and strength of a trend, and also signals a trend change. Reversibles is a technical analysis indicator. Uses just one parameter for settings.
The indicator is built for simple and effective visual trend detection with an additional smoothing filter. The indicator does not redraw and does not lag. Shows potential market reversal points. The indicator can work on any timeframe.
You can set up message alerts as so

This indicator shows the latest untouched support and resistance as horizontal lines. The indicator can show support/resistance from higher timeframes. With this indicator you can e.g. easily see the support/resistance of the timeframes H4, D1 and W1 on a H1 chart, which can be a big advantage while time your entry on H1. This is the FULL version of the indicator: Support Resistance Multi Time Frame FREE
Parameters referenceTF: the timeframe from which the support/resistance is calculated cand

Scalper Zoom is a new trading system designed to facilitate the process of Forex trading both for beginners and professionals. The Scalper Zoom indicator uses an adaptive method of operation and analyzes the market using multiple trading algorithms, while selecting the most efficient one for the given currency pair and timeframe. Working with this indicator is very simple. When a red vertical line appears, open a sell order. Close it when a blue vertical line appears. Follow the opposite steps f

Friends, we present to your attention our new Forex Gump Laser indicator. Since there are no designers in our team, but mainly mathematicians, financiers, programmers and traders, we did not make any special changes in the indicator design. In appearance, it resembles the usual Forex Gump. On the other hand, Forex Gump has become not just the name of an indicator, it is a brand. And we try to preserve the corporate identity in all its varieties. The whole essence of the indicator in its operatio

Scalping Modulator is a scalping trading system. The indicator consists of several analytical modules. It automatically analyzes the market and shows the trader all the necessary information for trading. Scalping Modulator draws two trend lines on the chart. One line shows the long-term direction of the price, the second line shows the medium-term direction of the price. The indicator also draws red and blue dots on the chart. They indicate a likely change in price movement. In order to open a

Piramid Machine is a tool supporting manual trading, allowing for a radical increase in profits. Principle of operation: The trader must open the first position himself. In the "Auto_size_position" mode, the robot will determine the size of the item based on the assumed risk risk "Risk_perc" and the automatically set SL level. The SL level is defined as: If you do not use the red "colored pencil" (shown in the movie), then SL is set at the Kijun or Tenkan level - depending on the choice. The siz
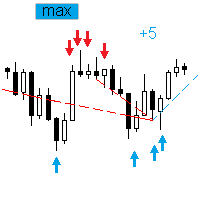
The Expert Advisor trades the signals from an artificial neural network with one hidden layer. Presence of a signal is checked at the closing of the specified period. MAIN PARAMETERS Net option - setting the order grid. When placing a market (not pending, Pending order offset=0 ) order according to a signal, the grid order is set. The following direction are available: follow the trend , against the treand and both directions . The number of placed orders is taken from the ...maximum deals with

BaxterStars is a fully automated trading system for the Metatrader4 platform. The robot trades on the scalping system. It opens trades for short positions. Depending on the market situation, it can open a different number of transactions, from 1-2 per week to 5 transactions per day. It all depends on how the market behaves. The robot works on a breakthrough strategy. It automatically determines the accumulation lines of the price range by setting virtual entry points at the level of these lines

親愛なる友人、ご清聴ありがとうございました。 異なる通貨ペアの動きが相互に関連していることを観察したい場合は、インジケーター Visual Correlation に注目してください。 異なる通貨ペアの動きは相互に関連しています。 Visual Correlation インジケーターを使用すると、スケールを維持しながら 1 つのチャート上にさまざまな金融商品を表示できます。 正の相関、負の相関、または相関なしを定義できます。
親愛なる友人、あなたは、いくつかの楽器が他の楽器よりも先に動くことをご存知でしょう。 このような瞬間は、グラフを重ね合わせることで判断できます。
親愛なる友人へ、チャート上に商品を表示するには、Symbol フィールドに商品名を入力する必要があります。 Version for MT5 https://www.mql5.com/ja/market/product/109155
FREE

SignalPinner is a trend line Indicator which can detect market trends early by including three types of signal arrows. Non repaint and trend following. Signals on the strong trend, signals in the beginning of trend and signals with multiple market analysis algorithm as the main signals. Supported by alert notification message to keep you getting signals while on the go. Symbols: Any Timeframes: Any
Features Histogram buffers as a sign the trend is started. It can help the trader knowing the ma

Check my p a id tools they work perfect please r ate Adjustable PIN BAR indicator is usefull tool alowing to search for pin bars you wish to find on the price chart, it has 2 parameters to filter out what type of pin bars you wish to search for: 1) MinTailProc 75% (default) which means to show pin bars that has minimum size of the Nose (Tail) as 75% of full candle size. If Upper Nose (Tail) size of the candle is minimum 75% of the candle size fully than candle is painted in RED. If Lower Nose
FREE

The Point61 indicator is the result of many years of monitoring of price behavior of currency pairs and metals.
It is not a secret, that in times of uncertainty, traders are looking for possible levels of support and resistance - the point, where price should stop its movement.
There are 2 possible scenarios at these points:
1. Reverse (correction) to the opposite direction;
2. Breakthrough to continue movement. Very often these points are used to set stop orders - TakeProfit or

This Expert Advisor is a pure scalping system. The expert place and manage pending orders. Runs perfect on pairs with tight spread and low commission broker (commission plus spread equal or less than 1.0 pip). Choose a broker with zero stop level and fast execution to use expert.
Pairs and Time Frame Pair: eurusd Time frame: M1 Default settings are good for eurusd.
Information Please test expert on demo account first, before uses it on real account. Have on your mind, all scalpers are sensi
FREE

Bollinger Bands Tunnel EA is a free expert advisor developed with the idea to be useful for traders who love to trade using the popular indicator Bollinger Bands. Bollinger Bands Tunnel EA has very simple trading logic. It trades inside of the Bollinger Bands indicator. When the price crosses the Bollinger Bands upper line and reverses, the EA opens a SELL position. When the price crosses the Bollinger Bands lower line and reverses then the EA opens a BUY position. The algorithm of closing the
FREE

This indicator scans for you up to 30 trading instruments and up to 8 timeframes for occurrences of the high probability reversal patterns: Double Tops/Bottoms with fake breakouts . Please read also the blog post " Professional Trading With Double Tops/Bottoms And Divergences! " which explains the concepts behind the ULTIMATE Double Top/Bottom indicator and how you can use a professional top-down approach. This FREE Version of the Scanner scans only EURUSD and GBPUSD. The full version of the sca
FREE
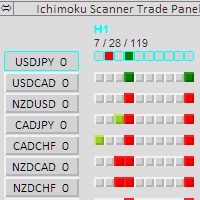
This scanner is a tool used to support trading with the Ichimoku method. Its basic features are: 10 trading setups implemented in accordance with the Ichimoku technique, the possibility of simultaneous scanning, all financial instruments available on the platform, the possibility of simultaneous scanning, in all timeframes available on the platform, available Manual and Auto trade , the ability to open in Manual mode from the level of the chart, the ability to determine the size of the position

Introducing TradingBoost : Revolutionize your trading experience with TradingBoost, an innovative software utility seamlessly integrated into the MetaTrader platform. TradingBoost empowers traders with advanced analytics, real-time insights, and predictive tools to enhance decision-making and optimize trading strategies.
There is a version WITH AI: https://www.mql5.com/en/market/product/115275 Version for MetaTrader 5: https://www.mql5.com/en/market/product/117047 Functionality 15+ Trading Too
FREE

AI トレンド インジケーターは、金融市場のトレンドの方向を正確に判断するために、高度なニューラル ネットワーク テクノロジーを使用して作成された革新的な取引インジケーターです。 このインジケーターは、価格動向の詳細な分析に基づいた直感的で有益な意思決定ツールをトレーダーに提供します。
主な特徴:
トレンド予測のためのニューラル ネットワーク: AI トレンド インジケーターは、膨大な量の履歴データでトレーニングされた強力なニューラル ネットワークを使用します。 このネットワークは、価格変動の隠れたパターンとトレンドを特定することができ、トレンドの方向性を正確に予測します。
多次元分析: このインジケーターは、さまざまな時間間隔と要因を考慮して価格データの多次元分析を実行し、価格変動の方向についてより完全かつ信頼性の高い予測を作成できます。
トレンドのグラフィカル表示: AI トレンド インジケーターは、ユーザーに現在のトレンドをグラフィカルに表示し、意思決定プロセスをより直感的かつ明確にします。 さまざまなカラーコードとマーカーにより、現在の市場状況を明確に視覚的に
FREE

It is the same of Advanced Arrow indicator but shows the signal of 8 currencies pairs at the same time on 5 Timeframes without any TPs line or SL.
Features You will know when exactly you should enter the market. This indicator does not repaint it's signals.
Signal Types and Timeframes Used You can use this indicator on any timeframes but i recommend you to use it on H1, H4 frames. The indicator gives you four signals (Ready to Buy "RBuy", Ready to Sell "RSell", Buy, Sell). When RBuy appear y

Introduction
Auto Chart Alert is a convenient tool to set alert for your trading in your chart. With Auto Chart Alert, you can set the alert line in one click in your desired location in your chart. You can even set alert over the sloped lines in your chart. Auto Chart Alert is a great tool when you have to watch out importnat support and resistance levels for your trading. You can receive the sound alert, email and push notification when the price hit the alert line at you desired location. A
FREE

*This is tradingview indicator converted to mql4*
The Chandelier Exit Indicator is a popular technical analysis tool developed by Chuck LeBeau. It is designed to help traders identify potential exit points for their trades based on market volatility and the concept of trailing stops. The Chandelier Exit Indicator consists of three main components: Average True Range (ATR): The indicator utilizes the Average True Range, which measures market volatility. The ATR calculates the average range bet
FREE

After purchasing, you can request and receive any two of my products for free!
После покупки вы можете запросить и получить два любых моих продукта бесплатно! The EA is based on and uses the signals of standard trend indicators. The algorithm does not use dangerous trading methods - martingale, grid and averaging, it always uses only a fixed stop loss and a built-in trailing stop. By default, the currency pair is XAUUSD, M5 (it is possible to optimize for other currency pairs, and with a diff
FREE
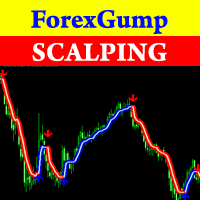
Attention! Friends, since there have been many scammers on the Internet recently selling indicators called ForexGump, we decided to warn you that only on our page is the LICENSE AUTHOR'S VERSION of the INDICATOR sold! We do not sell this indicator on other sites at a price lower than this! All indicators are sold cheaper - fakes! And even more often sold demo versions that stop working in a week! Therefore, in order not to risk your money, buy this indicator only on this site! Forex Gump Scalpin

Expert Advisor Dharma Trading is a trading robot with the latest and most advanced algorithms. EA for forex and Gold market. The strategy's signals are based on market fluctuations, trading orders apply the method of continuously moving Stop Loss and Take Profit in small time periods to catch price momentum. In addition, the EA also has a Max Stop Loss option to limit the maximum loss of the position. The algorithms are optimized and simple to use. You just need to set the defaults and can chang

指標はフラクタルの価格構造を分析し、市場ダイナミクスの可能な反転ポイントを識別します。他のタイプのインジケーターと組み合わせて使用すると最適です。
利点:
すべての機器と時系列で動作し、 結果を再描画しません、 インジケーター要素のカスタマイズ可能な色、 トレンド戦略とうまく連携し、 フラクタルの強さを調整します。
MT5 version -> HERE / Our news -> HERE
Strategy:
AW Flexible Fractals is an indicator that indicates signals not instantly, but with a delay, due to the structure of the fractal.
To detect a signal in the " Number of candles on each side of the fractal " variable, you can adjust the number of bars on each side fr
FREE

Master Candle (MC) Indicator automatically detects "Master Candles", also known as "Mother Candles", i.e. candle that engulf several candles that follow them. See screenshots. You can choose how many candles Master Candle should engulf. By default it is set to 4. Feel free to change colour and thickness of lines as it suites you.
I find this indicator to be very useful to identify congestions and breakouts, especially on 60 minutes charts. Usually if you see candle closing above or below "Mast
FREE
Easily track and trade with the trend using this indicator. Uses a circle and line to indicate the trend direction. Excellent for channels. Features alert function.
Parameter TrendPeriod can be changed to your preference. How to use: Simply attach to any chart. Blue circle plus blue line cross below price = Buy. Red circle plus red line cross above price = Sell. Best results when taking higher time frames into consideration before entering a trade. (Hint: Wait for the radar/circle to appear on
FREE

The indicator defines the Bullish and Bearish Engulfing Bar. The pattern has greater reliability when the open price of the engulfing candle is well above the close of the first candle, and when the close of the engulfing candle is well below the open of the first candle. For an engulfing bar to be valid it must fully engulf at least one previous bar or candle - includes all the body and the wick. The engulfing bar can engulf more than one bar as long as it completely engulfs the previous bar.
FREE

This indicator is based on the ADX indicator and indicates the trend very easily.
You can customize the indicator to your needs: ADXPeriod ADXSignal_Level BarWidth CandleWith HeikenAshi
The Adx color candles indicator is fully FREE and compatible with the other part of the system; the Acc arrow >>>> https://www.mql5.com/en/market/product/33770 ENJOY and check out my other indicator: https://www.mql5.com/en/market/product/32111
FREE

R 3MA クロス インジケーターは、3 つの移動平均線のクロスオーバーに基づくアラートを備えた人気のトレンド インジケーターであり、高速、中速、低速の移動平均で構成されています。
キーポイント より速い移動平均線が中程度の移動平均線とより遅い移動平均線の両方を上に超えると、買いアラートが発生します。
速い移動平均が中程度の移動平均と遅い移動平均の両方を下方に交差すると、売りアラートが発生します。
それと取引する方法は? 緑色の R 3MA クロス矢印がチャートに表示されるたびに、買い取引を開始します。 赤色の R 3MA クロス矢印がチャートに表示されるたびに、売りトレードを開始します。 チャート上で反対の取引シグナルが発生したら、取引を終了します。
R 3MA Cross Forex インジケーターで取引を開始および終了するために、お好みの取引方法を自由に使用してください。
仕様 取引プラットフォーム: Metatrader 4
通貨ペア: どのペアにも対応
時間枠: 任意の時間枠で機能します
入力パラメータ: より速い MA、より遅い MA、中程
FREE

回帰取引を意味する専門的かつ定量的なアプローチを実装する独自の指標。これは、価格が予測可能かつ測定可能な方法で迂回して平均に戻るという事実を利用しており、非定量的な取引戦略を大幅に上回る明確な出入りルールを可能にします。 [ Installation Guide | Update Guide | Troubleshooting | FAQ | All Products ]
明確な取引シグナル 驚くほど簡単に取引できます カスタマイズ可能な色とサイズ パフォーマンス統計を実装します ほとんどの取引戦略を上回ります 適切なSLおよびTPレベルを表示します 電子メール/音声/視覚アラートを実装します
使い方
インディケータは、より高い時間枠からの完全にカスタマイズ可能な移動平均の周りの標準偏差を測定し、トレンドフォローアプローチを使用して正確に取引を見つけます。取引は、現在のチャートの価格アクションに飛び込むことによって見つけられ、価格が選択したより高い時間枠から計算された平均価格帯に戻ったときに閉じられます。それがコード化される方法のために、指標は高ボラティリティと強いトレンドの
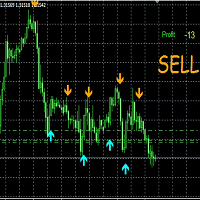
Your money-making tool is here!! This is an indicator that provides analysis and identification of the current trend in any time frame of any trading market, Product now free, please register by link here: Broker recommened exness , Channel live trading Signals Vip :
Signal https://www.mql5.com/en/signals/2229365 EA https://www.mql5.com/en/market/product/104810 Profit from 10% to 30% per month, try it now with 5k-10k$ to have good income
Only copy and profit will auto
FREE

The UNIVERSAL DASHBOARD indicator will eliminate the need of using dozens of indicators on dozens of charts. From one place you can monitor all the pairs and all the timeframes for each of the following indicators: MACD STOCHASTIC WPR RSI CCI You can also use any Custom indicator in the dashboard as long as it has a readable buffer. With a single click you can quickly navigate between charts, pairs and timeframes. Alerts will provide clear indication about what happens for your favorite pairs on
FREE

Classic Range BreakOut Expert Advisor "The opening range breakout strategy is a logical and repeatable strategy that involves traders building firm market direction biases after price breaks above or below the market defined opening price range of a session"
You can select the number of bars and width in pips. Works in all pairs. RECOMMENDED: test first in a Demo account for 1 or 2 weeks.
FREE

Introduction to Fractal Moving Average Fractal Moving Average indicator was designed as part of Fractal Pattern Scanner. Inside Fractal Pattern Scanner, Fractal Moving Average Indicator was implemented as multiple of chart objects. With over thousands of chart object, we find that it was not the best and efficient ways to operate the indicator. It was computationally too heavy for the indicator. Hence, we decide to implement the indicator version of Fractal Moving Average indicator to benefit
FREE
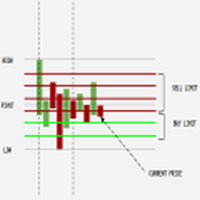
The EA creates a grid of equally spaced pending limit orders taking into account: - The current price; sell-limit above / buy-limit below - The trading range; computed by using the weekly highs and lows The EA then manages the orders while they have been executed. The logic is: IF #EXECUTED ORDERS == 2 OPEN NEW LIMIT AT THE PEN. PRICE
IF #EXECUTED ORDERS > TOT - 2 RESET THE LIMIT ORDERS TO RANGE - check the video for the full strategy at: https://youtu.be/f_ebFsGpIZQ?si=k8IBWe4qJxpz2zj
FREE

作業ロジック
ストップアウトユーティリティは、ストップアウトレベルまで残っているポイント数を示すシンプルですが非常に便利なインジケーターです。
その利点は、多くのトレーダーが利益を追求して取引する際のリスクを故意に過大評価し、利用可能な証拠金を最大限に使用するという事実にあります。この場合、ブローカーがあなたのポジションを強制的に閉じることができる場所を知ることは非常に重要です。
チャートにインジケーターを配置するだけで、買いまたは売りのオープンポジションに応じて、チャート上にこの取引の価格の境界マークが表示されます。
ポジションを開くまで、ラインはチャートに表示されません。 おすすめのロボットスキャルパー- https://www.mql5.com/en/market/product/77108
変数
フォントサイズ-ラベルのフォントサイズ
エッジインデント-エッジからインデントします
線の色-線の色
テキストの色-テキストの色
FREE

TD Combo is better when you have sharp directional moves, because it requires only thirteen price bars from start to finish compared to TD Sequential which needs at least 22 bars. The criteria for a Setup within TD Combo are the same with those required for a Setup within TD Sequential. The difference is that the count starts at bar 1 of the setup and not from bar 9 and TD Combo requires four conditions to be satisfied simultaneously.
Requirements for a TD Combo Buy Countdown
- Close lower
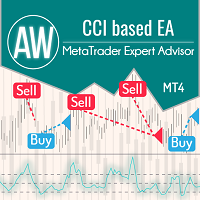
Expert Advisorは、従来のCCIインジケーターのシグナルを処理します。システムには多くのシナリオと柔軟な構成があります。平均化、最初と最後のバスケット注文を閉じる機能、および自動ロット計算の機能を使用します。 Problem solving -> HERE / MT5 version -> HERE / Instruction -> HERE 利点: 簡単なセットアップと直感的なパネルインターフェース カスタマイズ可能なCCIインジケーター信号 必要に応じて平均化を使用 内蔵の自動ロット計算 最初と最後のバスケット注文を閉じるための組み込みシステム 通知の3つのタイプ:プッシュ、電子メール、アラート アドバイザーの仕組み: シグナルを購入する: インジケーターの上縁が下から上に交差するとき インジケーターの下縁が下から上に交差するとき シグナルを売る: インジケーターの上縁が上から下に交差するとき またはインジケーターの下縁が上から下に交差するとき 取引戦略オプション: 売買は許可されており、EAはインジケーターからのシグナルに従って両方向で取引を行
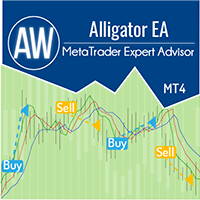
完全自動化された高度なトレーディングロボット。古典的なアリゲーターインジケーターのシグナルで動作します。ポジションを終了するには、インテリジェントなトレーリングシステムまたは未決注文を使用した平均化を使用します。 利点:
完全自動システム、 カスタマイズ可能なインジケーターパラメーター、 自動ロット計算機能搭載、 直感的なセットアップ、 乗数の設定、 シンプルなパネルインターフェイス。 問題解決 -> こちら / MT5 -> こちら インジケーターの本質: Alligator インジケーターは 3 つの移動平均で構成されます。 顎は長く滑っています (青)、歯は中程度に滑っています (赤)、唇は速く滑っています (緑)。このインジケーターは、トレンドの存在とその方向を判断するのに役立ちます。 緑が上、赤が下、そして青の場合は上昇傾向です。青が上、次に赤、下が緑の場合は下降トレンドです。インジケーターの線が絡み合っている場合、顕著な傾向はなく、市場は横ばいの状態にあります。 戦略: インジケーターがトレンドの開始と確認を示している場合、EA は現在の方向を継続して注文をオープ

Slope Trend Robot is the Expert Advisors trading with a combination of multiple strategy trading algorithms (Trend, Level Trading, and Money Management with Martingale recovery loss to profitable).
The Trading algorithms. 1. Follow trends with Indicators is Moving average and Envelopes. 2. Open order two ways that trading both BUY and SELL. 3. Open orders with distance. 4. Close order follow indicator's signal with a profit.
How to work? Open BUY When Moving Average Cross Above Envelopes
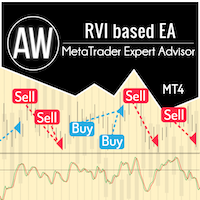
AW RVI ベースの取引は、古典的な相対活力指数 (RVI) オシレーターのシグナルに基づいています。ポジションを決済するには、インテリジェントなトレーリング システムと保留中の注文を使用した平均化を使用します。エキスパートアドバイザーには、リスク管理の自動計算、柔軟な設定、および多くの作業シナリオの組み込み機能があります。 問題解決 -> ここ 利点: 柔軟な自動取引システム、 組み込みの調整可能なトレーリング システム、 EA内のカスタマイズ可能なオシレーター信号、 入力変数の直感的で簡単な設定、 あらゆる種類の商品とあらゆる時間枠に適しています。 リスク管理の自動計算のためのプラグ可能なシステム。 ノート! EA はオシレータ ラインを表示しません。 ストラテジー: RVI は、現在の値動きのエネルギーを示し、高値と安値の範囲で始値と終値の間の値動きの有効性を反映するオシレーターです。これは、さらなる動きが継続するかどうか、およびその可能性を判断するのに役立ちます。 古典的なオシレータとは異なり、RVI には買われ過ぎゾーンと売られ過ぎゾーンがありませんが、RVI ラ

EA は、マクロ経済統計とニュース結果に基づいた高度な人工知能を使用してトレンドを判断します。 EA は CCI インジケーターを使用して、トレンドに合わせて取引を開始します。 EA が動作するには、必ず「WorkMode」設定を「mode_Real」に変更してください。 Expert Advisor はニュース Web サイトに接続するため、[Tools] > [Options] > [Expert Advisors] で [Allow WebRequest] にチェックを入れる必要があります。 「 https://ec.forexprostools.com 」、「 https://worldtimeserver.com 」を追加し、「OK」を押します。
リアルタイムの結果はここで 確認できます 。 個人ボーナスを獲得するには、購入後すぐにご連絡ください。 設定・マニュ アルはこちら
EA は m15 チャートのすべての米ドルペアで動作します
パラメーター:
ワークモード - mode_Real ユーザーがオープンした注文を制御 – True/False 最大購入数

updated hidden market support and resistance. this indicator is made for new current market that has new support and resistance that some traders struggle to see. The indicator works on all timeframes from the 1-minute timeframe to the monthly One Trading tip to use When price is at resistance and the indicator appears wait for a bearish candle to close then enter a sell trade. Same applies for a buy trade when price reaches support level, and the indicator appears wait for the bullish candle
FREE
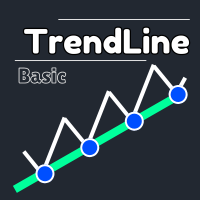
この強力なツールは、トレンドラインを自動的に識別し、取引戦略を合理化し、より多くの情報に基づいた決定を下すのに役立ちます。 mt5バージョン
重要な機能 自動トレンドライン検出 :「基本的なトレンドライン」インジケーターは、潜在的なトレンドラインの市場をスキャンし、チャートに即座に表示します。これにより、貴重な時間を節約し、重要な傾向を見逃すことはありません。 ユーザーフレンドリーパネル :私たちのインジケータには、さまざまなトレンドラインを簡単に描画できる美しく直感的なパネルが付属しています。パネルは、すべてのエクスペリエンスレベルのトレーダー向けに設計されているため、数回クリックしてトレンドラインを追加、編集、または削除できます。 お気に入りのトレンドラインを保存して管理 :あなたにとって最も重要なトレンドラインを追跡します。私たちのインジケータを使用すると、好みのトレンドラインを保存し、チャートを再訪するたびに常に利用できるようにします。 汎用アプリケーション :外国為替、株、または暗号通貨を取引しているかどうかにかかわらず、「基本的なトレンドライン」インジケーターはさまざま
ChartOverlay indicator has two main functions 1. mirroring - i.e. for example, it will make USDEUR from EURUSD 2. displaying the price chart of the selected financial instrument (with selected period) in the subwindow of the main chart. This tool allows traders to easily analyze the relationship between different currency pairs and assets, offering unique customization and visualization features.
Key Features: Price Chart Display: The indicator displays the price chart of the selected instrum
FREE

LotSize Indicator Discover the appropriate lot size to use in your trades based on the available margin. This indicator provides valuable information for risk management. If the indicator shows a value of 0, it means that your balance or available margin is insufficient for trading. It is important to maintain adequate margin levels for safe trading practices. This indicator is exclusively designed for the MT4 platform, a popular and reliable trading platform in the market. With the LotSize Indi
FREE

Blue Chip Investing を紹介します。これは、努力せずに利益を最大化するために設計された画期的なForexロボットです。ブレイクアウトとボラティリティトレーディングを専門としており、一貫した利益を求めるトレーダーにとって究極のツールです。 最適なパフォーマンスのために、Blue Chip Investingは EURCHF ペアと1時間足( H1 )タイムフレームでのみ運用してください。 主要機能: 先進的なAI技術によって動かされ、Blue Chip Investingはリアルタイムの市場データを分析し、トレンドを特定して正確に結果を予測します。 初心者から経験豊富なトレーダーまで、どのスキルレベルのユーザーでも簡単にナビゲートし、機能を活用できるユーザーフレンドリーなインターフェース。 市場の変化に合わせて学習し、適応することで、継続的に改善しています。 堅牢なリスク管理システムを装備し、各トレードは現在の市場条件に合わせてカスタマイズされたストップロスとテイクプロフィット機能で保護されています。 2010年から2020年までの訓練を受け、その後のライブ結果を提供す

メタトレーダー用ボリュームプロファイルインジケーターで、ボリューム分析の威力を実感してください! / MT5バージョン
ベーシックボリュームプロファイルは、取引の最適化を目指すマニュアルトレーダーのために特別に設計されたインジケーターです。ボリューム・プロファイル・インジケータは、市場の動きをより深く理解したい本格的なトレーダーにとって不可欠なツールです。当社の革新的なソリューションにより、取引量が価格にどのように分布しているかを明確かつ簡潔に視覚化することができます。これにより、支持線・抵抗線、集積・分配ゾーン、重要なコントロール・ポイントなど、主要な注目エリアを特定することができます。特定の日の取引量を表示する通常の出来高インジケーターとは異なり、ベーシック・ボリューム・プロファイルは特定の価格における取引量を表示します。
当社のインジケータは、直感的でカスタマイズ可能なインターフェイスを備えており、お客様の取引の好みに合わせてカスタマイズすることができます。
特徴 価格チャート上に出来高プロフィールを明確に表示。 出来高の多いエリアと少ないエリアを素早く識別。 取引

GALAXY it is a Secure Automated Software for trade Forex market and indices. Architecture is a Fully Automatic Autonomous Robot Expert capable
Independently analyzing the market and making trading decisions
GALAXY It is an advanced trading system. This is a fully automatic Expert Advisor.
NO INPUT TO SELECT FOR THE TRADER ALL AUTO MATED THIS SYSTEM IS ALWAIS IN THE MARKET IN THE TWO DIRECCTION MAKE WINING CYCLES
GALAXY . It is a 100% automatic system, the system contr

An indicator from the zigzag family with levels. First of all, I will point out arguments in favor of the advisability of using a level indicator. They give the trader the following benefits:
Alternative points of view - the level indicator helps to look at the levels from the side, compare them with several automatic systems, identify errors;
Saving time - reducing the cost of effort for self-building lines;
Exact mathematical calculation - quick calculation of levels, ratios of indicato
WONNFX iN M5 - Arrow indicator for Forex and Binary Options. Reliable signal algorithm. Indicator not repaint. Indicator working hours: 21:55-23:00. GMT+2. Average winrate = 60-70%.
Recommendations: Timeframe: M5. Expiration: 2-3 candles (1 candle = 5 minutes) Symbol: EURUSD, USDJPY, EURAUD, GBPAUD, EURJPY, AUDUSD, USDCAD, NZDUSD, AUDCAD, AUDCHF, AUDJPY, AUDNZD, CADJPY, EURCAD, EURGBP, GBPUSD, GBPCAD, NZDJPY, CADJPY, XAUUSD
FREE

The three white soldiers and the three black crows candlestick patterns are reversal patterns that predict a change in the direction of a trend. The pattern consists of three consecutive long-bodied candlesticks that open within the previous candle's real body and a close that exceeds the previous candle's. It's important to note that both formations are only valid when they appear after a strong uptrend or a downtrend, while their efficiency decreases in choppy markets.
Inputs AlertOn - e
FREE

このプロジェクトが好きなら、5つ星レビューを残してください。 インスタグラムでフォロー:borelatech 大規模なボリュームを取引するには、複数の楽器/チャートを調べる必要があります
新しい機会を見つける, このインジケータは、特定の特定のプロットによってあなたを助ける
数またはそのサフィックスの複数のレベルによって、それらを自動的に更新します
価格が変更されると、そうでなければ退屈なタスク。 例えば、GBPUSDでは、インジケーターの4つのインスタンスを
チャートをプロットする: 線長100バーの各0.01間隔。 線の長さ25バーの0.0075間隔で終わる各価格。 線長50バーの0.0050間隔で終わる各価格。 25バーの線長で0.0025間隔で終わる各価格。 このようにして、定規に似ているので、この例が非常に見られます。
スクリーンショット。 また、色やラインのスタイルを異なるスタイルで設定できます。
レベルを視覚化しやすいようにします。
FREE

With this indicator, you can easily make price regions in all time zones. In addition, with the automatic supply demand finder, you can ensure that the new regions are found automatically. You can increase your transaction quality by reaching more accurate operations with this auxiliary Tool and indicator.
I share your trial version of EURUSD for free with you. If you want to buy the working version in all parities, you can contact me. +New version Gap Bar Add ( Press G keyboard ) Default co
FREE
EA245 Draw Supply Demand v1 This EA only good for draw Supply and Demand, you can use draw with two Time Frame input (True/False). Manual Traders can use as tool for support and monitor the price near Supply and Demand before excute to open Buy or Sell orders Note: The result of Auto Trading normaly not good, so please consider select True or False open Order (item [11]). This EA for free so you can use and share for your friends. If you have any question, please contact our gruop via informatio
FREE

Easy to use, fully automated neural network trading robot. Works on the H1 timeframe with two currency pairs (AUDCAD, USDCAD). Limitations of the free version - only two currency pairs support (7 in the full version) and 0.01 lots max order size.
Minimal recommended deposit size: with grid enabled - $150 per symbol; with grid disabled - $100 for all symbols.
Paramutras Instruments - currency pairs to trade; Order size calc method - type of the calculation of the order size; Fixed order size
FREE

EURUSD H1 Simple Martingale that works on daily swing levels, low DD, TP and SL defined on the basis of certain pre-set calculations in the algorithm, executes one trade at a time, weekly trading no overnight on weekends, possibility to establish customized exit times, possibility of customize money management. average return of 7.92% per year with the factory settings of the V1, it is always constantly updated, it is recommended to use it with a GMT +2 server TESTED SINCE 2003
Happy trading
FREE

This simple indicator paints with a darker color on the volume bar when the quantity traded is above the average of select number of periods of the volume itself, highlighting the moments when there was a large volume of deals above the average. It is also possible to use a configuration of four colors where the color tone shows a candle volume strength. The indicator defaults to the simple average of 20 periods, but it is possible to change to other types of averages and periods. If you like
FREE

VR Cub は、質の高いエントリーポイントを獲得するためのインジケーターです。このインジケーターは、数学的計算を容易にし、ポジションへのエントリーポイントの検索を簡素化するために開発されました。このインジケーターが作成されたトレーディング戦略は、長年にわたってその有効性が証明されてきました。取引戦略のシンプルさはその大きな利点であり、初心者のトレーダーでもうまく取引することができます。 VR Cub はポジション開始ポイントとテイクプロフィットとストップロスのターゲットレベルを計算し、効率と使いやすさを大幅に向上させます。取引の簡単なルールを理解するには、以下の戦略を使用した取引のスクリーンショットを見てください。 設定、設定ファイル、デモ版、説明書、問題解決方法は、以下から入手できます。 [ブログ]
レビューを読んだり書いたりすることができます。 [リンク]
のバージョン [MetaTrader 5] エントリーポイントの計算ルール ポジションをオープンする エントリーポイントを計算するには、VR Cub ツールを最後の高値から最後の安値までストレッチする必要があります。
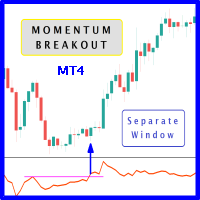
When prices breakout resistance levels are combined with momentum oscillator breaks out its historical resistance levels then probability emerges to record farther prices. It's strongly encouraged to confirm price breakout with oscillator breakout since they have comparable effects to price breaking support and resistance levels; certainly short trades will have the same perception. Concept is based on find swing levels which based on number of bars by each side to confirm peak or trough and in
FREE

This indicator displays Point & Figure charts (PnF charts) in the indicator window. PnF charts show only price movements that are bigger than the specified box size. It helps to eliminate noise and allows focusing on main trends. Time is not a factor here. Only price movements are taken into account. That is why PnF chart is not synchronized with the main chart it is attached to. More about PnF charts: http://stockcharts.com/school/doku.php?id=chart_school:chart_analysis:pnf_charts Indicator wor
FREE

This is a multi timeframe version of the Supply and Demand indicator . It allows you to analyze a chart using the law of supply and demand on three different timeframes at a time. You will see zones of sales and purchases and determine the most profitable points to open positions. The indicator is based on the principle of market fractality. Supply and demand zones show places where a strong buyer or seller has made the price reverse and change its direction. The indicator has several types of

RSI Candle Signal Indicator will change bars’ color when set overbought or oversold levels reach.
How to Use RSI Candle Signal Uptrend/Downtrends - RSI may be used to detect trending markets. For example, the RSI may stay above the mid line 50 in an uptrend. Top and Buttoms - RSI may help in identifying the tops around the overbought readings (usually above 70), and the bottoms around the oversold area (usually below 30). Divergence - divergence occurs when RSI directional movement is not c
FREE
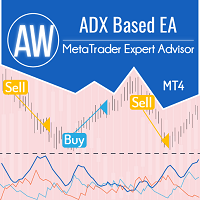
Expert Advisor は、ADX インディケータのシグナルに従って取引を行います。 PlusDi と MinusDi の相対的な値によってトレンドを決定する古典的な戦略は、インディケータのメインラインによって決定されるトレンドがアクティブな場合に使用されます。取引は現在のトレンドの方向に実行されます。 Problem solving -> Here / MT5 version -> Here / Instruction -> HERE 利点: 構成可能なインジケータ信号 あらゆる種類の商品とあらゆる時間枠に適しています 必要に応じて平均化を使用 最初のオーダーを最後のオーダーでオーバーラップするプラグ可能なシステム 仮想テイクプロフィット 3種類の通知があります 取引量を自動計算する機能 ストラテジー: Expert Advisor はインディケータシグナル ADX に従って動作します。 ポジションを開くには、メイン、マイナス、プラスの 3 つのインジケーター ラインが使用されます。 主線は、トレンドの強さ、つまり価格が動く活動を示しています。 残りの

This EA only created for AUDCHF with an Risk Reward 1:2 Download Set Files - CLICK HERE NO GRID, NO MARTINGALE and NO MORE OVERTRADING. Add This to Activate News Filter - https://ec.forexprostools.com/ Features :- Symbol AUDCHF Brokers IC Markets, Tickmill, Pepperstone Account Type Raw Spread, Pro, Razor Leverage Recommended 1:500 Timeframe 15M Settings Download Minimum Deposit $100 Risk Reward 1:2 Strategy Market Movement
Why Should You Use This EA:
Market Movement Strategy. Har
FREE

The Multi Trendlines indicator automatically draws the dominant trendlines on the current chart. The indicator looks for the 5 best Up trends and the 5 best Down trends as at the current price, drawing each trendline if filter conditions are met. The trendlines are named "Trendline"+[Direction]+Symbol()+TrendlineSequenceNumber For example: The second Up trendline on a EURUSD chart would be named "TrendlineUpEURUSD2". To get its current value would be: ObjectGet("TrendlineUpEURUSD2",OBJPROP_PRI
FREE

This indicator is one of the useful tools for traders who trade on currency pairs and based on the strength of each currency they can make a correct decision or confirmation in the positions. It has been calculated for all the minor currency pairs supported by the broker and displays the values of the major currencies. These currencies are displayed horizontally or vertically according to the trader's config when executing the indicator. One of the trading strategies that can be used is to cho
FREE
MetaTraderマーケットはトレーダーのための自動売買ロボットやテクニカル指標を備えており、 ターミナルから直接利用することができます。
MQL5.community支払いシステムはMetaTraderサービス上のトランザクションのためにMQL5.comサイトに登録したすべてのユーザーに利用可能です。WebMoney、PayPal または銀行カードを使っての入金や出金が可能です。
取引の機会を逃しています。
- 無料取引アプリ
- 8千を超えるシグナルをコピー
- 金融ニュースで金融マーケットを探索
新規登録
ログイン