YouTubeにあるマーケットチュートリアルビデオをご覧ください
ロボットや指標を購入する
仮想ホスティングで
EAを実行
EAを実行
ロボットや指標を購入前にテストする
マーケットで収入を得る
販売のためにプロダクトをプレゼンテーションする方法
MetaTrader 4のためのエキスパートアドバイザーとインディケータ - 52
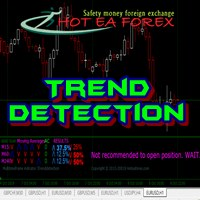
Recognizing trends is one of the most important analytical skills in trading. Not only technical traders, those who are fundamentally leaning to make the forex trend as the basis of analysis to determine entry trading. However, learning how to look at forex trends is not as simple as it seems. If you want signal accuracy to estimate the direction of the next price, then there are advanced methods in learning how to look at forex trends that you need to know. Strategy SIMPLE HOw to read trend mar
FREE
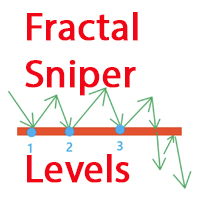
Fractal Sniper Levels is a powerful technical indicator that finds a rebound of fractal formations from one price zone. The main feature of the indicator is that it analyzes fractals not just as extremes, but as full-fledged reversal formations, which significantly increases the reliability of the determined levels.
Key advantages Working with fractals as reversal formations, and not just as local extremes Intelligent analysis of each fractal's rebound from the levels of the same price zone A
This EA trades untested fractals using pending orders. It offers many trading behaviors and flexible position management settings, plus many useful features like customizable trading sessions and a martingale mode. [ Installation Guide | Update Guide | Troubleshooting | FAQ | All Products ] Easy to use and supervise It implements 4 different trading behaviors Customizable break-even, SL, TP and trailing-stop Works for ECN/Non-ECN brokers Works for 2-3-4-5 digit symbols Trading can be NFA/FIFO Co
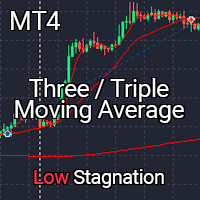
!!! Current price of $30 will be soon increased to $50, so if you want to get a discounted price this is your last chance !!! Look at the screenshots to see how profitable this Expert Advisor is!!! The Three (or Triple) Moving Average Trading system uses three moving averages, a short, a medium and long period. Trades long when the short moving average cross up the medium moving average and the medium moving average is higher than the long moving average. When the short moving average cross dow

Parabolic SAR is one of the most popular indicators allowing you to determine in a timely manner the trend reversal, get an early entry point and accurately define the place of profit taking. Parabolic SAR is very efficient in case of a trendy market but often gives false signals during a flat. In order to sort such signals out, it is possible to use the same indicator on higher timeframes. This eliminates the main drawback of the indicator during a flat, while retaining its advantage of early e

This indicator analyzes price action patterns and helps you to make positive equity decisions in the binary options market. [ Installation Guide | Update Guide | Troubleshooting | FAQ | All Products ] Easy to trade Trade both call and put options No crystal ball and no predictions The indicator is non-repainting The only strategy suitable for binary options is applying a mathematical approach, like professional gamblers do. It is based on the following principles: Every binary option represents
This is exactly what the name says. Visual strategy builder . One of a kind. Turn your trading strategies and ideas into Expert Advisors without writing single line of code. Generate mql source code files with a few clicks and get your fully functional Expert Advisors, which are ready for live execution, strategy tester and cloud optimization.
There are very few options for those who have no programming skills and can not create their trading solutions in the MQL language. Now, with Bots Builde
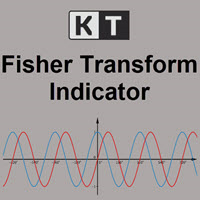
KT Fisher Transform is an advanced version of the original Fisher Transform oscillator equipped with divergence detection, crossover alerts, and many more features. Originally it was developed by John F. Ehlers. It converts the asset's price into a Gaussian normal distribution to find the local extremes in a price wave.
Features
A light-weighted oscillator that efficiently identifies the upward and downward crossovers and marks them using vertical lines. It also finds regular and hidden diverg

Overview A One-Cancels-the-Other Order (OCO) is a pair of orders stipulating that if one order is executed, then the other order is automatically cancelled. Verdure OCO EA brings this functionality to MT4. This EA is a robust implementation of the popular One-Cancels-the-Other Order (OCO) but with added benefits, features and options. It is an EA that helps with trade management and especially useful for traders who use stop and reverse trading systems, traders who look for opportunities around

Overview The TD Sequential EA is a sophisticated automated trading system designed to capitalize on the TD Sequential indicator, developed by Tom DeMark. This EA identifies trading opportunities based on TD Sequential setups and executes trades with predefined risk management parameters. It offers a clean and customizable chart appearance and allows users to set their own lot sizes and other trading parameters. Key Features Automated Trading : Executes buy and sell orders based on TD Sequential

The indicator is designed for displaying the following price levels on the chart: Previous day's high and low. Previous week's high and low. Previous month's high and low. Each of the level types is customizable. In the indicator settings, you set line style, line color, enable or disable separate levels. The version of the exact same indicator but only with sound alerts there - Time Levels with Alerts .
Configurations ----Day------------------------------------------------- DayLevels - enable/
FREE

This is an expanded version of the Time Levels indicator provided with sound alerts notifying of level intersection. The indicator is designed for displaying the following price levels on the chart: Previous day's high and low. Previous week's high and low. Previous month's high and low. Each of the level types is customizable. In the indicator settings, you set line style, line color, enable or disable separate levels. This version is provided with an option for alerting using an audio signal a

Concept
Gold Evolution is a system that identify the safest entry and exit points.
This system is focused on a long-term stable growth .
It is a professional strategy developed years ago for manual trading of Gold, and now, perfectly adapted to automated trading .
It does not need to be constantly updated as it adapts naturally to varied market conditions.
No martingale, no grid, no hedge, no other dangerous strategy. Only strict rule-based approach to trading, allowing to maximise return w
FREE

Photocopy MT4 is an Copier of transactions through Telegram channel. Will help you instantly publish your trade in Telegram channel or copy trades from Telegram channel. The utility can work in two directions by receiving signals in MT4 and transmitting signals to Telegram . No more missed deals No more panic Capital Management Ease of use
You can use it for:
Copying your own deals through Telegram channel (via the Internet); Copying trades from MT5 to MT4 and vice versa. Propagation of signa
FREE
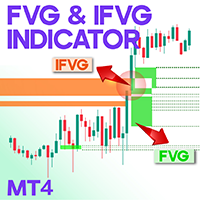
FVG and IFVG Indicator MT4
The Fair Value Gap (FVG) and Improved Fair Value Gap (IFVG) indicator for MetaTrader 4 identifies crucial liquidity zones based on the Inner Circle Trader (ICT) methodology. Fair Value Gaps emerge when rapid price fluctuations create unfilled price regions due to heightened volatility. Over time, prices often revisit these gaps. The Improved Fair Value Gaps (IFVG) function similarly but shift their role upon a breakout, acting as a support or resistance level afterwar

This indicator is designed to find the difference in RSI price and indicator. This indicator shows the price and indicator difference on the screen. The user is alerted with the alert sending feature. Our Popular Products Super Oscillator HC Cross Signal Super Cross Trend Strong Trend Super Signal
Parameters divergenceDepth - Depth of 2nd ref. point search RSI_Period - Second calculation period indAppliedPrice - Applied price of indicator indMAMethod - MA calculation method findExtInte

究極の取引指標である Constant Grow を使用して、取引口座の一貫した成長の秘密を解き明かしましょう。 RVI シグナル、移動平均、出来高、ストキャスティクス、アリゲーターなどの高度な指標の組み合わせを利用したこの革新的なツールは、その有効性を確保するために 2 年間 (2021 ~ 2023 年) にわたって綿密にバックテストが行われています。
Constant Grow を使用すると、リスクを最小限に抑えながらアカウント残高を保護および拡大できるようになります。 当社の専門アドバイザーが資金管理のあらゆる側面を担当し、お客様が収益性の高い取引を行うことに集中できるようにします。 利用可能なポジションに固定ロットサイズを設定するだけで、残りの作業は GBPJPY H1 エキスパートにお任せください。
複雑な設定や推測を心配する必要はありません。 Constant Grow は、あらゆる通貨ペアとシームレスに連携し、独自の機能を活用して最大の収益性を実現するように設計されています。 トレーディング ゲームを強化し、比類のない成功を体験するこの機会をお見逃しなく。 Con
FREE
The ChannelSgnals Indicator for MT4 is an effective Forex trading tool designed to track market movements. The MT4 signal point indicator effectively detects trend reversals after they have already occurred. The ChannelSgnals Indicator is a fully automated technical tool that includes a number of parameters to track market trends. It automatically examines the ever-changing price dynamics of the market, compares the information with earlier data and generates a trading signal. Because the
FREE

A simple risk management tool that closes all open orders if equity drops by a specified percentage. This tool is useful if you are running multiple EAs and multiple charts and pairs in order to control your risk. All orders will close accordingly. Once it hits specified percentage drawdown the closing of all orders cannot be stopped. The EA will reset once all orders are closed, until account equity drops again relative to account balance. Use at your own risk. This is only for MT4. There is o
FREE

TH3ENG CURRENCY STRENGTH SCANNER The best currency strength reader based on more than 4 excellent modes, based on Price action and Volume with various algorithms. This indicator reads all pairs data to measure and find the best results of all currencies and arrange it in a separated dashboard panel.
You can find the strongest currency and the weakest currency, then trade on them pair. NOT COPLICATED NOT REPAINTING NOT LAGING
Input Parameters
=== SYSTEM SETTING === Calc. Mode ==> Calculation m
FREE

The Expert Advisor tool has been developed for NQ (Nasdaq), based on break logic and trend filter. The stop loss is based on fixed pips. It has been backtested on more than 10-year long on M1 data with high quality of modeling. The enclosed screenshots demonstrate the complexity and coverage of the test by Monte Carlo analysis with 200 simulations. The Expert Advisor passed via Cluster Analysis, Optimization profile, System parameter Permutation . There is no need to set up parameters - al
FREE

The EA waits for a spike according to a specific logic and opens a position in spike direction setting stop loss and take profit. When positions are in profit they are managed with smart trailing mechanism based also on elapsed time from opened position. It works with 5-digit and 4-digit broker. Must be used on M1 chart. Does not need historical data. It does not use : Martingale. Grid. Hedge.
Parameters spikeFilter - value to decide opening positions takeProfit - take profit in points stopLoss

The Magic SMA indicator is of great help in determining trend direction. It can be an excellent addition to your existing strategy or the basis of a new one. We humans can make better decisions when we see better visually. So we designed it to show a different color for rising and falling trends. Everyone can customize this in the way that suits them best. By setting the Trend Period, we can optimize it for longer or shorter trends for our strategy. It is great for all time frames.
IF YOU NEED
FREE
Discover IT MACD Crossover, your ultimate ally for maximizing your profits in the foreign exchange market. Our Expert Advisor (EA) leverages the powerful MACD technical indicator to execute trades automatically with unparalleled precision.
Key Features:
- MACD Crossover Strategy: IT MACD Crossover is based on the proven strategy of MACD crossover to identify trading opportunities. Crossings between fast and slow exponential moving averages (EMA) trigger buy or sell signals, suitable for all m
FREE

This is a trading EA on M1 Chart for currency pair GBPUSD. I don't recommend you to use in other charts or currency pairs. Backtests are performed at mt5 and my Broker is FxPro. (Mt5 version is https://www.mql5.com/en/market/product/55467 ) "Works On M1 Chart"; // GBPUSD Strategy Properties Parameters are, LessOrderMoreProfitFactor_Flag = false; // Less Order More Profit Factor (trade is very rare but profit factor is high Entry_Amount = 0.01; // __Amount for a new position [lot] Take_Pr
FREE

Uses of EA: Close orders and close charts when conditions are met. in_Test: + True: there is a command when running in Backtest mode. + False: Not entered, used for real time in_Closebyprofit: + true: use payment in USD + false: do not use closed in USD in_profit_win: stop rate (USD) in_profit_loss: stop loss (USD) in_Closebypercent: + true: use close to percent of balance + false: do not use the percent percent of balance in_profit_win: percent stop rate in_profit_loss: perce
FREE

The Profitunity version of Bill Williams in my vision The EA works according to standard indicators: Aligator + AO + Fractals To move into a deal, a pin bar is also used at a distance of N points from the Aligator (Distance Pin from Alig). To exit positions, there is TP, SL, several Trailling options, closing all orders by the total profit. NOT GRAIL but it works! The Profitunity version of Bill Williams in my vision.
What about the settings of the advisor and how it works. Fix Lot - fixed lot
FREE

Note: MT4 Backtest cannot test EAs that trades with several symbols simultaneously. For backtest use MT5 versions download here . Note : Free version can be used for trading on Demo Accounts.
Important :
This is Arbitrage EA and may not work on all accounts. It is recommended to follow the testing process described on product screenshots.
Strategy :
EA will place trades based on Triangular Arbitrage strategy. Triangular arbitrage (also referred to as cross currency arbitrage or three-point
FREE

I present you the Abella Expert Advisor. The "London breakout" occurs in the European session. During this time, Abella follows the market and enters in one of the direction according to the identified Price Action patterns. The EA works both during a flat and trend. This EA has been created for multicurrency trading. Do not Abella on one pair. For optimal performance, use 4 pairs: AUDUSD, USDJPY, EURJPY, GBPUSD (the H1 timeframe) and create a portfolio.
Parameters Lot - fixed lot; Risk - dynam
FREE

Risk Reward ratio indicator for MT4 BING Risk Reward indicator is a powerful, basic, very needed tool for every trader. Clearly visualize Open Price , Stop Loss , and Top Profit levels on your graphs with easy-to-see colors and trendlines.
Does BING Risk Reward show alerts? Of course! BING Risk Reward Indicator offers all Alerts available for the MT4 platform(Email, Popups, Sound, and Push). It shows alerts on Open Price , Stop Loss , and Top Profit. That way, besides easily seeing what is go
Candle Scanner Dashboard is an incredibly powerful tool in the financial markets. It excels at detecting market reversals, trend changes, and retracements. The dashboard displays patterns as they are identified, and with a simple click on each pattern, you can view them on their dedicated charts to precisely locate their occurrences. With its capability to detect 11 popular bullish and 11 bearish patterns, you can trust the dashboard to handle pattern identification effortlessly. It provides an
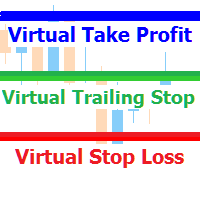
A utility for managing open positions using virtual (invisible to the broker) stops. Virtual stop loss and virtual take profit can be freely moved around the chart. If the price touches the virtual stop line (TP, SL, TS), the EA will close all orders of the same direction on the current chart. Closing orders by virtual take profit is possible only if there is a profit.
With the help of the built-in trading simulator, you can, in the strategy tester, see how the adviser works. Parameters Block

This is one of my first indicators. Slightly improved. The indicator is based on point and figure chart, but their period is equal to ATR indicator values. Parameters: ATRPeriod - ATR period for calculation of steps. XOPips - manual pararmetr, ATR ignoring. Note: The indicator uses closes price, thus it is recommended to consider completed bars. There is a more visual, with the display of lines on the chart and alerts, paid version of XOatrline
FREE

Introducing Real Gainner EA , the technologically advanced expert advisor that comes to transform your trading experience, freeing you from losses and stress, giving you time, peace of mind and profits. * * * * * THIS EXAGGERATEDLY LOW PRICE WILL BE AVAILABLE ONLY FOR NEXT 5 COPIES. * * * * * Real Gainner EA performs deep market analysis in different timeframes in parallel, covering important aspects such as relevant levels, price behavior in real time, volatility, amon

Hi Trade EA is an EA facilitating hand trading. Hi Trader EA is a trading assistant EA, not an automatic order placing EA. Features of EAs Fix Lot will open positions based on the lot size specified by the user. Risk will calculate the lot size based on the percentage of the account balance, considering the distance from the open price to the Stop Loss. Therefore, a Stop Loss value greater than zero is required. TS = Trailing stop with separate stop loss, individual orders. AVR TS = Trailing sto

GS trendS is a trend indicator that can be used for any Forex financial instrument.
The indicator does not redraw and does not lag. Recommended timeframe H1.
It is possible to select the trend algorithm settings {Only Open, Average Open/Close, Average High/Low}
The color indicates the direction of the trend: yellow - direction can be SELL or BUY (S_B)
blue - uptrend (BUY)
red - downward trend (SELL) The indicator panel displays trend values of 5 timeframes for the current price level. The va

Th3Eng Bird Scalper is simple scalper, Many expert traders recommend using it with big accounts with a low lot size. It opens positions based on Analyses.
next new version:: Add news filter Add more filters
Requirements::
Account Balance: 5000$ minimum Spread: Not more than 30 points (3.0 pips). Account type: any account (standard, micro and cent). Platform Digits: Pentagonal platform (five digits symbol price and three on yen symbols X.XXXXX on EURUSD NOT X.XXXX).
Best Setups: EURUSD, 15M E
FREE

The automatic advisor works according to a simple strategy for the breakout of the previous day's high and low. In the settings there is a function to reverse orders Reverse, when the maximum is broken, instead of buying, a sell will be opened, and when the minimum is broken, instead of selling, a buy will be opened. Real monitoring https://www.mql5.com/en/signals/833080
Settings Reverse - when the level is broken, orders will be opened in the opposite direction The maximum number of limit o
FREE

The Predator
The Predator is a trading robot that uses a combination of various custom indicators designed to characterize trends. The Predator uses 2 take profit and stop loss levels. The Predator continually monitors the market after an order and will seek to close the order at MinimumTakeProfit under imminent unfavorable conditions otherwise it maintains the position until MaximumTakeProfit is attained. When the price moves past the minimum stop loss level a second compensating order is

Trade Receiver Free is a free tool to copy trades/signals from multiple MT4/MT5 accounts. The provider account must use copier EA to send the signal. This version can be used on MT4 accounts only. For MT5 accounts, you must use Trade Receiver Free for MT5 . Reference: - For MT4 receiver, please download Trade Receiver Free .
- For MT5 receiver, please download Trade Receiver Free MT5 .
- For cTrader receiver, please download Trade Receiver Free cTrader .
- If you only need copy from MT4 acco
FREE
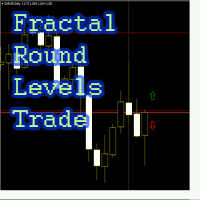
Советник выставляет рыночные ордера, если свеча, на которой появился фрактал, пересекает круглый ценовой уровень, который
используется, как фильтр для входа в рынок по фракталам. Настройки советника: Dig = 2; значение рыночной цены округляется до количества (Dig) знаков после запятой. Пример, рыночная цена на данный момент 1.1228, Dig = 2, цена округляется до 1.1200, если эту цену своими тенями зацепит свеча выбранного графика одновременно с пересечением индикатором RSI на этой свече установлен
FREE
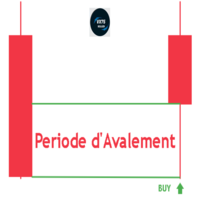
Engulfing Period V75Killed(MT4) – 市場の転換点を正確に捉えよう! (このインジケーターは プライベート であり、その価値を理解しているトレーダーのみが使用できます。) Engulfing Period V75Killed は、MetaTrader 4 向けの強力なツールであり、 複数の時間足 で 強気(ブル)および弱気(ベア)の包み足パターン を自動的に識別します。重要な包み足ゾーンをチャート上に直接表示し、高確率のトレードチャンスを簡単に特定できます。 主な機能: マルチタイムフレーム分析
月足(MN)、週足(W1)、日足(D1)、4時間足(H4) の包み足パターンを自動検出し、市場の流れをより明確に把握。 カスタマイズ可能な表示設定
色、フォント、ラベルの位置やサイズを自由に調整し、自分のトレードスタイルに最適化。 リアルタイム識別
包み足ゾーンを即座に検出し、重要なトレードチャンスを逃さない。 新機能:Doji & Hammer パターンのサポート(v4.00)
包み足ゾーン内の 十字線(Doji) や ハンマー(Hamm
FREE
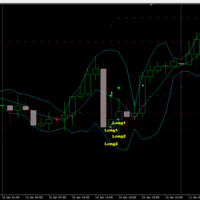
Der rebound EA handelt vollautomatisch
Du bekommst hier einen tollen EA mit extra Zubehör, Kostenlos !
Er verwendet keine gefährlichen Strategien wie Martingale oder Gritter usw. Bei diesem EA kannst du vieles nach deinen Wünschen, oder nach meinem Set einstellen. Zusätzlich hat er einen News Filter, er pausiert die trades während der eingestellten Zeit. Zusätzlich erhöht er auf Wunsch die lots Grösse automatisch.
Der Backtest und die trades wurden mit Fusion Markets gemacht Hebel 1:500 Zer
FREE

MT5 Version Elliot Wave Oscillator MT4 Elliot Wave Oscillator MT4 is an indicator designed to support Elliot Wave counts. The default settings help filtering out the noise in the market allowing a clear perception for the waves counts in differnt timeframes. Elliot Wave Oscillator high customization level allows the you to optimize this indicator to your personal preferences. Shorter Periods and faster reactive MAs will provide more infomation but will require a higher level of experience for
Gold Avatar is a Fully Automated for Trading XAUUSD/Gold. It will be 300$, it is now just 199$. ** New Update = Version 3 ** Contact me immediately after the purchase to send you instruction and add you in group. Default Settings for XAUUSD M15 FEATURES: Easy-to-use, just add EA on chart without any setting.
News Filter and Auto GMT Time are supported XAUUSD - M15
Sets are provided
Limited number of Buyers Free Demo available to download Recommend deposit 100 USD (Cent account) or 1 000 U

Currency Correlation Plus is an expensive version of the indicator. It is equipped with the signal and is more equipped than its cheaper brother. The indicator helps us understand and see a correlation. Second chart makes it easy to analyze and trade multiple currencies. On the chart, you can post multiple pairs. Type in the selected currency pair in the settings and add it to the chart.
Inputs One indicator on chart=True / two or more=False Alert Signal buy and sell for first chart and second

A simple but very powerful EA. It uses two moving averages as a basis for opening orders, which when they cross, orders will be opened. The open order will be closed in two situations: When there is a new crossover opposite the previous one, in this case the price touches the slower moving average, or when it reaches the automatic Take Profit margin. If the price goes in the opposite direction, it will open new orders at the new crossings of the moving averages to calculate the average price and
FREE

Dear Friends,
Please rate this application for the better
Optimal Lot Size Calculator is a Utility tool to calculate the optimal lot size based on your risk percentage on your capital amount. Also you can set your reward Percentage and place your order from the tool itself. You can place all types of orders(Market orders,Limit orders and Stop orders) with stop loss in pips or price level. So will save your time and also easy to place orders with your risk management.
For Limit and Stop ord
FREE

Blahtech Fisher Transform indicator is an oscillator that displays overbought and oversold locations on the chart. The Fisher Transform algorithm transforms prices with any distribution shape into a normal distribution. The end result is a curve with sharp turning points that may help to identify bullish or bearish trends. Fisher Transform values exceeding 1.66 on the daily chart are considered to be good areas for reversal trades. Links [ Install | Update | Training | All Products ]
F

BuySell Volume is an indicator that approximates Buy and Sell volumes based on price movement. Input Description: applied_model: Choose the applied model. In low reversal mode, price is considered receive low bearish pressure during bullish candle's creation (high bearish pressure on high reversal model. In other words, Bullish Marubozu candles has really high Buy Volumes in low reversal model than in high reversal one.
Output Description: Buy and Sell Volume: Determines how many Buy and Sell vo
FREE

40% off. Original price: $50
Ichimoku Trend Finder is a multi symbol multi timeframe trend dashboard that helps traders to monitor and identify potential market trends from one chart. This panel scans the Ichimoku Kinko Hyo indicator in 28 configurable instruments and 9 timeframes for classic Ichimoku trend signals with a deep scan feature to scan all market watch symbols (up to 1000 instruments!).
Download Demo here (Scans only M1 and M5) Settings description here MT5 version here

This indicator shows the crossing between three moving averages (slower, middle and faster ones). When fast MA crosses up middle MA and middle MA crosses up slow MA, the bullish alert is issued. When fast MA crosses down middle MA and middle MA crosses down slow MA, the bearish alert is issued. Signals to close buy positions are generated if fast MA crosses middle MA downwards, signals to close sell positions are generated if fast MA crosses middle MA upwards.
Inputs Fast MA Setup MAPeriod1 = 5

An Expert Advisor with a choice of currency pairs and lot size is published HERE.
The advisor works on a diversification and hedging strategy.
Currency pairs: EURUSD and USDCHF, orders for which overlap (compensate) the final result.
Timeframe: from M5 to H4.
The advisor's strategy:
· We open one Buy deal on EURUSD;
· If you have reached profit, then close the deal;
· If the price went against us, open a new Buy deal, but already on the USDCHF pair;
· After a while, one of the pairs w
FREE

NIGHTCRUSHER is a fully automated expert advisor, designed for scalping on quite market situation.
The Lite - Version is limited to minimal Lot per Pair and dont has lot mulitplier and dynamic function you can also run different strategies like swing trading or grid different Trade Entry Signals different Exit Strategies included (MA Cut / Signal Change / Trailing TP) clever Risk & Money management - Balance based - Longrun trades tracking You can also use a Grid function or Lot multipier, if ne
FREE

Warning:::
Th3Eng Panda trader strategy 2 is the lite version of Th3Eng Panda Pro trader EA
Th3Eng Panda trader EA is a powerful expert advisor that works perfectly for scalping trades as well as swing trades with martingale system(you can disable it==> factor=1 in setting). You can setup it on H4/H1, and on all forex pairs and all CFD pairs. And on M5/M15 and enable reverse strategy from setting if you want.
Requirements: Minimum Balance: 1000$ (10 cent, standard or micro). Spread: all s
FREE

MASi Three Screens is based on the trading strategy by Dr. Alexander Elder. This indicator is a collection of algorithms. Algorithms are based on the analysis of charts of several timeframes. You can apply any of the provided algorithms.
List of versions of algorithms:
ThreeScreens v1.0 - A simple implementation, with analysis of the MACD line; ThreeScreens v1.1 - A simple implementation, with analysis of the MACD histogram; ThreeScreens v1.2 - Combines the first two algorithms in
FREE

This is a multitimeframe RSI indicator defining trends, oversold/overbought zones, as well as all intersections of signal lines from different timeframes on a single chart using arrows and audio alerts. When working with standard RSI, we often need to examine data from all necessary timeframes simultaneously. RSI 7TF solves this issue. If you are only interested in audio signals when signal lines are crossed, then have a look at RSI Alerts . Attention! The indicator uses seven timeframes - M5, M
FREE

This indicator provides the analysis of tick volume deltas. It calculates tick volumes for buys and sells separately, and their delta on every bar, and displays volumes by price clusters (cells) within a specified bar (usually the latest one). This is a limited substitution of market delta analysis based on real volumes, which are not available on Forex. The indicator displays the following data in its sub-window: light-blue histogram - buy (long) volumes; orange histogram - sell (short) volumes

Expert Advisor trading Harmonic Patterns.
All trades covered by fixed Stop Loss & Take Profit. Minimum trading deposit 150 $ . Expert designer to run on USDJPY 15m . chart. No Grid. No Martingale. Works with high spread This EA operates only once per bar opening.
EA uses several different strategies and enters sometimes both directions. part of the patterns the EA will ignore and not trade. 4 different ATR indicators used as filters. SL & TP calculated by the pattern size, the use

The indicator searches for and displays Doji candlesticks on the chart and signals the appearance of such a candle. The direction of the signal depends on the direction of the previous candles, as the Doji signals a reversal or correction. In addition to the possibility of signaling, the power of the reversal is graphically shown (the more green, the more likely growth, the more red, the price will fall). In the indicator settings, you can change the parameters of the Doji candlestick, the closu
FREE

Hello all. This indicator helps you to open a trade, when break out occurred, also you can add to your position and ride it if trend continued. I use it on 1-5 min chart, as you can use short stop loss. Also profit target should be small as well. It is better to enter few small position, so you can book some profit early and ride the rest for bigger gains. Look at the past to have a plan. Enjoy.
FREE

Dynamic Trading Dashboard for MT4 This powerful MT4 trading dashboard offers traders a comprehensive view of current and historical trading performance in an intuitive and visually organized format. With its precision-engineered design, the dashboard provides a seamless blend of real-time insights and historical analysis. This trading dashboard is perfect for meticulous traders who seek a precise, all-encompassing tool to manage open and closed positions while gaining insights into past perform
FREE

Indicator designed for both beginners and professionals. This indicator will help you: reduce the number of errors when opennig orders; predict price movement(in absent of significant news); do not rush to close profitable trades prematurely and increase profit; do not rush to enter the market and wait for "easy prey": and increase the profitability of trading. BUY and SELL signals, ALARM and PUSH - https://www.mql5.com/ru/market/product/127003
FREE
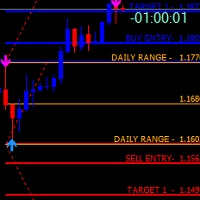
FiboZZ Trade Panel is trade assistants designed for manual trading and include account information panel with automatic drawing of ZigZag Extreme Arrows , Daily Fibonacci Extension with 3 levels for targets. You can use it with the following tow strategies or to use the indicators to create your own strategies. The information panel shows you: -Today and Yesterday Profits, -Balance, -Last Profit, -Last Open Lot Size, -All Open Buy/Sell Position and total lots , -Free Margin Level, -Equity, -24 h
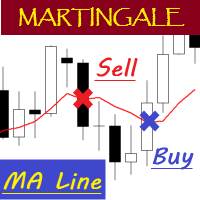
EA "MA Line" with martingale feature
To see how EA works, please watch the video below. In the video, I perform parameter optimization and do a backtest. The parameters that are optimized are: - MA Period - Stop Loss - Take Profit
For the future, I will try to optimize and test EA, especially the expert advisors in the mql5 community. hopefully it can be useful for colleagues in the mql5 community.
FREE

Cmrc
Watch here how to set the bot https://www.youtube.com/watch?v=2wCzTFIGNp4&feature=youtu.be CMRC EA
======================================
The Robot is based on 4 Indicators to catch profitable trades. ==========================================
This Robot is fully automated and has been created for everyone. The Robot works also on cent accounts. =============================================================================================== => works on all Time Frames from 1Minute
FREE
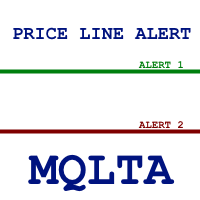
The Price Line Alert Indicator will allow you to set price level that will alert you when hit, the price level will be shown in the chart as lines. Useful to get notified at specific prices, support, resistance, round numbers and so forth. If you want to a similar utility that will automatically close your position at a specific price check https://www.mql5.com/en/market/product/23113
How does it work? You can set several Price Lines and configured them to notify you if the price goes above or
FREE

RoundNumbers indicator is a simple and powerful psychological price levels. Trader usually use these levels as a Support and Resistance (SnR). Indicator Input: Levels - Numbers of levels drawn on chart. Default 30 levels. BoxSize - Box size drawn on each levels, indicate buffers around levels. Default value 1pips (10point) above and below each levels. ZoneSize - Distance between each levels, default value 10pips (100point). Style & Colours - User inputs customization.
For MT5 version, please re
FREE

Flash Scalper is a scalper Expert Advisor that exploits acceleration of volatility of the market. It goes into action when there is an explosion of volatility for example during the news or special events. The minimum volatility is settable from input parameters. The EA work every time with stop loss and take profit, no martingale. Any initial deposit on account is allowed to start work with this expert advisor. The most important conditions for this expert advisor are low spread and fast execut
FREE
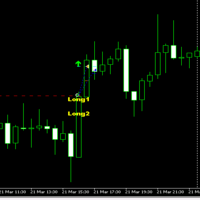
The Breakout EA trades fully automatically He doesn't use dangerous strategies like martingale or gritter etc. With this EA you can set a lot according to your wishes or according to my set. In addition, it has a news filter, it pauses the trades during the set time. In addition, it automatically increases the lots size if desired.
The backtest and trades were done with Fusion Markets: Leverage 1:500 Zero account Account opening with this link: https://fusionmarkets.com/en?cxd=45701_1642076&cx
FREE
MetaTraderマーケットが取引戦略とテクニカル指標を販売するための最適な場所である理由をご存じですか?宣伝もソフトウェア保護も必要なく、支払いのトラブルもないことです。これらはすべて、MetaTraderマーケットで提供されます。
取引の機会を逃しています。
- 無料取引アプリ
- 8千を超えるシグナルをコピー
- 金融ニュースで金融マーケットを探索
新規登録
ログイン