YouTubeにあるマーケットチュートリアルビデオをご覧ください
ロボットや指標を購入する
仮想ホスティングで
EAを実行
EAを実行
ロボットや指標を購入前にテストする
マーケットで収入を得る
販売のためにプロダクトをプレゼンテーションする方法
MetaTrader 4のためのエキスパートアドバイザーとインディケータ - 40

ロボットは、1週間のうちでマルチタイムフレームでローソク足の高値、安値を調査します。
またその価格での反転を予測しながらエントリーします。
ベスト通貨はEURUSD でタイムフレームはH1,H4が好相性です。
デフォルトの設定では、最大で10までエントリーしますので、エントリー数を調整してください。
バスケットクローズを使用して、複数のエントリーを利益が一定値になるとまとめてクローズします。
デフォルトではストップロスは30pipに設定してありますので、ベストの値を入力してください。
利益がマイナスでクローズすると、次のエントリーからロットサイズを上げる設定も使用できます。
タイムフィルターや、GRIDオーダーの機能もついています。 マジックナンバーは自動設定です。複数のチャートにEAをアタッチすると自動で割り振られます。 スプレッドフィルターを使用しない場合はゼロを入力します。 デモテストデーターはMyfxbookと、mq5 webにあります。 URL: Miracle Robot https://www.mql5.com/ja/signals/1795756?utm_
FREE
Great news from today you can test indicator within1 week absolutley for free! FREE version of indicator https://www.mql5.com/en/market/product/41465 We present you an indicator - Insider Scalper by LATAlab developed by the LATAlab team, that allows you to bring scalping trading to a whole new level of quality! With our strategy you can: Insider Scalper by LATAlab displays a hidden tick chart that is not available in the basic tools of the terminal. Automatically detects and draws strong level

It's an expert to use prices action and trade level to open each order. Expert can to trade up 12 pairs, uses the corresponding default setting for each pair.
Default settings are good for EURUSD pair and IC Markets broker.
Time Frame: H1
Parameters
PresetsParameters = Uses prosets parameters (12 pairs). Broker GMT Offset = Set broker different time from GMT time. Time Frame Use = Time frame of chart to run expert. Type Of Signals = Mode of signals. Time Set Levels = Time set levels to tr
FREE

Hi Trade EA is an EA facilitating hand trading. Hi Trader EA is a trading assistant EA, not an automatic order placing EA. You can download the EA to test with a demo account from my Profile page. If you enable both types of Trailing Stop, the Stop Loss must be greater than 0.
Features of EAs Fix lot or Money mangement .Calculate Lot from Risk and Stop loss. TS = Trailing stop with separate stop loss, individual orders. AVR TS = Trailing stop with combined stop loss, individual orders, based o

Close all open orders, delete all pending orders, and clear the entire account's orders. Please use caution! After clicking the button, the account order will be 0! Help us quickly clear account orders! As it is a free version, only the function of closing all orders is available. If other functions are needed, customization is required! The paid version has more features!
FREE

SR is a support and resistance indicator, it shows major highs and lows by different colors. The color of a level is changing if the last high or low are touching it. After the closing of a bar above or below level, it will delete it. extern inputs: loop for candles / colors / drawing time *This indicator signal is not perfect and have to be used with other market analysis and confirmations.
FREE

Description:
This indicator (with its algorithm) marks relative highs and lows, which have an array of useful applications.
This indicator will never repaint.
Features:
Marks relative highs and lows Use this to determine points of trend continuation i.e. where the trend may pull back before continuing higher or lower, past this point Or use this to determine potential points of reversal, particularly in ranging markets, or with other price action These highs and lows can sometimes
FREE
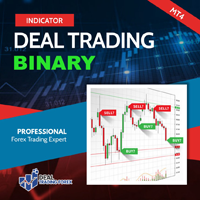
. Simple Trading System Update !!! Follow this link to see our 2023 Strategy !!! (See results and download the auto trade tool)
Description Binary Deal Trading Indicator is an indicator on MT4 for Binary Option Trading. It forecasts the overbought / oversold level, Reversal and Fractal point. This indicator will help you to decide a reversal price on any time frame (Recommend M1, M5 and M15). The expiry time is 5-15 minutes after receive signal. Features High w in rate Non-repaint signal

Relative Volume or RVOL is an indicator that averages the volume of X amount of days, making it easy to compare sessions volumes.
The histogram only has 3 colors:
Green - Above average volume
Yellow - Average volume
Red - Below average volume
The default setting is 20 days, which corresponds more or less to a month of trading.
With the data obtained from this indicator you can better gauge the commitment behind a move. For example, you will be better equipped to judge if a bre
FREE
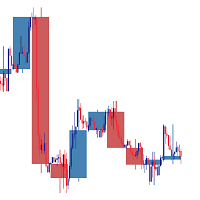
This is a Free Trial work on EURUSD. Discover the incredible potential of "Higher Timeframe Bars," your go-to MetaTrader 4 indicator for enriched trading insights. Revolutionize your trading strategy with a deeper understanding of the markets, all while staying on your current chart.
Key Features: - Seamlessly compatible with MetaTrader 4. - Choose from an array of higher timeframes, including M3, M5, M10, H1, H4, D1, and more. - Customize bar colors and enable optional borders for enhanced v
FREE
Loop Pattern EA is an automatic long term strategy trader. Minimum trading account 10,000. Best performance on GBPUSD 1h. This EA calculates amount of candles back controllable by the user and applies certain function:
if (calculate_Green_Body()>calculate_Red_Body() && calculate_Green_High()<calculate_Red_Low() && newcandle()) { buy(); } ... There are no stoploss or takeprofit and the trades closes then the opposite signal arrives. this EA operates only once per ba
FREE

EMA Separation Coefficient reflects the separation between short-term and long-term exponential moving average trend resistance, as well as the direction of the current movement. Pay attention to potential crossover points when the coefficient approaches zero, this may indicate an upcoming breakout or reversal. Wait for confirmation of the trend before entering the trade, and exit when the coefficient forms a max (for calls) or a min (for puts). This is a small tool to help visualize the differe
FREE

The trading strategy bases on MACD signal and confluence of trends on multiple time frames. It supports martingale, smart trade and many options so that you can setup their own trading strategy from the basic one. Look for new idea, improve trading performance by yourself without limitation.
Outstanding Features Martingale trading : turn on/off martingale strategy. When you find out a parameter set which has a small value of maximum continuous loss, you can consider to turn on martingale mode
FREE

Free TrendLine EA opens trades whenever the price on the chart interacts with or crosses your trend line. You simply draw the trend line manually then let the EA do the trading automatically according to the rules you give it. The settings available in the EA are explained below: Lots : The lot size for trading. RiskPercentage : Set a value other than zero to activate lot sizing by use of percentage of margin. TrendLineName: The name of the line to track. You can either * rename the trend line t
FREE

Liquidity Pro The Liquidity Pro pin points liquidity zones in any financial instrument, including currency pairs, cryptocurrencies, commodities, equities and indices. The Liquidity Pro shows previous and current liquidity zones, down to the present minute, providing essential information about your chosen trading pair, when conducting chart analysis or initiating trades. Remember each trading pair requires a different price separation value for M5, M15 and M30 Tally, to provide accurate data. Y
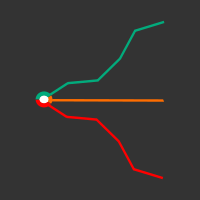
The Spread Ratio indicator allows you to view the ratio between the value of one instrument and another in order to operate with spread trading techniques.
In the image we can see an example of the Spread Ratio indicator on the Brent Oil and Crude Oil instruments. As we see from the image, the Spread Ratio indicator shows the trend of the ratio between these two instruments, allowing us to grasp the misalignments and realignments of the prices.
It is also possible to combine the Spread Rati

Synchronize objects from one chart to multiple charts. Synchronize objects from one chart to multiple charts. 1. Allows automatic synchronization of new and edited objects to other charts. 2. Allows synchronization of all objects on the chart to other charts at the current time. 3. Allows setting the charts to synchronize based on the position of the chart in the MT4 window. Version 1.2: Allow set list of object names that you don't want to sync (Separated by commas ",")
Allow set 5 types of
FREE

This indicator scans for you up to 30 trading instruments and up to 8 timeframes for occurrences of the high probability reversal patterns: Double Tops/Bottoms with fake breakouts . Please read also the blog post " Professional Trading With Double Tops/Bottoms And Divergences! " which explains the concepts behind the ULTIMATE Double Top/Bottom indicator and how you can use a professional top-down approach. This FREE Version of the Scanner scans only EURUSD and GBPUSD. The full version of the sca
FREE
A free program for copying orders between terminals on the same computer.
Any orders are copied in any direction, between any accounts.
The principle of operation:
On the terminal from which you want to copy, the "Server" parameter is set. On the terminal or terminals where the copied positions need to be opened, the "Client" parameter is set. It is also necessary to enter the account number of the "Server" terminal on the client.
In the future, it is planned to increase the functiona
FREE

Dragonfly is an expert Advisor for real professionals. It is the quintessence of rational and technical analysis. The expert Advisor can be used both for dispersing small deposits and for conservative work.
Main:
"TakeProfit" - Number of points to close a trade with a profit
"StopLoss" - Number of points To close a trade with a loss
"Slippage" - Slippage
"Magic" - adviser ID
"Lot"- the amount of the transaction
Dynamic lot settings:
"Dynamic" - enables/disables dynamic calculati
FREE

CoverPro Hedge es un asesor experto que se especializa en el control del riesgo a través de estrategias de cobertura y rebalanceo en el mercado financiero. Con un enfoque innovador y una meticulosa atención al detalle, CoverPro Hedge utiliza un sistema avanzado de coberturas y rebalanceos para proteger contra caídas repentinas en el mercado. Su objetivo principal es proporcionar a los inversores una protección sólida y constante, minimizando las pérdidas durante períodos de volatilidad extrema.

The M.O.D.E stands for " Multiple Oscillator Divergence Exit ". It is an indicator which signals a divergence between the price, and multiple oscillators. It is initially an exit indicator because it signals the weakening of a trend, but it could be used as an entry signal if used analytically Key Features: Check many divergences at once Non repainting Sends Alerts and Push Notifications You could load the M.O.D.E onto a single chart, and be able to see the divergences happening on multiple os
FREE

Ultimate MTF Support & Resistance - 5 Star Best Seller Beginner or Professional our best selling multi-timeframe Pivot Prof will enhance your trading and bring you great trade opportunities with the Support and Resistance levels that professionals use. Pivot trading is a simple effective method for entering and exiting the market at key levels and has been used by professionals for decades and works on all symbols: Forex, Crypto, Stocks, Indicies etc. Pivot Prof brings premium levels to the trad

This scanner shows the trend values of the well known indicator Parabolic SAR for up to 30 instruments and 8 time frames. You can get alerts via MT4, Email and Push-Notification as soon as the direction of the trend changes.
Important Information How you can maximize the potential of the scanner, please read here: www.mql5.com/en/blogs/post/718074
You have many possibilities to use the scanner. Here are two examples: With this scanner you can trade a top-down approach easily. If two higher t

Please check the " What's new " tab regularly for a complete and up-to-date list of all improvements + parameters. FREE indicator for my trading utility Take a Break . This indicator allows you to manage multiple other EAs with just one Take a Break EA instance. Simply specify the corresponding Chart Group in the indicator(s) and Take a Break EA settings and you are good to go.
Setup examples (Indicator + EA)
As a prerequisite, add the URL https://trading.custom-solutions.it to the list of
FREE

Limited time offer for $59. Launch promotion Price will go up soon. NO MARTINGALE!!! LOW DD!!!
GOLD CHAMPIONS is a new EA designed through a new AI system that operates in the Forex market and is designed GOLD/XAUUSD with excellent results. Developed by a team of experienced traders with more than 10 years of trading experience.
It uses a powerful algorithm to detect fluctuations in the market and make entries with a high profit ratio and limiting losses. Key Features: Integrated Str

A reversed engineered and improved version of the extremely popular AFSID scalper ( afs-id.com ). Includes re-modeled versions of these 2 well received scalping programs: " AF-Fibo ", and " AF-TrendKiller". Take note that this is a high risk scalper Though improvements have been made to mitigate some of the risks, the risks inherent to martingale scalpers still exists, so use it at your own risk.
afsida Scalper (improved AFSID)
This is a simple martingale scalper which works on any pair
FREE

Trade Controller provides multiple methods to protect and maximize your profits. This powerful weapon helps you to set the protect and trailing-stop rules on your trade automatically in many effective methods. Once it is set and turned on, you don't need to monitor your orders anymore, the software will keep watching and control your orders with your predefined rules. It's designed to support multi-protection and trailing strategy: Protect by break-even, protect by percentage, protect by pip, pr

このプロジェクトが好きなら、5つ星レビューを残してください。 インスタグラムでフォロー:borelatech 大規模なボリュームを取引するには、複数の楽器/チャートを調べる必要があります
新しい機会を見つける, このインジケータは、特定の特定のプロットによってあなたを助ける
数またはそのサフィックスの複数のレベルによって、それらを自動的に更新します
価格が変更されると、そうでなければ退屈なタスク。 例えば、GBPUSDでは、インジケーターの4つのインスタンスを
チャートをプロットする: 線長100バーの各0.01間隔。 線の長さ25バーの0.0075間隔で終わる各価格。 線長50バーの0.0050間隔で終わる各価格。 25バーの線長で0.0025間隔で終わる各価格。 このようにして、定規に似ているので、この例が非常に見られます。
スクリーンショット。 また、色やラインのスタイルを異なるスタイルで設定できます。
レベルを視覚化しやすいようにします。
FREE
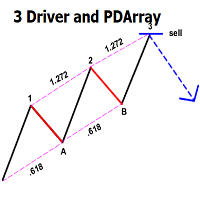
This indicator automatically identifies the SMC 3-Drive pattern and sends notifications to users when the pattern is detected. Additionally, the indicator identifies PDArray (including FVG and OB) and offers an option to combine the 3-Drive pattern with PDArray. This combination provides users with more reliable signals. What is the 3-Drive Pattern? This pattern is formed by three price pushes in one direction, providing a strong reversal signal (Figure 3). The key to identifying this pattern is
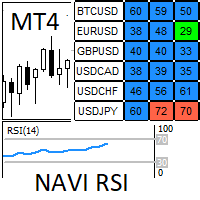
Navi RSI(ナビRSI): 各シンボルとそれぞれの時間枠で、Relative Strength Indexのオーバーバイトまたはオーバーセルのシグナルを探します。 私たちはグラフを非常に快適にナビゲーションし、多くの時間を節約します。 視覚的なシグナルとアラートは、RSIがこのオーバーバイトとオーバーセルの領域にあるときに発生します。 視覚的なシグナルとアラートは、シンボルとタイムフレームの両方で独立して発生し、私たちが不在のときに携帯電話のアラートを管理するのに非常に便利です。 入力パラメータ: 1)スケール&ポジション: 1.1)角を選択する- パネルを配置する画面の角。 1.2)位置X- 角からのX距離。 1.3)位置Y- 角からのY距離。 1.4)列の幅- 列の幅。 1.5)行の高さ- 行の高さ。 1.6)フォントサイズ- テキストのサイズ。 2)スキャン時間: 2.1)モード(onTick / onTime)- 新しいtickごとにデータを更新するか、時間サイクルごとに更新するか。 2.2)onTimeでの更新(秒)- モードがonTimeの場合、データを更新するため
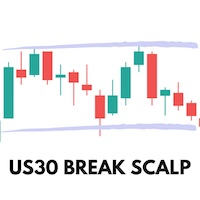
This Expert Advisor trades based on a specific range breakout within a specific hour using scalp techniques. It does not use dangerous techniques like martingale. It only opens a maximum of 3 trades per day (default settings). The default settings are optimized for IcMarkets, FTMO and MFF (set file in the comments) although it can be used with other brokers, you just need to confirm the hours input. Despite this Expert Advisor presents good results in backtesting and for this month (January 2023

An expert based on the Accelerator indicator.
Without any additional filters
Interesting and useful result
Can be used in all currency pairs and all time frames
Can be used in all markets
completely free
Fast and simple
With the support of the author
Settings: Signal: These settings are related to the "Accelerator" Indicator. When that indicator reaches this value, the expert trades. Meta Trader Alarm: If you want to receive an alarm through Metatrader after each trade, enable this sett
FREE

Easy Virtual Traderのセットアップ>ルールの入力>モバイル、別のEA、またはどこからでも取引する準備ができました。...ロボットが取引を管理できるようにします。
この強力なEAは、事前設定のルールと設定に基づいて、すべてまたは特定の取引を自動的に管理するのに役立ちます
セットアップして実行すると、注文を監視する必要がなくなります。ソフトウェアは定義済みのルールで注文を監視および制御します
デスクトップMT4またはモバイルアプリケーションから取引するか、別のEAの取引を管理できます。
マルチプロテクションとトレーリング戦略をサポートするように設計されています。損益分岐点による保護、パーセンテージによる保護、ピップによる保護、アカウント値による保護、距離によるトレーリング、インジケーターによるトレーリングなど。
Easy Virtual Traderは、自動バージョンの多くのリクエストにより、すでに人気のあるEasy Tradeマネージャーを拡張したものです: https://www.mql5.com/en/marke
The Ultimate Dashboard Indicators are useful for traders, but when you put them into a dashboard that can scan 28 symbols at once they become even better, and when you can also combine different indicators and timeframes to give you synchronized alerts, then they become awesome. This easy to use dashboard provides you with 23 leading indicators, use them individually or together, to create powerful combination alerts. So when you want to know that RSI is above 25 and the price is above the movin

The Once Per Day EA is a powerful and intelligent trading system designed for the EURUSD pair on a 5-minute time frame. This EA boasts an impressive array of 30 different entry strategies , each meticulously chosen based on historical statistics to match the current market conditions. This dynamic approach ensures that the EA can adapt and overcome market fluctuations, allowing it to achieve remarkable consistency. Backtested over a period of more than 7 years, the Once Per Day EA has demonstrat

The indicator defines the Bullish and Bearish Engulfing Bar. The pattern has greater reliability when the open price of the engulfing candle is well above the close of the first candle, and when the close of the engulfing candle is well below the open of the first candle. For an engulfing bar to be valid it must fully engulf at least one previous bar or candle - includes all the body and the wick. The engulfing bar can engulf more than one bar as long as it completely engulfs the previous bar.
FREE

Genaral: Not martingale, not a grid; Use on EURUSD Use on M5
Signals: There is a good rational algorithm. Work of two indicators: Chaikin and DeMarker (from 2 timeframes) (you can set a separate Timeframe for each indicator)
Stop Loss/Take Profit: There is a good money management system (there are several type for trailing stop loss); There is virtual levels of Stop Loss / Take Profit; There is smart lot (percent by risk) or fix lot
Important: EA can work on closed candles, and on cur
FREE
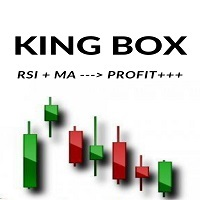
My exclusive product. Follow RSI and MA. Automated trading bot with capital from $ 1000. You should run the main currency pairs and the minor pairs like EU, GU, AU, EJ, EC .... The martingale + Grid strategy will be very risky, but very profitable.
The main parameters can be installed: Lot - Startot . Fixlot - 0.01_02_03_04 \ or\ 0.01_02_03_05_08 Auto-BUY-SELL - allows to buy or sell. Auto-Grid - ON/OFF AutoLot - ON/OFF TP - Takeprofit -pips. SL - No Stoploss. Use tralling = ON/O
FREE

これは無料でご利用いただける製品です。お客様のニーズに合わせてご利用ください。
また、肯定的なフィードバックをいただき、大変ありがたく思っています。どうもありがとうございます。
// より優れたエキスパートアドバイザーとインジケーターは、こちらで入手できます: https://www.mql5.com/en/users/def1380/seller
MT4 用外国為替インジケーター スプレッド表示、トレーディング サポート。
スプレッド表示インジケーターは、それが接続されている外国為替ペアの現在のスプレッドを表示します。 スプレッド表示値は、チャートのどのコーナーにも配置できます: 0 - 左上コーナー、1 - 右上、2 - 左下、3 - 右下 色とフォント サイズも設定できます。 これは、この MQL5 Web サイトでのみ提供されるオリジナル製品です。
FREE

ソフトウェアの説明 このインジケーターは、さまざまな時間枠と設定で 1 つまたは 2 つの MACD インジケーターを表示できます。 計算にEMAを使用する無料バージョンがあります。 この Pro バージョンでは、計算に 4 つの移動平均タイプ (単純、指数、平滑化、線形加重) をすべて使用します。 アクティブなインジケーターは、ポップアップ、サウンド、プッシュ、または電子メールで警告を発することができます。 無料バージョンのアラートはゼロレベルクロスのみですが、このプロバージョンのアラートは、ユーザーがオプションを選択した場合、ゼロレベルクロスまたはヒストグラムシグナルラインクロスに設定できます。 それぞれの時間枠と期間が異なる場合でも、アクティブなインジケーターの一方または両方にアラートを設定できます。 2 つの MACD インジケーターを使用している場合、アラートはそれぞれで個別に機能します。
メインチャートにはボタンを備えた表示パネルがあり、アクティブなインジケーターとその設定が表示されます。 このパネルを非表示にするオプションがあります。 ボタンを一時的に使用すると、ア

Monster Harmonics Indicator is a harmonic pattern indicator. It recognizes Gartley, Bat, Crab, Butterfly, Cypher, White Swan, Black Swan, Shark and several other patterns. Projected patterns that are not yet completed are recognized, too. Monster even shows the PRZ (Potential Reversal Zone). Users can add their own user defined patterns to Monster. Besides the current pattern, Monster also shows all patterns in the symbols history. Monster will provide alerts for developing patterns. Introduced

SonicTradeCopier: (Best for scalping)
Easy Fast Reliable trade copier. Copy trades from one terminal to an other (internet copy feature coming soon.)
MT4 to MT4. MT4 to MT5. MT5 to MT5. MT5 to MT4. MT4/MT5 to any other platform copy possibility for custom made solutions. Reverse trading. Advance filters for traders.
Features:
(Setting up copying policies) Sender only has to setup signal name and start sending signals [ You must start signal sender first always ]. Receiver sets up s

Th3Eng Panda trend is a powerful indicator that works perfectly for scalping trades as well as swing trades. Th3Eng Panda trend is not just an indicator, but a very good trend filter. You can setup it on H4/H1 to Find the main trend and start scalping on M5/m15/m30 Time Frames. Works with all pairs and all Time Frames.
Inputs:
Section #1 History : Maximum number or bars to draw the last signals. (Default 5000) Draw Candles : Draw red candle when sell signal and green when buy signal. (tr
FREE

forex のトレードで広く使われるRSIをベースにロジックをデザインしました。
通常、RSIの値が買われすぐ、売られすぎのエントリーは有名ですが、トレンドが逆行した場合は、あまり効果的ではありません。
そこでその対策として、このEAは、RSIの値を元にエントリーしたあと、逆方向にマーケットが動いた場合、順張りのエントリーを行います。いわゆるグリッドオーダーですが、一定間隔ごとではなく、一定間隔ごとに、RSIの値が売られすぎの場合は、SELL売りの追加オーダーがでます。また逆に買われ過ぎの場合は、トレンドに沿ってBUY買いのオーダーがでます。
RSIの値に基づいたメインオーダーと、順張りのグリッドオーダーを持ちながらトレードを行い、それらすべてのオーダーがバスケットクローズされます。
バスケットクローズされる利益は0.01ロットが$1を基準に
トータルロットサイズから平均利益を自動計算しています。
また、ストップロスは低めの20PIPSに設定していますが、もしストップロスでオーダーがクローズした場合、次のロットを上げてトレードするいわゆるマーチンゲールの機能も備えています。
FREE
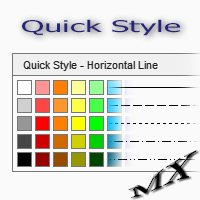
The Quick Style utility is designed for facilitation and acceleration of working with the properties of graphical objects. Left-click a graphical object while holding the Shift key to open the quick access window for configuring the object properties. In the window, you can change the color, style and line width with one click, including those of other graphical objects. All changes are displayed immediately. To close the Quick Style , simply click the free space on the chart. The utility is eas
FREE

Indicator overview Trend indicator usage Moving averages. Highest quality alerts that need no introduction. It is completely loyal to the original algorithm and uses other useful features.
Easy to trade Carry out all kinds of notifications It's not a new paint and it's not a back paint. Setting Indicator EMA50 in Time frame H1 for any pair currency and Gold Spot. EMA200 in Time frame H1 for any pair currency and more than EMA250 for Gold spot. Using it for maximum benefit Set up notificatio
FREE

RSI Signal Scanner The primary trend of the stock or asset is an important tool in making sure the indicator's readings are properly understood. For example, some of the technical analysts, have promoted the idea that an oversold reading on the RSI in an uptrend is likely much higher than 30%, and an overbought reading on the RSI during a downtrend is much lower than the 70% level. This indicator notifies you of RSI important levels breakouts (30% and 70%) by searching among the symbols and chec
FREE

This indicator is an addition to "Trend Edges."
The "Trend Edges histogram" indicator determines whether the trend is rising or falling. It is suitable for any time frame (tested on DAX).
Find a trending pair, index or CFD. Additionally :
-Sound alert on trend change.
-Alert Notification
-Alert Notification on your mobile phone Check my other indicators.
FREE

There are time periods in the market, when trading is highly likely to be unprofitable. This indicator warns you about such non-trading situations and helps you preserve your money and time.
Parameters Remind about non-trading periods: Expiration week - remind about the expiration week Consumer index day - remind a day before the release of Consumer index day NON FARM - remind a day before the release of NON FARM Christmas - remind a day before Christmas New Year Days 25.12 - 15.01 - remind ab
FREE
FREE

Market Cycles は、ニューラルネットワークを使用して現在の市場フェーズを決定する独自の独自の指標です。
トレーニングでは、ニューラルネットワークは循環(反転)パターンを使用します。
通貨市場は弱気から強気の期間に循環し、再び戻る傾向があります。
この製品では、4つの時間枠(M5、M15、M30、H1)のパターンを組み合わせて、信号の精度を大幅に向上させました。
Market Cycles は、EURUSD通貨ペア、M30タイムフレームで使用する必要があります。
インジケーターの利点 このユニークな開発には、市場に類似物はありません。 低価格。 開発者からの永続的な技術サポート。 インジケーターには設定がなく、構成する必要はありません。 便利な信号通知システム:アラートとプッシュ。 収益性の高い取引の割合が高い。たとえば、過去1年間の通貨ペアEURUSDの場合、トランザクションの81%が利益を伴ってクローズされました。
私たちの製品をインストールするだけで、それが不可欠であることがわかります!
重要!!! Market Cycles インジケ

McS Super Trend -This is one of the most popular classic trend indicators. It has a simple setting, allows you to work not only with the trend, but also displays the stop loss level, which is calculated by this indicator. Benefits:
Instruments: Currency pairs , stocks, commodities, indices, cryptocurrencies. Timeframe: М15 and higher. Trading time: Around the clock. Shows the direction of the current trend. Calculates the stop loss. It can be used when working with trading. Three types of no
FREE

I recommend you to read the product's blog (manual) from start to end so that it is clear from the beginning what the indicactor offers. This multi time frame and multi symbol indicator identifies double or triple top/bottom formations or a following neckline breakout (confirmed top/bottom). It offers filters for RSI overbought/oversold, candle patterns (pin bar, engulfing, tweezer, morning/evening star, three line strike) and divergences (MACD, OsMA, Awesome (AO), RSI, CCI, Stochastic) whic

Rental/Lifetime Package Options and Privileges' * For optimum results the yearly or lifetime package is suggested due to live training and Discord channel trading with the creator! Rent Monthly Six Months Yearly/Lifetime Weis Wave with Speed with Alert+Speed Index x x x Manual x x x Quick Set up Video x x x Blog x x x Lifetime Updates x x x Setup and Training Material
x x Free Rectangle Break Alert Tool x Discord Access Channel "The SI traders"
x 2-hour live methodology traini

The Hull Moving Average (HMA), developed by Alan Hull from 2005, one of the most fast-moving Average, reduce lag and easy to use to identify Trend for both Short & Long term. This Indicator is built based on exact formula of Hull Moving Average with 3 phases of calculation: Calculate Weighted Moving Average (WMA_01) with period n/2 & (WMA_02) with period n Calculate RAW-HMA: RAW-HMA = 2 * WMA_01(n/2) - WMA_02(n)
Weighted Moving Average with period sqrt(n) of RAW HMA HMA = WMA (RAW-HMA, sqrt(n
FREE

MACD Divergence Scanner is a multi-timeframe and multi-symbol dashboard and alert that checks all timeframes and symbols to find regular and hidden divergences between price chart and MACD indicator. This divergence scanner is integrated with support and resistance zones so you can check the MACD divergences in the most important areas of the chart to find trend reversals in the price chart. Download demo version (works on M 1,M5,M30,W1 timeframes) Full description of scanner parameters ->

The purpose of this new version of the MT4 standard indicator provided in your platform is to display in a sub-window multiple timeframes of the same indicator. See the example shown in the picture below. But the display isn’t like a simple MTF indicator. This is the real display of the indicator on its timeframe. Here's the options available in the FFx indicator: Select the timeframes to be displayed (M1 to Monthly) Define the width (number of bars) for each timeframe box Alert pop up/sound/ema
FREE

This is a utility to allow you to quickly add and remove Elliot Wave numbers and letters to your charts allowing you to plot the main and sub Elliot waves for easy chart analysis. Please note, this is not an Indicator that adds the characters automatically, it is a utility to manually add them yourself with ease.
Elliot Characters and Buttons on screen: 0,1,2,3,4,5 A,B,C i,ii,iii,iv,v a,b,c Delete Input Parameters: Colors Font Size Font Type This is a free utility for MT4 only Check out
FREE
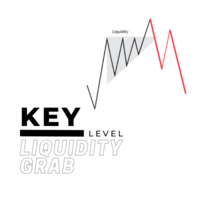
For a bullish move to occur for example, there should be alot of buying power. but you cannot buy if there is no sell on the other side, so the big players usually tend to manipulate the market in order to create available positions on the other side and be able to open their positions and one of the ways is by creating a fake breakout/ a liquidity grab. Before majority of big reversal moves and trends are formed, a liquidty grab would have occured in order to have enough orders to push for the
If you need an advisor on any arrow indicator signals - this utility will definitely help you.
What does the utility do?
It creates a EA file with your indicator signals in a few easy steps: install the indicator with the needed settings on the chart; Select a signal for buy; Select a signal for sell; get the clicker file ! Then you install the file of the EA in the folder Experts and update the terminal. Attention! Set the indicator settings as you need and the same settings will be t
FREE

Rainbow MT4 is a technical indicator based on Moving average with period 34 and very easy to use. When price crosses above MA and MA changes color to green, it’s a signal to buy. When price crosses below MA and MA changes color to red, it’s a signal to sell. The Expert advisor ( Rainbow EA MT4) based on Rainbow MT4 indicator, as you can see in the short video below is now available here .
FREE

We Trade Live Trend Candle Stick can help identify potential trend in the market when trading, spot market trends and predict future prices. We Trade Live Trend Candle Stick has a smoother look, as it is essentially taking an average of the movement. candles will stay RED during a downtrend and Green during an uptrend . We believe It's useful for making candlestick charts more readable and trends easier to analyse. As a breakout trader you are looking for trades that are ‘breaking out’ of
FREE

MT5 Version - ( Click here ) Lamar Gray: Forex Swing Trading Robot Lamar Gray - your reliable partner in the world of forex trading. This trading robot specializes in swing trading strategy on currency pairs, offering a dependable and efficient solution for your portfolio. Features: Swing Trading Strategy: Lamar Gray is based on a swing trading strategy, allowing it to make confident decisions based on long-term market trends and patterns. Emergency Mode: In case of unforeseen circumstances o
FREE
Counterattack EA is a fully automatic Grid Expert Advisor for Trend Scalping Trading on XAUUSD timeframe M1 but also in others.
Recommendations The Expert is programmed to work on XAUUSD M1, but you can use all others timeframes also. An ECN broker is always recommended A low latency VPS is always recommended. The recommended Leverage is 1:100 or more. The recommended capital is 10000 ($/cent) per 0.01 Lots or more. For higher Lots please test by yourself Please test Demo before you
FREE

If you trade or wish to trade the popular HLHB Trend-Catcher System, then this indicator is for you! It detects when the HLHB system entry rules are met and sends out an alert in the form of notifications to your mobile phone and to your pc. By automatically sending you notifications, this indicator lessens your trading work load as you don't have to sit in from of your pc all day checking all the chats for when the entry rules are met. This indicator does all the dirty work for you. When the si
FREE
A personal implementation of a famous trend principle known as higher high, higher close, lower low, lower close (HHHC - HHHL). It uses price action alone to determine trend direction, trend changes and pullback zones. [ Installation Guide | Update Guide | Troubleshooting | FAQ | All Products ] Customizable breakout period Customizable colors and sizes It is non-repainting and non-backpainting It implements alerts of all kinds The indicator defines three price zones: Buy zones are blue Sell zon
FREE

Free RSI expert advisor is a completely free expert advisor that trades using rsi level crosses. You can set which levels the Ea should use to open and close trades. The various settings are explained below. NOTE: The default settings are just place holders and not necessarily the best. Use the settings that best suites you or your strategy. Lots - This is the lot size of the EAs trades. 0.1 is the default setting. AllowBuy - Set to true to allow buy trades. This setting is true by default. Allo
FREE

The principle of this indicator is very simple: detecting the candlestick pattern in H1 timeframe, then monitoring the return point of graph by using the pullback of High-Low of H1 Candlestick and finally predicting BUY and SELL signal with arrows, alerts and notifications. The parameters are fixed and automatically calculated on each time frame. Example:
If you install indicator on XAUUSD, timeframe H1: the indicator will detect the reversal, pullback, price action on this timeframe (for exa
FREE

O Touch VWAP é um indicador que permite calcular uma Média Ponderada por Volume (VWAP) apenas apertando a tecla 'w' no seu teclado e após clicando no candle do qual deseja realizar o calculo, clicando abaixo do candle é calculada a VWAP baseado na minima dos preços com o volume, clicando sobre o corpo do candle é calculado uma VWAP sobre o preço medio com o volume e clicando acima do candle é calculado uma VWAP baseado na máxima dos preços com o volume, voce tambem tem a opção de remover a VWAP
FREE
MetaTraderマーケットは、開発者がトレーディングアプリを販売するシンプルで便利なサイトです。
プロダクトを投稿するのをお手伝いし、マーケットのためにプロダクト記載を準備する方法を説明します。マーケットのすべてのアプリは暗号化によって守られ、購入者のコンピュータでしか動作しません。違法なコピーは不可能です。
取引の機会を逃しています。
- 無料取引アプリ
- 8千を超えるシグナルをコピー
- 金融ニュースで金融マーケットを探索
新規登録
ログイン