MetaTrader 4용 Expert Advisor 및 지표 - 45

MACD is well known indicator that still can be use for prediction where price will go next few minutes, hours or even weekly With colored bar of Macd, your eyes can easily catch when color is changed based what market price movement to find any early trend on market. here is the parameter of the indicator: TF_MACD , default is 1 Hour , this mean you can see clearly MACD of 1 Hour TimeFrame on Lower TimeFrame. InpPrice , default is Price Close , this is original MACD parameter from Metaquotes st
FREE

Reward Multiplier is a semi-automatic trade manager based on pyramid trading that opens additional orders with the running profit of your trades to maximize return exponentially without increasing the risk. Unlike other similar EAs, this tool shows potential profit/loss and reward to risk ratio before even entering the first trade! Download full version here ( In the mini version. Starting lot is fixed at 0.01 (or minimum allowed lot size ) Guide + tips here MT5 version here You only open the
FREE
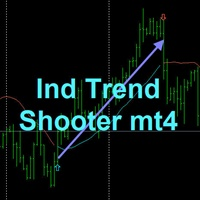
TREND SHOOTER Without alerts
It is a trend indicator based on moving averages that very efficiently calculates changes in market direction.
This has the ability to anticipate changes of direction very early.
FEATURES
This indicator particularly draws two moving averages that are used only to show color changes. they can wear these moving stockings as they wish as they do not affect the color change behavior bullish blue color
bearish red color where the line is interrupted it is not reco
FREE

Medium-term trading system that tries to profit during the price rollbacks after significant movements. The system automatically determines the current trading range, the price rollback levels. This is a demonstration version of the Algorithmic EA, which is optimized over the year 2016 for trading the EURUSD currency pair. It is possible to trade in manual mode using a simple on-screen panel or in fully automatic mode. Amount of trades per month is from 5 to 18 in automatic mode. The recommended
FREE

The Multi-Timeframe High Low Points (MTF High Low Points) indicator is a powerful tool for traders using MetaTrader 4 (MT4) to analyze price movements across different timeframes. This versatile indicator helps traders identify significant support and resistance levels by displaying the highest and lowest price points within a specified number of bars on multiple timeframes simultaneously. Key Features: Multi-Timeframe Analysis: MTF High Low Points allows traders to monitor high and low price le
FREE

Gold BB FREE is Expert Advisor for XAUUSD based on Bollinger Bands . You can edit all strategy parameters as BB open period, TakeProfit, StopLoss or TrailingStop. Default paramters are optimized for best results. But you can test other settings for antoher currency pairs. This EA use three BB with different open periods and close price. Gold BB FREE has been tested from year 2006 to 2021 . My test used the real tick data with 99,90% accuracy. Doesn't use Martingale or other dangerous strategie
FREE

이 프로젝트를 좋아한다면 5 스타 리뷰를 남겨주세요. 큰 볼륨을 거래하려면 여러 악기 / 차트를 볼 필요가 있습니다.
새로운 기회를 찾을 수 있습니다, 이 지표는 특정을 플로팅함으로써 당신을 도울 것입니다
숫자 또는 그 suffix의 다수에 의하여 수준은 그(것)들을 자동적으로 새롭게 합니다
가격 변경으로, 그렇지 않으면 심각한 작업. 예를 들어, GBPUSD에 4개의 인스턴스가 있을 수 있습니다.
도표에 플롯: 100개의 막대기의 선 길이를 가진 각 0.01 간격. 25 막대기의 선 길이를 가진 0.0075 간격에서 끝나는 각 가격. 50 막대기의 선 길이를 가진 0.0050 간격에서 끝나는 각 가격. 25 막대기의 선 길이를 가진 0.0025 간격에서 끝나는 각 가격. 이 방법은 통치자와 유사하게 보일 것입니다, 당신은이 매우 예를 볼 수 있습니다
스크린 샷. 또한 다른 색상과 라인 스타일을 설정할 수 있습니다.
시각화 할 수있는 레벨을 쉽게 만듭니다.
FREE

APP System Signals는 금융 시장에서 활발히 거래하는 트레이더를 위해 설계된 정교한 지표입니다. 이 지표는 고급 기술 분석을 기반으로 정확한 매수 및 매도 신호를 제공하여 트레이더가 현명한 결정을 내릴 수 있도록 돕습니다. 이 지표는 지수 이동 평균 (EMA), 단순 이동 평균 (SMA) 및 기본적인 트렌드의 조합을 사용하여 신뢰할 수 있는 신호를 생성합니다. 매개 변수는 완전히 사용자 정의할 수 있어 트레이더가 자신의 거래 전략에 지표를 조정할 수 있습니다. 또한 이 지표는 사용하기 쉽고 친절하여 모든 경험 수준의 트레이더에게 필수적인 도구가 됩니다. 초보자든 경험 많은 트레이더든 APP System Signals를 통해 거래 성과를 향상시키고 시장에서 더 현명한 결정을 내릴 수 있습니다.
FREE

如果产品有任何问题或者您需要在此产品上添加功能,请联系我 Contact/message me if you encounter any issue using the product or need extra feature to add on the base version.
PA Touching Alert is a tool to free you from watching price to touch certain critical price level all day alone. With this tool, you can set two price levels: upper price and lower price, which should be greater than/ less than the current price respectively. Then once price touches the upper price or lower price, alert and/or notification would be sent
FREE

This indicator is a histogram showing the trend based on 3 different moving averages. When all averages are set in ascending order, the indicator is green, and when in descending order, it is red. If the averages do not show a trend, the color is yellow. Additionally, each average can have different settings, such as Mode MA and Price MA. You can also set an alert and receive notifications on your phone.
To enable the alert and push notification, you need to activate them first in the MT4 settin
FREE

This is an indicator detecting trend direction. It uses the popular Bill Williams Alligator. It shows market state on all timeframes on one chart. As is well known, traders gain the main profit on the Forex market trading by trend, and losses usually occur when the market is flat. So, in order to gain profit a trader should learn to detect trend market and direction of a current trend in a rapid manner. This indicator has been developed for this purpose. MTF Alligator helps to: Profitably trade
FREE

Circuit Expert Advisor. EA uses arbitrage system of entering both direction of the market. In addition EA has built in Filter Engine for triggering the trades. All trades covered by fixed Stop Loss & Take Profit. No Grid, No Martingale, Works with high spread. This EA operates only once per bar opening. Fast methods of strategy testing and optimization are valid. User can test / optimize by model: (control point) / (open prices only) developed, tested and optimized on " Vantag
FREE

Echo One:
The provided robot is a result of several Test of trading many many strategies,various indicators of forecasting,
To make the best decision for making profits in markets. By combining several strategies and algorithms in this robot, at changing each tick price, with the utmost precision and speed Real account has been opened where it will be possible to analyze the entire history, as well as constantly, in real time, monitor all current results:
https://www.mql5.com/en/signals/71523
FREE

X-axis lines prevail in grid manner, ruled by Average True Range. There’s an inevitable change in specific periods of time of this matter! The Average True Range (ATR) indicator is not directly based on volume; instead, measures volatility in price movements. This indicator original in its revealing customization, stretches, expand, shrink, and evolve with 4 timely choices of grid states! MATR means “multiplying average true range” in which grandeurs the grid pip-distant levels, seeming to g
FREE
In addition to the MA of the set period, the MAs of the two higher timeframes with the same period are displayed on the chart simultaneously (though in a simulated way). No matter which timeframe you switch to, it will display the MA for that timeframe as well as the MAs for the two higher timeframes. Additionally, it will show the 200 MA as well!
To display the MA for the higher timeframes on the current chart, you need to set the MA calculated using the Moving Average indicator. If you try to
FREE

A simple and effective trend indicator. It will be a good assistant when trading. A minimum of understandable settings. Put it on a chart and set it up Good to combine with other indicators. I will post another trend indicator soon. The combination of these two indicators gives good results. Works on all timeframes. Suitable for any couple. Experiment, adjust, observe. Filter by higher timeframes.
FREE

How it Works When the EA is active, it analyzes the chart based on the Execution Mode parameter. No existing positions on the chart: If the trend is bullish, the EA enters a buy trade. If bearish, it enters a sell trade. Existing positions with the last one in loss: The EA checks if the distance between the current market price and the order meets the minimum distance set by the user. It enters a trade based on the candle, calculates the lot size using the martingale method. EA Parameters Execut

This Utility is a tool to manage level of profits or losses for each order without using stop loss or take profit. The Utility applies virtual levels to close orders in profit or loss. You can use the robot to manage manually opened orders or manage orders opened by another EA.
You can to get the source code from here .
Parameters OrdersManage - orders to manage (all orders of all symbols or orders on the current chart). Stop Loss Pips - virtual stop loss level. Take Profit Pips - virtual take
FREE
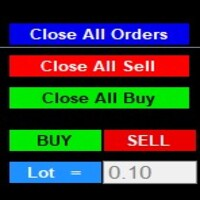
After purchase : - Please contact me at telegram https://t.me/SmartForex777 This Smart Dashboard Penal Very Easy , Fast And Accurate to Enter And Exit Trade Manually... Unique features Close All Orders... Close All Sell... Close All Buy... Buy / Sell... Lot Size Change Option... Works on any account type and broker... Works with all times frames and currency...
FREE

This version of the indicator works only in the tick data stream. In this way, we only see the current situation from the moment of launch. I recommend using the classic version Real-Time Currency Valuation . The indicator calculates currency strength of eight major and also can calculate strength of any other currency, metal or CFD.
Main Features It is able to display only the currencies that are currently necessary, thus not overloading you with unnecessary information and notifications. It
FREE
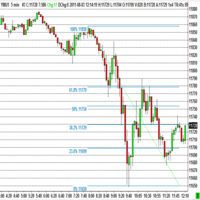
The program automatically draws fibonacci. This will save you a great deal of time in studying the chart. My intention is to facilitate those who carry out a study of the graph manually and use Fibonacci. In the screenshot you can see the result.The script applies to the chart of any currency pair or any stock. It will not open any purchase or sale operation because this program is limited only to drawing fibonacci.
FREE

In FX, signals from doji patterns can be effective in capturing potential trend developments. Therefore, setting pending orders simultaneously after the appearance of a doji can make it easier to capture the onset of a trend.
Setting stop-loss (SL) and take-profit (TP) levels more widely can enhance the probability of success, but it also increases the associated risk.
In the event of a loss, it is possible to recover by increasing the next position size through multi-lot trading, but this str
FREE
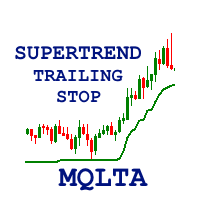
The Supertrend Trailing Stop will trail the Stop Loss price of your selected orders following the Supertrend Line, so you don't have to worry about having to change it manually. MQLTA Supertrend Trailing Stop requires you to install the FREE Indicator Supertrend Line https://www.mql5.com/en/market/product/25951
How does it work? The Expert Advisor sets and moves the Stop Loss price of the selected orders following the value of the Supertrend Line. You can filter the Orders by Symbol Comment Mag
FREE

I will support only my client. สำหรับลูกค้า Win Sniper Follow is a fully automated Expert Advisor with no use of martingale. Night scalping strategy. The RSI indicator and an ATR-based filter are used for entries. Real operation monitoring as well as my other products can be found here : https://www.mql5.com/en/users/winwifi/ General Recommendations The minimum deposit is 100 USD, the recommended timeframe is M15, H1, H4. Use a broker with good execution and with a spread of 2-5 points. A ver

Live Pivots Indicator Time Frame: Suitable for any time frame. but recommended time frame 30M and above. Purpose of this indicator: Trend Prediction. Buy: When the candle crossed above the golden pivot line its buy call, TP1-R1, TP2-R2, TP3-R3. SELL: When the candle crossed Below the golden pivot line its sell call, TP1-S1, TP2-S2, TP3-S3. Happy trade....
FREE
The professional utilities "Ichimoku Waves Meter" to analyse graphs using the correct interpretation of Ichimoku kinkōhyō!
Is a graphic program that allows traders to quickly and easily measure the proportions between the indicated points on the price graph. This time and price indicator is a basic tool for analysing the chart according to the Ichimoku strategy on the MT4 platform. Using this tool allows an insightful and complete analysis of time waves as well as price waves in a very short ti
FREE

️ Join our Telegram channel and get a powerful package of gifts that will make your trading even more successful: ️Our Telegram channel ️ t.me/EAQuantumLab
3 unique indicators - accurate market analysis in your hands.
Trading panel - convenient management of all trades.
Expert Advisor - your reliable assistant in automatic trading.
VIP-chat with signals - trade together with professionals and use proven signals. ️ And all this is absolutely free! Just su

Th indicator is a technical analysis tool that helps identify significant changes in price trends and filter out minor price fluctuations. It is used to highlight price swings and provide a clearer picture of market movements. The Pivots are found by checking if a certain candle is the highest/lowest in a given number of candles that come before and after it. This indicator has only one input, its period. The Higher the period, the more strict the indicator is about what constitutes a Pivot. Th
FREE

KF Trix V1.00 The triple exponential average (TRIX) indicator is an oscillator used to identify oversold and overbought markets and is also a momentum indicator. The triple smoothing of moving averages is designed to filter out price movements that are considered insignificant or unimportant. About Software details and MQL login link Copyright 2025, Forex KRAL "Contact support for assistance and Download ALL PRODUCTS FREE TRAIL VERSION"
FREE

Have you ever wondered which currency is the strongest at any particular time? Or which currency pair is trending the most. Well, the currency strength meter helps with just that. It compares USD , EUR , AUD , CHF , GBP , CAD and NZD depending on the timeline you have chosen in settings, and ranks them on the number of pips each has moved compared to the rest. N/B: All currency charts of the above pairs must have loaded. You can do this by highlighting all major and minor currencies
FREE

The Expert Advisor builds a grid of orders, defining inputs by built-in setups. After accumulating the profit specified in the settings, it closes the remaining orders to breakeven. Open “breakout” orders create a grid according to the trend, and each separately “trailing” order allows you to maximize profit from the market. Please see all my products: https://www.mql5.com/en/users/en_coding/seller
Benefits: a unique algorithm for constructing a grid of orders, eliminating the minimum delta be
FREE

An expert based on the Accelerator indicator.
Without any additional filters
Interesting and useful result
Can be used in all currency pairs and all time frames
Can be used in all markets
completely free
Fast and simple
With the support of the author
Settings: Signal: These settings are related to the "Accelerator" Indicator. When that indicator reaches this value, the expert trades. Meta Trader Alarm: If you want to receive an alarm through Metatrader after each trade, enable this setting. Ris
FREE

EA Quantum La – Trading advisor based on the RSI and Bollinger Bands indicators, using pending orders and virtual orders, supported by a neural network. ️ Join our Telegram channel and get a powerful package of gifts that will make your trading even more successful: ️Our Telegram channel ️ t.me/EAQuantumLab
3 unique indicators - accurate market analysis in your hands.
Trading panel - convenient management of all trades.
Expert Advisor - your reliable assistant in
The indicator gives signals to open/close a position and marks them on the price chart of the financial instrument. The signals differ in their potential, which allows you to decide on the amount of risk in each transaction. The principle of operation is to compare the current RSI value with the RSI value whose period is multiplied by the Cross_Factor value. The signal is confirmed when the price overcomes the maximum/minimum of the bar on which the indicator gave the signal. The open position i
FREE

Cracking Correlation ICT Indicator MT4 The Cracking Correlation Indicator is built to identify correlation shifts among three financial assets, such as DJI, ND100, and SP500. Typically, closely correlated instruments move in tandem, but occasionally, this correlation weakens or breaks. This ICT MetaTrader 4 indicator visually represents these correlation shifts using color-coded lines. «Indicator Installation & User Guide»
MT4 Indicator Installation | Cracking Correlation ICT Indicator MT5
FREE

This indicator allow you to measure Profit/Loss of current, closed or future trade in account currency and estimate margin level at the trade close point. Profit/Loss indicator is based on MT4 native Crosshair instrument and has following inputs: Trade Direction = Buy/Sell Lot size = 0.1 Font size = 8 Font color = DeepSkyBlue Offset horizontal Offset vertical
FREE

EA SCALPER GHOST PRO
This is single Entry type EA. It use smart alghoritme to detect market movement. It also use Stop loss and take profit . EA will not use any dangerous system like martingale, grid, averaging etc which can cause account blown in a second Tis EA use More than one pair to reduce risk. Right now im using 13 pair at the same time PROMO SALE PRICE Only $99 For first 10 copies!! 4 copies left Next Price will be ====>> $xxxx UP
RAMADHAN KAREEM PROMO ONLY $55 FOR LIFE TIME.. GRAB
FREE

+ 2 bonus strategies! Alerts! I recommend watching my advisor - Night Zen EA The indicator combines the most popular moving average strategies: Simple moving average crossover. Moving average crossover relative to the position of the slower moving average. 2 bonus strategies : The crossing of the fast moving average with the calculation of the opening prices of the slow moving average with the calculation of the closing prices taking into account the slower moving average. (The settings for th
FREE
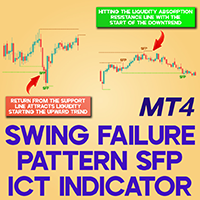
Swing Failure Pattern SFP ICT Indicator MT4 The Swing Failure Pattern (SFP) Indicator in ICT methodology occurs when the price momentarily breaches a critical support or resistance level but swiftly retraces and closes back within the range. This specialized tool for MetaTrader 4 highlights liquidity accumulation at these key points using green and orange lines , allowing traders to spot potential reversal zones effectively. «Indicator Installation & User Guide»
MT4 Indicator Installation | S
FREE

The FxSProMT indicator shows the current market trend and trend change.
Indicator Parameters Ind_Period - the number of previous bars used to calculate actual values. Number_Bars - the number of bars to display the indicator.. Too many bars may significantly slow down the operation of the trading terminal. Signal_Sound - sound alert to notify of trend change. The sound can be played multiple times until the signal is confirmed (the bar closes). Default is disabled. Signal_Alert - an alert to no
FREE

Multi timeframe fractal indicator which shows the higher timeframe's fractal point on lower timeframes.
Parameters Fractal_Timeframe : You can set the higher timeframes for fractals. Maxbar : You can set the maximum number of candles for the calculations. Up_Fractal_Color, Up_Fractal_Symbol, Down_Fractal_Color, Down_Fractal_Symbol : Color and style settings of the fractal points. Extend_Line : Draws a horizontal line from the previous fractal point until a candle closes it over or a user-specif
FREE
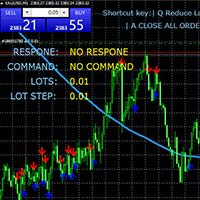
MT4 키보드 거래 플러그인 상세 설명 소개 : 이 MT4(MetaTrader 4) 플러그인은 키보드 단축키를 통해 효율적이고 직관적인 거래 경험을 제공하며, 스칼핑 전략을 따르는 거래자들이 빠르고 정확한 거래를 원하는 경우에 특히 유용합니다. 이 플러그인은 거래자의 각 거래에 대한 포지션 크기를 동적으로 조정하고, 정확한 이익추적 및 손실정지 수준을 미리 정의함으로써 거래를 간소화하고 효율화시킵니다. 핵심 기능 : 키보드 단축키 : 거래 과정을 간소화하여, 다음 거래에 대한 포지션 크기 조정, 매수, 매도, 주문 관리를 위한 사용자 정의 가능한 키보드 단축키를 사용합니다. 동적 포지션 크기 조정 : 거래 시점에 따라 포지션 크기를 쉽게 증가하거나 감소시키며, 시장에 민감하게 대응할 수 있습니다. 위험 관리 : 각 거래에 대한 이익추적 및 손실정지 수준을 피프로드로 미리 정의하여, 모든 거래에 대한 위험을 정교하게 관리합니다. 사용자 정의 : 차트의 글꼴 스타일, 글자 크기 및 배치
FREE
Big Collection Strategies-советник для метатрейдер МТ4,с более десятью режимами работы: 3 основных и несколько подрежимов для каждого основного. Предпочтительно использование на валютных парах.
По умолчанию стоить режим усредьнителя с помощью отложенных ордеров.Выбор торгового режима осуществляется изменением параметров в окне настроек.
Параметр STRATEGY устанавливается равным 1,2 или 3.Необходима оптимизация параметров на каждой торговой паре, в зависимости от выбранной стратегии и режима раб
FREE

this indicator Construction on Gann angles and it,s very effective .you can use it as (Support and resistance)
it,s very successful and easy to use.if candle Cross through level thats mean price is going ti next level
but with on condition. The price cames from a previous level
There is a variable of angles for frames the best is 1h frame and stander variable.........
FREE

Индикатор пригодится тем, кто использует кластеры Фибоначчи в торговле и применяет построения с разными наборами уровней. Каждый набор уровней применителен как к уровням Retracement , так и к Expansion (выбирается в настройках). Уровни задаются перечислением в формате "0;50;61.8;100". Настройки индикатора: Fibonacci #1 – Набор уровней #1 Fibonacci – Тип уровней : Retracement или Expansion Levels – Набор уровней в формате "0;23.6;38.2;50;61.8;100" Color line – Цвет линии Style line – Стиль линии
FREE

RaysFX StochRSI Presentiamo un indicatore MQL4 sviluppato da RaysFX, un rinomato sviluppatore nel campo del trading algoritmico. Questo indicatore è una combinazione semplice ma potente di due indicatori popolari: RSI e Stocastico. Caratteristiche principali: RSI : Un indicatore di momentum che misura la velocità e il cambiamento dei movimenti dei prezzi. Stocastico : Un indicatore di momentum che confronta il prezzo di chiusura di un titolo con la gamma dei suoi prezzi durante un certo periodo
FREE

The SFT Fibo Smart Pivot indicator is a powerful trading tool based on the Fibonacci Golden Ratio, designed to identify key support and resistance levels in the forex market. This indicator has the ability to pinpoint significant price levels that can serve as entry and exit points for trades. It enables traders to analyze the market more effectively and make well-informed decisions. The indicator uses the Fibonacci Golden Ratio to accurately determine support and resistance levels. These levels
FREE

** All Symbols x All Timeframes scan just by pressing scanner button ** *** Contact me to send you instruction and add you in "All Divergences scanner group" for sharing or seeing experiences with other users. Introduction Divergence is a main technique used to determine trend reversing when it’s time to sell or buy because prices are likely to drop or pick in the charts. All Divergence indicator can help you locate the top and bottom of the market. This indicator finds Regular divergences for

Draw and Sync Objects Multiple Charts 1. Draw objects by key press. ( You must: 1. Press Function key => 2. Click where you want to draw => 3. Draw it => 4. Press ESC to complete). (If you don't want to draw after pressing function key, you must press ESC to cancel). 2. Developing : Sync selected objects to multiple charts by button. 3. Developing: Hide objects that do not belong to the current symbol (Objects drawn with this indicator will belong to the symbol they are plotted
FREE

This SMART Expert Advisor trades SAFE and STEADY a nd manages all position's risk.
This is why we call it Smart Safe Steady .
Features Scalper: It is Scalper EA, but does not accept risk a lot to trade over sized, although you can bypass it's default setting in your own risk. Conservative: It is not going to keep trades open in high volatile market so it is SAFE and would close the trades even in zero profit. Martingale: This is not loss accepting so in case of loss, it runs special type of Mar
FREE
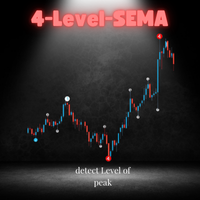
Well known to most, this indicator identifies the chart peaks and assigns the level of the peak. By classifying the peaks into levels, not only is a possible consolidation indicated but also the possible strength up to the highest level that indicates that a trend reversal is likely.
While most SEMA indicators work with 3 levels, this indicator has 4 levels.
This indicator is part of the OH-Strategy. You can view other indicators of this strategy if you click on my name as a seller.

The latest Binary Options arrow indicator in the Garuda Signals product line. Binary options signal based on multiple time frame cross over analysis. Gets confirmation from the most consistent signals known to man; Ichimoku, SMA, Bollinger Bands; and also uses the 1 Hour time frame as trend confirmation , so you don't have to open up multiple chart and waste time. - Can be used for all time frames up to 1 hour, but is most POWERFUL for 1 and 5 min options. - Place your Call/PUT based on the Arro

Nas100 killer V2 (See video of how we test the indicator live) 1000% non-repaint indicator appears on current candlestick. Timeframes: M5, M15, M30, H1, H4. Works on pairs such as (NAS100, US30, SPX500, and Gold) The indicator is strictly for scalping do not hold trades for too long. Orange arrows look for selling opportunities. Light Blue arrows look for buying opportunities.
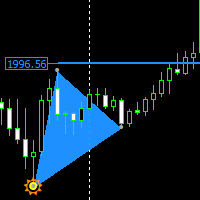
Non-repaint price action pattern based indicator works on all timeframe the indicator is based on a 123 Triangle pattern that happens everyday on the market the indicator will point out the pattern for you and you can turn on Fib level to see your take profit. Blue triangle is a buy signal Red triangle is a sell signal horizonal blue and red lines is an indication to place your trail stop loss one price has reached that area only entry when the triangle has fully formed

Hey traders, this EA has been made for a vey specific group of traders. this EA will work best for new traders with smaller accounts as I made it for myself originally. I would recommend using a 500USD account with a set lot size of 0.01(this can be changed as and when you feel like it) and this EA is ONLY intended for BTCUSD (Bitcoin vs the US Dollar) With this bot I can get 90%+ in back testing on MT4 the setting to use are as follows, but let me know if you need any help and ill be happy to e
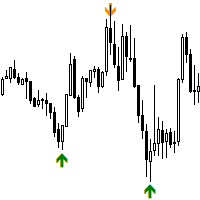
Swing Points Indicator for MetaTrader 4
The **Swing Points Indicator** is a custom-built technical tool designed for MetaTrader 5 (MT5), primarily used for identifying crucial reversal points in price action. By plotting swing highs and swing lows, it highlights potential trend reversals, making it a valuable tool for traders relying on price action analysis. This indicator helps traders anticipate changes in market direction by visually marking significant turning points on the chart.
Main F

This indicator scans the Moving Average values for 2 Moving Averages on multiple pairs and multiple timeframes in realtime and displays a Buy signal when the fast MA is above the slow MA and a Sell signal when the fast MA is below the slow MA.
-All the MA parameters(Period, Method and Applied price) can be changed from the inputs window.
-You can either add your own list of pairs to scan or set the scanner to automatically use the pairs in the market watch using the Symbols Source input.
-T
FREE

One of the most powerful and important ICT concepts is the Power of 3. It explains the IPDA (Interbank Price Delivery Algorithm) phases. PO3 simply means there are 3 things that the market maker's algorithm do with price:
Accumulation, Manipulation and Distribution
ICT tells us how its important to identify the weekly candle expansion and then try to enter above or below the daily open, in the direction of the weekly expansion.
This handy indicator here helps you keep track of the weekly and
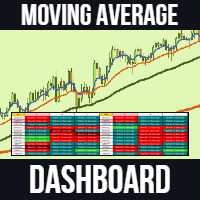
Moving Average Dashboard Pro is an improved and advanced indicator of the free version "Moving Average Crossover Bars ago Dashboard" The moving average dashboard pro gives you a dashboard view of bullish and bearish moving average crossovers. For example, if there was a bullish moving average crossover 5 sessions ago, then you would see 5 bars ago . This indicates that there was a bullish crossover 5 sessions ago. This indicator is useful if you want to catch the trend early on when using moving

Elliott Wave Trend was designed for the scientific wave counting. This tool focuses to get rid of the vagueness of the classic Elliott Wave Counting using the guideline from the template and pattern approach. In doing so, firstly Elliott Wave Trend offers the template for your wave counting. Secondly, it offers Wave Structural Score to assist to identify accurate wave formation. It offers both impulse wave Structural Score and corrective wave Structure Score. Structural Score is the rating to sh

Snake Eyes Super Scalper the trading revolution
Snake Eyes Super Scalper is a scalper EA, trading strong market movements. The Expert Advisor does not use hedging, martingale, grid, arbitrage, etc. strategies. The basis of the EA strategy lies on the contrarian breakouts of key levels based to MA, FIBO and Volatility It is important to note that the High Frequency Forex Robot does not trade every day, and it may go a week or more without opening any trades. However, when it does trade, it do

The new version of the trading panel, which now has the ability to separately close Buy and Sell orders, display targets for all orders on the chart, as well as the ability to use the panel to trade with brokers working on the FIFO rule. Also, the new version adds option buttons for separate management of open orders.
It has a convenient visualized interface and intuitive control without a lot of additional tabs to which traders have to be distracted and switch their attention. Thanks to this,
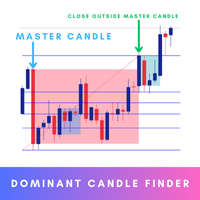
Dominant Candle Finder is a significant candlestick on a price chart that stands out due to its size, volume, or price movement compared to surrounding candles. It often indicates strong buying or selling pressure and can be used to identify potential reversal points, breakouts, or continuations in the market. Dominant candles can serve as key indicators for traders to make informed decisions, providing insights into market sentiment and potential future price movements. MT5 Version - https:

Alpha Trend is a trend indicator for the MetaTrader 4 platform; it has been developed by a group of professional traders. The Alpha Trend indicator finds the most probable tendency reversal points, which allows making trades at the very beginning of a trend. This indicator features notifications, which are generated whenever a new signal appears (alert, email, push-notification). This allows you to open a position in a timely manner. Alpha Trend does not redraw, which makes it possible to evalua
Discover our sophisticated Expert Advisor (EA) designed for the MetaTrader 4 (MT4) market: IT Bollinger Bands. This free EA exploits a trading strategy based on Bollinger Bands, offering a powerful approach to optimizing your operations in the financial market. Key Features : Bollinger Bands Strategy: Our EA uses Bollinger Bands, a popular approach in technical analysis. Based on the period (20), the standard deviation (2), and the shift of the bands, our EA identifies trading opport
FREE

This indicator is designed to detect high probability reversal patterns: Double Tops/Bottoms with fake breakouts . This is the FREE version of the indicator: https://www.mql5.com/en/market/product/26371 The free version works only on EURUSD and GBPUSD! Please read also the blog post " Professional Trading With Double Tops/Bottoms And Divergences! " which explains the concepts behind the ULTIMATE Double Top/Bottom indicator and how you can use a professional top-down approach. The provided video
FREE

XPointer is a completely ready trading system. It shows the trader when to open and close a trade. It works on all currency pairs and all time frames. Very easy to use and does not require additional indicators for its operation. Even a beginner trader can start working with XPointer. But it will also be useful for professional traders to confirm the opening of orders.
Features of the XPointer indicator It does not redraw its values. It works on all currency pairs and all time frames. It has al

Small free indicator to detect certain chart patterns, shoulder head shoulder / reverse, triple top / bottom, cup, flags and others... I designed it a while ago, it detects figures in m1, m5, m15, m30 and h1.
I hope it will be useful to you because I don't trade much with this indicator, I have a few others that I will try to put online quickly maybe you will find it useful, good Trade friends.
FREE

The ' Average Bar Chart ' indicator was created to showcase the traditional Heiken Ashi calculation as an exotic charting style. This indicator is known for reducing chart noise for a smoother price action. A dditional indicators are recommended
Key Features Candlesticks for OHLC are removed from the chart. Average bars may be shown as complete bars without tails. All functionality and features of this exotic chart are inputs.
Input Parameters Chart Timeframe = PERIOD_CURRENT; - period to set
FREE
As we know, МТ4 and МТ5 do not store tick history, which may be necessary to develop trading strategies and market analysis. I have developed a method allowing you to receive tick history very easily. The indicator gathers tick history in real time and writes it to XXXXXX2.hst file, where XXXXXX is a symbol name. This file can be used to create an offline chart or something else. If you use a trading robot, then launch the indicator and control your broker by examining the spread and quotes. All
FREE
MetaTrader 마켓은 MetaTrader 플랫폼용 애플리케이션을 구입할 수 있는 편리하고 안전한 환경을 제공합니다. Strategy Tester의 테스트를 위해 터미널에서 Expert Advisor 및 인디케이터의 무료 데모 버전을 다운로드하십시오.
MQL5.community 결제 시스템을 이용해 성능을 모니터링하고 원하는 제품에 대해 결제할 수 있도록 다양한 모드로 애플리케이션을 테스트할 수 있습니다.
트레이딩 기회를 놓치고 있어요:
- 무료 트레이딩 앱
- 복사용 8,000 이상의 시그널
- 금융 시장 개척을 위한 경제 뉴스
등록
로그인
계정이 없으시면, 가입하십시오
MQL5.com 웹사이트에 로그인을 하기 위해 쿠키를 허용하십시오.
브라우저에서 필요한 설정을 활성화하시지 않으면, 로그인할 수 없습니다.