YouTubeにあるマーケットチュートリアルビデオをご覧ください
ロボットや指標を購入する
仮想ホスティングで
EAを実行
EAを実行
ロボットや指標を購入前にテストする
マーケットで収入を得る
販売のためにプロダクトをプレゼンテーションする方法
MetaTrader 4のためのエキスパートアドバイザーとインディケータ - 51

TopSecret TopSecret - automated adviser for professional work in the foreign exchange market. The decision-making algorithm is based on my own method. Statistical methods for a certain time interval is calculated the price level to which the current market price of the trading instrument is always likely to return. The adviser works on any time period, but I recommend working on H1, H4, D1 . The Expert Advisor is installed in the usual way and is immediately ready for operation.
Advisor Benefi
FREE

PL Graph Visualizer は、アカウントの損益をリアルタイムにグラフで表示するユーティリティです。
グラフは通貨ペア別やマジックナンバー別に見ることができ、ポジションごとの損益の推移が一目でわかります。 このツールは、ここにある統合決済ツールと組み合わせて使用すると、その機能をさらに強化できます。
https://www.mql5.com/en/market/product/116884
リアルタイムのグラフには口座全体の損益だけでなく、複数の通貨ペアの損益状況も表示されるため、トレーダーは詳細な変化を瞬時に把握することができ、意思決定を支援し、より効率的な取引を行うことができます。
リアルタイムの損益の可視化により、取引戦略を強化します。
このツールはリアルタイムでチャートを生成するため、チャートを閉じたり、時間足を変更したり、MT4を再起動したりすると、最新のデータからチャートが再生成されます。
より詳細な情報:
https://www.mql5.com/en/blogs/post/757410
FREE

Tester Periods is the useful indicator for visual strategy tester which extend chart periods. Its designed for the trading utility Trade Shell (included Trade Shell SMC ).
Run the Trade Shell on the visual tester. Then put the Tester Periods indicator on the chart. If you wanna see timeframes M1, M5, M10, M15 , for example, then you have to run visual tester on M1 and to define multipliers like that: TimeFrame_Periods_Multiplier = 1,5,10,15 If you wanna see timeframes M5, M20, M30, H1, fo
FREE

Torakiki takes advantage from the only sure thing about Forex: price will move. It works 24/7 opening at any time two baskets, one in buy and one in sell. While the one that happened to be in the right direction keeps collecting profits, the other basket opens a grid with a clever recovery mechanism which closes positions one after the other as they reach their individual take profit in those usual bounces back you have even in the strongest trend formation, keeping track of the total profit
FREE
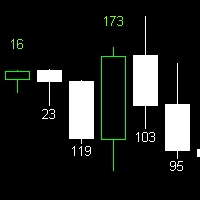
Candle Size Indicator Explore the candle size using this convenient indicator. It works across various timeframes, providing valuable insights for technical analysis. Key Features: Display the size of the candle after configuring the indicator. Compatible with all timeframes. The size of the candle is a significant metric in technical analysis, offering insights into market strength and volatility. This indicator enables clear and accurate visualization of candle sizes on your chart. Utilize thi
FREE

This powerful tool helps you to easily access Fibonacci tools at different times and in different markets. This tool has the ability to send signals based on Fibonacci as well as setting alarms to be aware of broken Fibonacci levels. Among the capabilities of this tool are the following:
Identifies market trends Fibonacci auto design If Fibonacci levels are broken, it sends a message Send Fibonacci signal
Manuals: After selecting the target market, run the tool In the input settings accordi
FREE

This Robot was created to be used in backtesting and to be able to prove to yourself that it is possible to win in trading, you open and close operations in backtest being able to manipulate Take Profit and Stop Loss.
This means that you will be able to see and interpret your trading. Somos empresa pequeña donde hacemos robots por encargo contactanos y lo haremos posible lo que desees :)
https://t.me/iamrealjokr
FREE
Highly configurable Osma indicator.
Features: Highly customizable alert functions (at levels, crosses, direction changes via email, push, sound, popup) Multi timeframe ability Color customization (at levels, crosses, direction changes) Linear interpolation and histogram mode options Works on strategy tester in multi timeframe mode (at weekend without ticks also) Adjustable Levels Parameters:
Osma Timeframe: You can set the lower/higher timeframes for Osma. Osma Bar Shift: Y ou can set
FREE

MT4用FXインジケーター「トレンドエントリーヒストグラム」
トレンドエントリーヒストグラムインジケーターは、エントリーバーが表示されたら、トレンド方向へのエントリーシグナルの検索に使用できます。 このインジケーターにはユニークな機能があり、計算には価格と出来高の両方が必要です。 トレンドエントリーヒストグラムは 2 色で表示されます。弱気トレンドの場合は赤、強気トレンドの場合は青です。 安定したトレンド (同じ色のヒストグラム バーが最低 10 個連続) が表示されたら、エントリー バーを待ちます。 エントリーシグナルは、ヒストグラムの反対の色を持つ 1 つの列と、初期トレンドの色を持つ次の列です (図を参照) 短いターゲットを使用します - 現在のトレンドに応じてチャート上の最も近い高値/安値を使用します インジケーターにはモバイルおよび PC アラートが組み込まれています インジケーターの使用方法: - 買いシグナルの場合: 着実な強気トレンド (青いヒストグラム バー) + ヒストグラム上の 1 つの赤いバー + 1 つの青いバー (ここでロング取引を開く) - 売りシグ
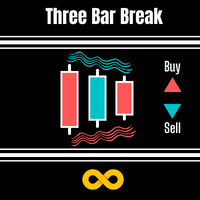
DESCRIPTION 3 Bar Break is based on one of Linda Bradford Raschke's trading methods that I have noticed is good at spotting potential future price volatility. It looks for when the previous bar's High is less than the 3rd bar's High as well as the previous bar's Low to be higher than the 3rd bar's Low. It then predicts the market might breakout to new levels within 2-3 of the next coming bars. Must also be traded during the active hours of the market you want to trade. EG EURUSD 7am - 5pm This
FREE

The FxSProMT indicator shows the current market trend and trend change.
Indicator Parameters Ind_Period - the number of previous bars used to calculate actual values. Number_Bars - the number of bars to display the indicator.. Too many bars may significantly slow down the operation of the trading terminal. Signal_Sound - sound alert to notify of trend change. The sound can be played multiple times until the signal is confirmed (the bar closes). Default is disabled. Signal_Alert - an alert to n
FREE

MACD Dashboard Panel This indicator helps you to scan symbols which are in the Market Watch window and filter out a trend according to MACD.
Moving Average Convergence Divergence (MACD) is a trend-following momentum indicator that shows the relationship between two moving averages of a security’s price. The MACD is calculated by subtracting the 26-period Exponential Moving Average (EMA) from the 12-period EMA.
The result of that calculation is the MACD line. A nine-day EMA of the MACD call
FREE

Download directly the indicator file here. (if you can't open on MT4) MACD Indicator is one of the most popular momentum indicators among users. Searching and detecting MACD signals by the eye may not be easy. Scan Full Charts Dashboard Indicator with simple user interface and search customization panel saves time and scans all charts for MACD signals search and notifies the user with high accuracy. After finding the signal, the user was aware of the result by alerts and notifications. This ind
FREE
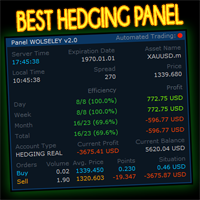
WOLSELEY's Trading Panel View your history in a structured and detailed manner, with efficiency rate and profit rate separated by day, week, month and total, as well as asset details, server time and positions&orders in progress. This panel was created looking on HEDGE-type accounts, but it can be used on NETTING-type accounts without any problems. In the PREMIUM version of this Panel you have the option to use buttons to facilitate the processing and execution of positions&orders in progress.
FREE

This SMART Expert Advisor trades SAFE and STEADY a nd manages all position's risk.
This is why we call it Smart Safe Steady .
Features Scalper: It is Scalper EA, but does not accept risk a lot to trade over sized, although you can bypass it's default setting in your own risk. Conservative: It is not going to keep trades open in high volatile market so it is SAFE and would close the trades even in zero profit. Martingale: This is not loss accepting so in case of loss, it runs special type of M
FREE

Expert Advisor uses Rsi and Bands indicators for generating signals and trades exit. Minimum trading deposit 500 $ . EA optimized to run on GOLD / EURUSD / GBPUSD / USDJPY / AUDNZD 1H charts (sets in the comments) can be also optimized to work on more charts and different timeframes. EA uses Grid. No Martingale. Works with high spread This EA operates only once per bar opening.
developed, tested and optimized on " VantageMarkets " platform. Recommended broker > Vantage Account Optio
FREE

Developed methods for trading collected in one indicator. In the form of arrows, it defines entries in the direction of the trend.
It has 2 types of arrows - trend and signal guides, informing about the potential movement in the direction of the trend.
Works without redrawing, ready for use on all symbols/tools.
The most suitable time frames to use are M15, M30, H1, H4.
How to use
The indicator finds the direction of the trend in the form of a signal arrow, a graphic rectangle stretches
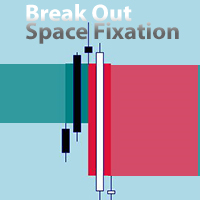
An EA version is being prepared. You can send a private message "notify about EA version".
EA will be versatile with many settings for trading on various indicators. The new EA will also allow trading on this indicator. For example, allowing signals after X signals/bars to X signals/bars in one direction, before changing direction. If Break Out happened before/after the signal of another indicator. Collect profit on each next signal above/below the previous one.
Send a private message "noti
FREE

Nermal Round Levels is an indicator of round numbers in the form of a grid drawing horizontal lines. You can use it in many ways ... as it could be activating for an expert advisor to enter the market, confirmation of entry for your strategy, entrance area, mark areas of important levels, possible rebounds and others. Place it in your chart and verify as the price respects those round levels.
Inputs GridSpace linecolor lineStyle
FREE

Consolidation is when price is moving inside a clear trading range. When prices are consolidated it shows the market maker placing orders on both sides of the market. This is mainly due to manipulate the un informed money. This indicator automatically identifies consolidation zones and plots them on the chart. The method of determining consolidation zones is based on pivot points and ATR, ensuring precise identification. The indicator also sends alert notifications to users when a new consolida
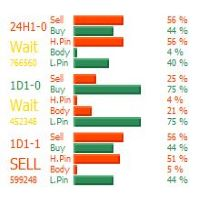
Bar Direction, This indicator is created for MetaTrader 4, It will show you strength of bar directions which you can add more options of bar as adjustable requirement such as Bar Timeframe, Bar Shift, Bar Period and also you can set true or false for Signal Alert to your Popup, Email or Push Notice and more of more you can set to show guideline for entry point according to your adjustable options also Ask-Bid and Spread Showing. It will be your assistance for reading bar strength direction easil

This reliable, professional trade copier system is without a doubt one of the best on the market, it is able to copy trades at very fast speeds from one master account (sender) to one or multiple slave accounts (receivers). The system works very fast and mimics the master account a full 100%. So changing stop losses, take profits, pending orders on the master account is executed on the slave accounts too, like each other action. It is a 100% full copy (unlike many other copiers who only copy ma

This indicator is SO SIMPLE… when the green Rise Coming arrow appears, a price drop may be on the way! Plain and easy profits! As you receive more than one 'Rise Coming' text signal in a downtrend, it means momentum is building larger for a bull run. HOW TO USE 1. When the green "Rise Coming" text appears, a price jump may be on the way! This indicator Never Repaints! To get the best setting it's a matter of tweaking the indicator until it gives you the best results. Our recommendation, and what

The Screen Shooter utility will help you take screenshots of your trading process.
How it works: The program is a small panel with two modes of operation: the first mode "All Open Charts" - allows you to create screenshots of all charts open in the terminal; the second mode "All TF Curr Chart" - creates, accordingly, screenshots of all timeframes of the current chart (to which this tool is attached). In the second mode, the user can disable unnecessary timeframes using the buttons on the panel

This is a trading EA on M1 Chart for currency pair GBPUSD. I don't recommend you to use in other charts or currency pairs. Backtests are performed at mt5 and my Broker is FxPro. (Mt5 version is https://www.mql5.com/en/market/product/55467 ) "Works On M1 Chart"; // GBPUSD Strategy Properties Parameters are, LessOrderMoreProfitFactor_Flag = false; // Less Order More Profit Factor (trade is very rare but profit factor is high Entry_Amount = 0.01; // __Amount for a new position [lot] Take_Pr
FREE

AntiMartingale-Execution is a pyramidal Money Management system capable of increasing positions as equity increases using the positive margin of the transaction. It is possible to set the capital for each operation, the operating and maximum margins and the target level to be reached. Once the general trade settings have been made, it is possible to preview the grid of operations that will be activated by pressing the BUY / SELL button. If necessary, it is also possible to close all operations

Description Shows whether market is trending or not, to what extent, which direction, and if the trend is increasing. The indicator is very useful for trend following strategies. The indicator can also alert when the market transitions from being flat to trending, which can serve as a great entry point. The alert is controllable directly from the chart, with an on-chart tick box to enable the alert. Also includes bonus indicators of current spread and ask/bid prices in large text, color coded as

Correct market entries and exits are essential for any Forex trader. MasterArrow indicator addresses this issue. It has no redundant elements and draws only buy/sell arrows. The up arrow is a BUY signal, while the down arrow is a SELL one. The indicator is simple to configure. Change the Strength parameter to configure the signals frequency. The product is based on standard indicators (MA, RSI, ATR, etc.). But it also features the custom algorithm allowing to combine them into a single tool and

The indicator is based on pair trading methods. It is not redrawn unlike similar indicators. Shows correlation between two selected instruments in percent for a predetermined period, and the positions of the instruments relative to each other. Has a function for reverse display of any of the analyzed symbols - for instruments with negative correlation. Can be drawn as a line or as a histogram. Settings: Symb1 - first symbol name. Revers1 - reverse display of the first symbol. Symb2 - second symb

Active Price Lines
Indicator gives you full custom control over the Bid and Ask price lines, both color and style. Color control is also customizable based on increased or decreased price by the tick.
Options include: Show both the Bid line and the Ask line Set unique color for each Set unique line style for each Set unique color for increased price (by the tick) Show only Bid line Show only Ask line
Rider Capital Group
FREE
From USD 49 to USD 39 Objective: To notify/alert traders if price touched or closed above/below the moving average. Features/Settings: Moving average method supported: Simple, Exponential, Smoothed and Linear Weighted Works on all currency pairs. Set the Moving Average Period/Shift value Timeframe supported: 1m, 5m 15m, 30m, 1H, 4H, 1D, 1WK, 1Mo Set the Applied Price: Close, Open, High, Low, Price, etc. Set the Candle Size Type: Full Length or Body Length Set the Candle Size to Trigger an Al

Channel Vertex is a price action pattern formed by price Chanel and a triangle pattern . Price channels basically indicates possible support and resistance zones around a price movement and retracement or breakout at these levels can indicate possible trend continuation or reversal .
Majority of the times price fluctuations forms triangle patterns defined by 3 vertexes , these triangle patterns most times defines a trend continuation. A triangle pattern is a trend continuation pattern tha

Attention!!! Do not try to test the EA in the MT4 Tester, it is simply impossible, because the EA opens positions on 27 different instruments and 8 timeframe . The tester is able to test only one pair. Multi-currency tester is possible only in MT5. Instructions for launching a multi-currency tester in MT5: https://youtu.be/WrQQwMQclrY How EA works: 1. The main strategy for the breakdown of local extremes is used. 2. An additional algorithm is used to control losing trades and redistribute

MT4用FXインジケーター「MACD with Trend ZigZag」
MACD インジケーター自体は、トレンド取引で最も人気のあるツールの 1 つです。 「MACD with Trend ZigZag」は、プライスアクションエントリーや他のインジケーターと組み合わせて使用するのに最適です このインジケーターを使用して、最も正確なエントリーシグナルを選択します。 - MACD が 0 (緑色) より上で、ジグザグ ラインが上向きの場合 - 買値アクション パターンのみを検索します - MACD が 0 (ピンク色) 未満で、ジグザグ ラインが下向きの場合 - 売り価格アクション パターンのみを検索します インジケーターにはモバイルおよび PC アラートが組み込まれています
// さらに優れたエキスパートアドバイザーとインジケーターはここから入手できます: https://www.mql5.com/en/users/def1380/seller // また、収益性が高く、安定していて信頼できるシグナル https://www.mql5.com/en/signals/1887

ATR on Prices is simply an ATR indicator that plot a line for Resistance and Support using the Average True Range calculation. You can set the ATR daily periods, to be calculated. As well you can set the reference price to add and subtract the ATR measure to obtain the ATR Top and ATR Bottom lines, using the Open Price (that is fixed) or the Middle (HL/2) price (that will vary on the day) Or adding the ATR to the daily low and subtracting it from the daily high . You can use full ATR measure or
FREE

This indicator plots in the candles the divergence found in the selected indicator and can also send a notification by email and / or to the cell phone.
Works on all TIMEFRAMES. Meet Our Products
He identifies the divergences in the indicators:
Relative Strength Index (RSI); Moving Average Convergence and Divergence (MACD); Volume Balance (OBV) and;. iStochastic Stochastic Oscillator (STOCHASTIC).
It is possible to choose the amplitude for checking the divergence and the indicator has
FREE

This indicator shows us the trend or direction of the market and a possible stop loss
This indicator works with two parameters, period and multiplier. Buy and sell signals are generated when the indicator crosses the closing price and it changes color.
This indicator is used in all types of markets such as stocks, futures, forex, cryptos, additionally it can be used in different time periods: hours, daily, weekly, etc.
It is recommended not to use it while the market is sideways, this can
FREE

Note : New in 1.6: the indicator now exports the trade signal (but not displayed). Go long with light blue. Go short with red. Exit otherwise. Signal to be imported to your EA using iCustom. This indicator provides Best of the Best linear filter momentum oscillators that I am aware of (Low Pass Differentiators, LPD's) . All of them are recent developments by this developer, or other researchers. The oscillator line is the first buffer of the indicator, and can be called in other indicators or
FREE

The implementation of the impulse system described by Dr. Alexander Elder. The indicator colors the bars according to the following pattern: Moving average and MACD histogram increase - green bar, it is forbidden to sell; Moving average and MACD histogram have different directions - blue bar, the ban is removed; Moving average and MACD histogram decrease - red bar, it is forbidden to buy.
Indicator Parameters EMA - period of the indicator's moving average MACD Fast - period of the fast moving
FREE

A.このピボットインジケータは日ピボット価格を示します。
B.抵抗R0.5、R1、R1.5、R2、R2.5、およびR3も表示されます。
C.サポートS0.5、S1、S1.5、S2、S2.5、およびS3も表示されます。
入力:
入力の下に、3つの変数があります。
1.ExtFomula。ここでは、チャートウィンドウ上の抵抗または支点に1または2または3以下の値で優先出口を設定できます。 1は抵抗または支持体1での出口を表し、2は抵抗または支持体2での出口を表す。3は抵抗または支持体3での出口を表す。
ExtHowmanyDays。デフォルトは30日間です。 ExtFomulaに1、2、3のいずれかを入力すると、過去30日間の出口サポートとレジスタンス価格がチャートウィンドウに表示されます。
3.ExtDraw。チャートウィンドウまたはその逆ビザにサポートとレジスタンスを描画できるようにするには、trueを選択します。
利点
1.表示器はサポート3か抵抗3まで見ることを可能にします
2.インジケーターを使用すると、選択した任意の抵抗またはサポートでチ
FREE
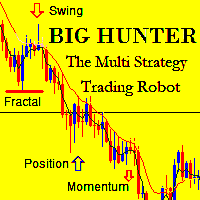
The Multi Strategy Trading Robot
This automated trading robot always uses stop loss. Big Hunter is specially designed to trade gold , but you can test it on other pairs since you have the access to the parameters. The robot uses different strategies like swing trading , momentum trading , position trading and more. It's backtested for the last 10 years under the harshest, simulated market conditions. Each trade has unique SL, TP, Trailing stop, and breakeven. These parameters are variabl

Contact me after payment to send you the User-Manual PDF File. Divergence detection indicator with a special algorithm. Using divergences is very common in trading strategies. But finding opportunities for trading with the eyes is very difficult and sometimes we lose those opportunities. The indicator finds all the regular and hidden divergences. (RD & HD) It uses an advanced method to specify divergence. This indicator is very functional and can greatly improve the outcome of your trading. Thi

EA will trade base on manual entry. It will do martingale if your position in losses. There are no backtests available. This is a semi-automated EA that requires human intervention or initial order to be triggered by user. The main purpose of this EA is to open trade in the same direction with bigger lot size when initial trade losses. It is barely impossible for human being to trade like this 24 hours a day. This technique is well known to many trades and many use it to recover their losses. Ho
FREE

Downloads missing data for all currency pairs available in market watch. Very useful for backtesting EAs and strategies and downloading all history at once instead of individually. This products downloads data for the Ultimate Sniper Dashboard and can work with any other products. The indicator will run until all the historical data for the selected currency pairs have been downloaded. The indicator has multiple options: 1. Download data for single pair 2. Download for current pair only 3. Downl
FREE

Trade Report Pro is an EA that create professional graphic report of your trade history automatically and manually. It also send notification to your mobile or email once your account balance changed. Reports are saved by HTML and CSV format, while opening a quick summary report window inside MT4. Note: Demo version for testing can be downloaded at: https://www.mql5.com/en/market/product/5054 .
Followings are highlight features: Report with full and professional statistics, which is better than

Close All Orders for MT4 script - closes absolutely all orders, whether pending or market ones.
Orders are closed at the current profit/loss indicators at the time of closing.
The script is suitable for moments when you need to quickly close all orders at the current indicators.
The script is very easy to use, just drag the script onto the chart and it will do its job.
Add me as a friend, I have many other useful products.
FREE
Индикатор предназначен для разметки ,фибо уровней и фибо зон.Также есть возможность удаления и редактирования уровней на текущем графике. При установке нескольких индикаторов (FIBO-ZONES)на график,не забывайте менять имя в поле (NAME).В утилите также есть возможность менять цвет зон, толщину линий и стиль линий уровней фибо. При установке индикатора ,зоны выстраиваются автоматически.
FREE

This highly informative indicator applies overbought/oversold levels for more accurate representation of the market situation. All moving average settings are available, including average type and price it is based on. It is also possible to change the appearance of the indicator - line or histogram. Additional parameters enable more fine-tuning, while trading can be inside the channel and along a trend.
Distinctive features Oversold/overbought levels; Does not redraw. Additional parameters fo
GO Breakout and Retest is probably the best price action indicator you can currently find on the market. Designed for price action traders and not only, the indicator helps you spot retests after breakouts of supply / demand zones.
After purchase, leave a review, a comment or make a screenshot of your purchase and contact me to receive for free the Trade Entry Manager utility !
Please read the full description of the product in order to use the indicator properly !
Feel free to check out

+ 2 bonus strategies! Alerts! I recommend watching my advisor - Night Zen EA The indicator combines the most popular moving average strategies: Simple moving average crossover. Moving average crossover relative to the position of the slower moving average. 2 bonus strategies : The crossing of the fast moving average with the calculation of the opening prices of the slow moving average with the calculation of the closing prices taking into account the slower moving average. (The settings for th
FREE

Displays previous months Highs & Lows. You can set the number of months to display levels for, also the line style, color and width. This is very useful for traders using the BTMM and other methods like ICT. I'll be creating similar indicators for MT5 for the BTMM. Send me your suggestions to my Telegram: https://t.me/JDelgadoCR Take a look at my other products at: https://www.mql5.com/en/users/jdelgadocr/seller
FREE

US SNIPER EA - FREE VERSION This EA is a single entry type which does not use dangerous strategies such as martingale, grid, averaging or other dangerous strategies. Using a measurable stop loss and take profit.
This EA Build with an AI which can measure risk by determine the StopLoss and Take Profit. We limit the maximum risk for 40pips so trader can set the lot size for maximum risk we can afford if hits for maximum StopLoss
BLACK FRIDAY SUPER DISCOUNT From Real Price $450 TO Only $99 Ge
FREE

For Gold EA is a scalping program that trades breakouts of support and resistance levels using a trailing stop. The program analyzes market activity and determines the optimal entry and exit points for short-term transactions. The program automatically moves the stop loss behind the price to protect profits and reduce risk. The program is suitable for trading on XAU/USD on the M30 timeframe. The program has a simple and user-friendly interface that allows you to customize trading parameters acc

just buy can only buy and do martingale which is calculated safely and can be controlled via the vps server you have, use safe settings What are your reasons for using EA? Has EA been backtested for the past 10 years? You know the Singgihgale system is the worst way of trading ever. A trader must trade like a sniper not a machine gunner. The EA robot with the minggihgale system will be destroyed when the price moves in one direction, for example an uptrend or downtrend when fundamental news re
FREE

Bollinger Bands with NN “Bollinger Bands are a widely used technical indicator for measuring and displaying the volatility of securities. The bands accomplish this by showing whether prices are high with the use of an upper band, and whether they are low with the use of a lower band. The bands are based on the volatility (standard deviation) of the past price data. This indicator can aid in rigorous pattern recognition and is useful in comparing current price action to possible buy and sell sign
FREE
Vertical Lines for Hour - Time-Based Trading Indicator The Vertical Lines for Hour indicator allows you to mark up to 4 vertical lines at specific times on your chart. Simply enter the hour without considering the minutes, and you can also choose the color for each line. This indicator is useful for identifying session ranges or implementing custom trading strategies. It provides a straightforward solution for your trading needs. Key Features: Mark up to 4 vertical lines at specified times. Sele
FREE

TH3ENG CURRENCY STRENGTH SCANNER The best currency strength reader based on more than 4 excellent modes, based on Price action and Volume with various algorithms. This indicator reads all pairs data to measure and find the best results of all currencies and arrange it in a separated dashboard panel.
You can find the strongest currency and the weakest currency, then trade on them pair. NOT COPLICATED NOT REPAINTING NOT LAGING
Input Parameters
=== SYSTEM SETTING === Calc. Mode ==> Calculatio
FREE

The Expert Advisor of the Forex Fraus family, the system is designed for scalping the EUR/USD pair on the M1 timeframe (for five digit quotes), and adapted for the accounts with fast execution of orders.
Operation Principle Buys at the extreme Lows and sells at the extreme Highs of the Stochastic indicator values. When a signal is received the orders are opened by injection, using tick data. Positions are closed by Trailing Stop Not closed positions are closed at the opposite trade Built-in ad
FREE

A simple tick indicator of Bid and Ask prices. The period separator (1 minute) is displayed as a histogram. Parameters Price_levels_count - number of price levels to be displayed. Bar_under_calculation - number of bars of the indicator to be displayed on the chart.
FREE

Flag On gitFlex is a sophisticated trading robot developed for the Forex market. This Expert Advisor (EA) employs mathematical methodologies alongside a scalping algorithm to optimize trading strategies. This system is designed to perform efficiently both on personal computers and VPS (Virtual Private Servers), with a recommended maximum latency of up to 100ms. It operates by analyzing market dynamics independently, without the reliance on conventional indicators and market patterns. Configurati
FREE
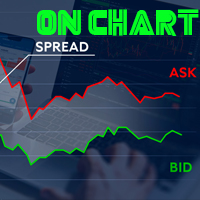
Indicador de Spread en Tiempo Real en la Gráfica Este indicador revolucionario te brinda una visión transparente y detallada del spread en tiempo real directamente en tu gráfica de trading. Diseñado para proporcionar información precisa y crucial, este indicador mejora tu capacidad para tomar decisiones informadas y optimizar tu rendimiento comercial. Características Destacadas: Visualización Instantánea: Observa el spread en tiempo real directamente sobre tu gráfica, eliminando la necesidad de
FREE

ロボットは、1週間のうちでマルチタイムフレームでローソク足の高値、安値を調査します。
またその価格での反転を予測しながらエントリーします。
ベスト通貨はEURUSD でタイムフレームはH1,H4が好相性です。
デフォルトの設定では、最大で10までエントリーしますので、エントリー数を調整してください。
バスケットクローズを使用して、複数のエントリーを利益が一定値になるとまとめてクローズします。
デフォルトではストップロスは30pipに設定してありますので、ベストの値を入力してください。
利益がマイナスでクローズすると、次のエントリーからロットサイズを上げる設定も使用できます。
タイムフィルターや、GRIDオーダーの機能もついています。 マジックナンバーは自動設定です。複数のチャートにEAをアタッチすると自動で割り振られます。 スプレッドフィルターを使用しない場合はゼロを入力します。 デモテストデーターはMyfxbookと、mq5 webにあります。 URL: Miracle Robot https://www.mql5.com/ja/signals/1795756?utm_
FREE

[各指標の偏差MT4]は18個の指標の集合であり、そのうちの1つを任意に選択して計算に参加させることができます。それは各指標の偏差形を計算することができアラームを促すことができます。
パラメータ設定の説明
[指標]は、計算に参加する18の指標のうちの1つを選択することです (このパラメーターは非常に重要です) 。
[period]は各指標に共通の周期です。
[方法]はいくつかの指標のMAモードです。
[Apply_to]はいくつかの指標の適用価格です。
[Fast_EMA] [Slow_EMA] [MACD_SMA] [K_period] [D_period] [Slowing]これらはいくつかの指標に必要なパラメータですが、これらのパラメータを必要とする指標はほとんどありません。
[Forward_disparity]は、Kラインから現在のローまたはハイまでの最小距離です。
[Forward_count]は前方検索の最大数です。
[***表示形式***]下向きは矢印と線のサイズと色を設定することです。
[alert_NO_OFF]:これはア
FREE
Highly configurable Bollinger Bands indicator. Features: Highly customizable alert functions (at levels, crosses, direction changes via email, push, sound, popup) Multi timeframe ability Color customization (at levels, crosses, direction changes) Linear interpolation option Works on strategy tester in multi timeframe mode (at weekend without ticks also) Parameters:
Bollinger Bands Timeframe: You can set the lower/higher timeframes for Bollinger Bands. Bollinger Bands Bar Shift: Y ou can set
FREE

The Buyside & Sellside Liquidity indicator aims to detect & highlight the first and arguably most important concept within the ICT trading methodology, Liquidity levels. SETTINGS
Liquidity Levels
Detection Length: Lookback period
Margin: Sets margin/sensitivity for a liquidity level detection
Liquidity Zones
Buyside Liquidity Zones: Enables display of the buyside liquidity zones.
Margin: Sets margin/sensitivity for the liquidity zone boundaries.
Color: Color option

Back testing can't; get indicator full performance
Trading the currency markets is a complex business. With so many pairs and multiple timeframes it is almost impossible to monitor them all – but with with the Currency Heatmap you can. The Currency Heatmap indicator delivers the information you need to base your trading decisions on the entire spectrum of currency pairs derived from the 8 major currencies; namely the US dollar, the Euro, the British Pound, the Swiss Franc, the Japanese Yen,

A reversed engineered and improved version of the extremely popular AFSID scalper ( afs-id.com ). Includes re-modeled versions of these 2 well received scalping programs: " AF-Fibo ", and " AF-TrendKiller". Take note that this is a high risk scalper Though improvements have been made to mitigate some of the risks, the risks inherent to martingale scalpers still exists, so use it at your own risk.
afsida Scalper (improved AFSID)
This is a simple martingale scalper which works on any pair
FREE

このコードは、もともとLuxAlgoによって他のプログラミング言語から公開されたものです。
このインジケータは、多くの取引目的に使用できる許容可能なトレンド予測能力を持っています:
このインジケータは、以前に掲載したNadaraya-Watsonスムーザーをベースにしています。ここでは、価格とエンベロープの両極端間のクロスから統合されたアラートを持つ、カーネル・スムージングに基づくエンベロープ・インディケータを作成しました。ナダラヤ・ワトソン推定量とは異なり、このインディケータは逆張り の手法に従っています。
デフォルトでは、このインディケータは再描画される可能性がある ことに注意してください。ユーザーは、設定から再描画しないスムージング方法を使用で きます。三角形のラベルは、このインディケータがリアルタイムのアプリケーショ ンで有用であり続けるように設計されています。 テスターでのバックテストでは、最初のローソク足500本が経過するまでお待ちください。これは、パラメータを計算するために過去のヒストリカルデータを使用するインディケータのテスターからの制限です。
「一目均衡表」の専門的な使い方は、一目均衡表を正しく解釈してグラフを分析することです! はトレーダーが価格グラフ上の指定された点間の比率を素早く簡 単に測定できるようにするグラフィックプログラムです。この時間と価格の指標は、MT4 プラットフォームの一目の戦略に従って図表を分析するための基本的なツールです。この ツールを使用すると、 非常に短期間での価格波だけでなく、時間波の洞察に満ちた完全な 分析も可能になります。分析の実行に費やされる労力は、エクセルを使用して実行される 同様の測定および計算と比較して、何度も最小限に抑えられます。指標は、一目均衡表戦 略を使用するトレーダーの知識と経験、およびそれらの期待を考慮して設計されています。 提示されたツールは私たちの仕事の結果です。 指標のモジュール構造により、論理的な順序で分析を実行できます。このプロセスは過去 の波に関するデータを収集することから始まり、それが将来の市場の動きを計算するため の基礎となります。 計算で考慮されるデータは、予測の正確さにとって非常に重要です。 この操作は最小限に抑えられ、即座に測定値が得られます。 この測
FREE

The "MACD Trend Follower" is an indicator based on the MACD oscillator. It serves to spot the trend direction by giving it a fixed color until the trend changes (the trend direction colors are customizable). The default MACD settings for the indicator has been changed to adapt to the fast moving Forex market, but they can be changed to suit the trader.
Recommended settings for the indicator : - MACD Fast EMA : 8 Periods. - MACD Slow EMA : 13 Periods. - MACD SMA : 5 Periods.
Indicator inputs
FREE
MetaTraderマーケットが取引戦略とテクニカル指標を販売するための最適な場所である理由をご存じですか?宣伝もソフトウェア保護も必要なく、支払いのトラブルもないことです。これらはすべて、MetaTraderマーケットで提供されます。
取引の機会を逃しています。
- 無料取引アプリ
- 8千を超えるシグナルをコピー
- 金融ニュースで金融マーケットを探索
新規登録
ログイン