YouTubeにあるマーケットチュートリアルビデオをご覧ください
ロボットや指標を購入する
仮想ホスティングで
EAを実行
EAを実行
ロボットや指標を購入前にテストする
マーケットで収入を得る
販売のためにプロダクトをプレゼンテーションする方法
MetaTrader 4のためのエキスパートアドバイザーとインディケータ - 44

Medium-term trading system that tries to profit during the price rollbacks after significant movements. The system automatically determines the current trading range, the price rollback levels. This is a demonstration version of the Algorithmic EA, which is optimized over the year 2016 for trading the EURUSD currency pair. It is possible to trade in manual mode using a simple on-screen panel or in fully automatic mode. Amount of trades per month is from 5 to 18 in automatic mode. The recommended
FREE

This indicator plots in the candles the divergence found in the selected indicator and can also send a notification by email and / or to the cell phone.
Works on all TIMEFRAMES. Meet Our Products
He identifies the divergences in the indicators:
Relative Strength Index (RSI); Moving Average Convergence and Divergence (MACD); Volume Balance (OBV) and;. iStochastic Stochastic Oscillator (STOCHASTIC).
It is possible to choose the amplitude for checking the divergence and the indicator has
FREE

This is my own developed EA "Pearl"
It trades the whole market and tries to catch reversals. But it tries to trade within the overall D1-trend. It trades currency pairs only
It uses martingale-strategies. It does use flexible grids though. It is free to you when to increase the lotsize of grid levels A grid level can be skipped. If the price overruns a grid level and volatility is still high, a trade will not open. The EA waits till volatility has decreased. Grid distances can be extended b
Arrow Indicator Trade EA is an Expert Adviser who trades based on custom indicators. When the indicator shows an arrow up, EA will enter into an OP BUY order. Likewise, when the indicator shows an arrow down, EA will make an OP SELL entry. Features: 1. Stop Loss and Manual and Auto TP based on the ATR indicator. 2. Auto Lot and Fixed Lot. 3. Close By Loss and Close By Profit features. 4. Target Profit Balance and Minimum Stop Balance 5. Easy to use. EA does not generate its own signals but gener
FREE
トレンド チャート ヒストグラムは、2 つの移動平均と複数のオシレーターを使用するアルゴリズムに基づくインジケーターです。 カラーコードのおかげで、トレンドを素早く特定し、市場の最大の衝動を利用することができます。
明るい色はトレンドを示し、暗い色は衝動を示し、灰色は市場に参入すべきではないことを示します。
MT5版はこちら。
入力パラメータ:
- 期間 1 (高速期間)
- 期間 2 (低速期間)
- 発振器周期
次の 2 種類のアラートを有効にできます。
- 弱気/強気アラート (市場のトレンドが変化したとき)。
- 売買アラート(強い衝動がある場合)。
アラートのテキストは完全にカスタマイズ可能で、好きなものを入力できます。
アラートはポップアップ、電子メール、プッシュ通知で利用できます。
SPARTACUS2024

スタイルが重要だから
キャンドルの色や背景の明暗を変えたり、グリッドを付けたり消したりするために、いちいちプロパティをクリックするのが面倒なのはよくわかります。ここでは、1つのクリックで解決策です。 トレーダーが望むキャンドルのスタイルを選択するための3つのカスタマイズ可能なボタン。 昼と夜のモードを切り替えるには、1つのボタン。 チャート上のグリッドを表示または非表示にするには、1つのボタン。 ***** 設定で、ボタンを画面上のどこに表示するかを選択できます*****。 私の他の製品をチェックすることを検討してください https://www.mql5.com/en/users/javimorales.fer/seller
ストキャスティックRSIとは何ですか?
ストキャスティックRSI(StochRSI)は、テクニカル分析で使用される指標で、ゼロから1(または一部のチャートプラットフォームではゼロから100)の範囲で、標準の価格データではなく、相対強度指数(RSI)の値の集合にストキャスティックオシレーター式を適用して作成されたものです。
執筆者
ハビエル・
FREE
通知を送信するための自動システム。これにより、サブスクライバーが取引端末からの取引イベントを見逃すことはありません。アカウントの取引操作に関する通知をTelegramメッセンジャーに送信するユーティリティ。 Step-by-step instructions for connecting the utility to a channel in Telegram -> HERE / MT5 -> HERE 利点: 簡単なセットアップと詳細な手順、 調整可能なスクリーンショットを送信する可能性、 絵文字を使用してカスタマイズ可能な通知テキスト、 完全または部分的な開始、終了、および注文の変更に関する通知の調整、 デフォルトで通知を送信する場合、テキストファイルは自動的にダウンロードされます。 保留中の注文の発注または削除に関する通知の調整、 記号とマジックナンバーによる便利なフィルタリング。 入力変数: TELEGRAM BOT AND CHAT SETTINGS Telegram bot token - Enter the token number received after

This indicator integrates the Bollinger Band strategy in calculation with a volume-over-MA
calculation to further narrow down "Areas of Interest" levels for a potential re-test zone to the right of the chart.
We added a Moving Average calculation for a multi-level cloud and further broke down more conditions to highlight both
volume flow crossover on the High and Extreme High MA's and also high and extreme high volume spikes on set period average
without bull\bear conditions. Original Bull
FREE

Multicurrency and multitimeframe indicator of the Standard Deviation Channel. Displays the current direction of the market. On the panel, you can see breakouts and touches (by price) of the levels of the linear regression channel. In the parameters, you can specify any desired currencies and timeframes. Also, the indicator can send notifications when levels are touched. By clicking on a cell, this symbol and period will be opened. This is MTF Scanner. The key to hide the dashboard from the char

Introduction The ST Cross indicator is based on the traditional Moving Average (MA) Cross which uses a fast and slow moving average. Entry signals to buy and sell are given when both moving averages cross. However with the basic strategy there are a lot of false signals. In order to filter the trades we use the 200 (MA) to identify the overall direction of the trend. Input Settings Master Trend Period - 200 Period moving average used to get the trend direction. Fast
FREE

How would you like to instantly know what the current trend is? How about the quality of that trend? Finding the trend on a chart can be subjective. The Fractal Trend Finder indicator examines the chart for you and reveals what the current trend is based on objective criteria. Using the Fractal Trend Finder you can easily tell if you are trading with the trend or against it. It also identifies those times when the market is not trending. Theoretically, you could trade with the trend when the tre
FREE
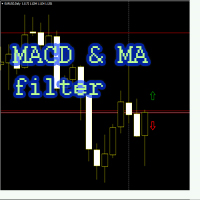
The MACD and MA filter EA trades on the MACD indicator, uses the filter as two moving averages (fast MA is higher than slow MA - buy, sell - contrary), the Martingale is applied at the request of the User (the amount of lot multiplication for a series of losses is limited), breakeven, trailing stop, inverting the signal. In EA version 1.4. added closing an order by a reverse signal, separately by the MACD indicator (parameter Close_By_Reverse_MACD_Signal), separately by moving averages (paramete
FREE
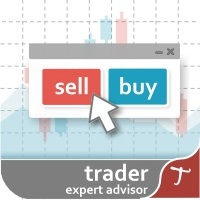
Tipu Trader is a part of Tipu Panel ecosystem that was developed out of need for quick and simple trading. Tipu Trader is an easy to use trade panel for commonly used trade functions. Create you own signals with Tipu Panel and trade along with Tipu Trader, a simple and easy to use trade panel.
Features An easy to use trade panel for most commonly used trade functions. Create your own personal trade signals with Tipu Panel , and trade with Tipu Trader. Customizable Panel. The panel can be moved
FREE

MetaTraderから気軽にツイートするユーティリティー( Expert Advisors )です。 "Twitter API v2 OAuth 2.0 with PKCE"に対応しました
あなたが作成する Indicator,EA,Script に数行コードを追加するだけで TweetHelperがあなたの代わりにメッセージをツイートします
準備: ・Twitter APIにアクセスするために 開発者アカウントを申請 してください。 設定内容と手順につきましては、以下を参照ください。
Example of code (script) for using TweetHelper https://www.mql5.com/ja/code/30967
MetaTraderの設定: Tools > Options > Expert Advisors Allow WebRequest for listed URL: https://api.twitter.com URLを追加してください。 Tweethelperの設定: 取得した[Consumer Keys][Aut

Pivot levels is indicator showing 7 pivot levels. It is adjusted for major use, including: all standard time frames
choice of periods to show three popular calculation formulas (typical, median, weighted) 9 level Camarilla pivot
pivot day shift choice of properties for lines and labels choice of showing alerts when crossing pivot lines Parameters: ----------Main parameters----------- Timeframe - time frame for pivot levels
Number of periods to show - displays pivot levels for number of period
FREE
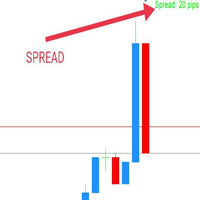
WaSpread MT4 Indicator shows the current spread in pips with color.
* Set the Spread Threshold and the color to identify when the current spread is below or above the Spread Threshold.
* Set X axis and Y axis and chose the Corner and the Anchor to position the Spread Label on the chart.
* Write the font and the font size for more confort.
* Activate alert if the current spread is above the spread threshold.
* For more precision, the user can choose to show the decimal numbers.
* The
FREE

We Trade Live Trend Candle Stick can help identify potential trend in the market when trading, spot market trends and predict future prices. We Trade Live Trend Candle Stick has a smoother look, as it is essentially taking an average of the movement. candles will stay RED during a downtrend and Green during an uptrend . We believe It's useful for making candlestick charts more readable and trends easier to analyse. As a breakout trader you are looking for trades that are ‘breaking out’ of
FREE

どうもこんにちは! 私は日本の個人投資家のタツロンです。FXで10億円以上運用していました。 そこで、私が使っていてとても便利なインディケータをご紹介しましょう。
環境確認型インディケーター。 世界のマーケットが意識するpivotをデイリーとマンスリーの二つに絞りました。 デイリーは1日のトレードの目安になり、マンスリーはスピードの速いブレイク相場でブレイクまたは反転の材料となります。 自信のトレンドラインと重なった場合など、根拠の積み上げとして役に立ちます! 他のインディケーターと一緒にお使いください!
日本語のスクリーンショットのサポートが必要な場合は、 こちら をご覧ください。 実際にインディケータが動いている動画もありますのでご確認ください。 Jpivotは1:48付近からスタートします。
FREE

Fibonacci SR Indicator
This indicator creates support and resistance lines. This indicator is based on Fibonacci Retracement and Extension levels. It will consider many combinations of the Fibonacci levels and draw support/resistance lines based on these. This indicator uses tops and bottoms drawn by the ZigZag indicator in its calculations. The ZigZag can also be drawn on the chart, if necessary. The indicator considers many combinations of past reversal points and Fibonacci ratio levels, and
FREE

This indicator is stand alone version from MP Pivot Levels (All in one) containing Demark's Pivots.
Calculations: PP = X / 4 R1 = X / 2 - LOWprev S1 = X / 2 - HIGHprev Uses: When the pair currency price may change the direction of movement. Possible constraints of support and resistance that creates plateaus for the currency pair prices. Tendency identification by comparing the present prices according to current day's pivot point and also the prior day's pivot points. ___________
FREE

What is crypto trading? A cryptocurrency is a digital (virtual) financial currency, where security of making transactions is provided by using cryptography methods. The concept of the very first digital currency, Bitcoin, was introduced by Satoshi Nakamoto in 2008. Since the moment cryptocurrencies appeared, they have been growing in popularity quickly and at present may be considered as some of the most highly-demanded trading instruments. There are more than 1,500 cryptocurrencies in the worl

The indicator shows the Fibonaccia golden ratio levels and the price balance line Has three different sensitivity options Allows you to visually navigate what state the market is in and where trend reversals are possible Works on all timeframes, on any currency pairs, metals and cryptocurrencies Can be used when working with binary options Distinctive features Based on the golden Fibonacci value; Determines the balance line of price equilibrium Has three different sensitivity settings; Simple an
FREE

Super Channels indicator is a channel indicator created by calculating support and resistance levels. It calculates by taking the average of support and resistance levels. After determining the number of candles, it takes the levels of the number of candles and creates an autonomous channel according to these levels. If you want to calculate how many candles, you must enter the number in the parameter section. Also, there are two types of modes in the indicator. The first is to calculate based o
FREE
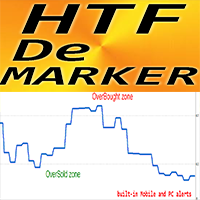
MT4 用 Forex インジケーター HTF DeMarker
このインジケーターは、テクニカル トレーダーがエントリー ポイントとエグジット ポイントを見つけるために使用する便利なツールです。HTF は、Higher Time Frame を意味します。 DeMarker オシレーター ラインは、以前の高値と安値に対する現在の価格位置を示します。 DeMarker は、他のオシレーターの中で最も効率的な定期的なダイバージェンス シグナルを提供します。 買われすぎゾーンは DeMarker が 0.7 を超える場合、売られすぎゾーンは 0.3 を下回る場合です。 インジケーターにはモバイルおよび PC アラートが組み込まれています。 このインジケーターは、プライス アクション エントリーを使用するマルチタイム フレーム トレーディング システム、または他のインジケーターとの組み合わせに最適です。 HTF DeMarker インジケーターを使用すると、より高い時間枠の DeMarker を現在のチャートに添付できます --> これはプロフェッショナルな取引アプローチです
//

The EA is optimized for the most conservative trading! Aggressive settings Attention!!!!! The EA is configured and does not require optimization, testing and trading strictly on XAUUSD. For a more aggressive trading method after the purchase, please contact your personal messages to get the settings!
Advisor monitoring
HOW TO CHECK: Select timeframe M5. Set your initial deposit at 1000. Use the every tick method Problems with the test? Write me
To open (close, reverse) positions, th
FREE

Metatrader 4 の R インサイド バー インジケーターは、インサイド バーに基づいた使いやすい価格ブレークアウト レベルを提供します。
これは純粋な価格アクションで機能し、再描画は一切行わず、メインの MT4 チャート ウィンドウに、実際のインサイド バーの上下に 2 本の色付きの水平線の形でポップアップ表示されます。
緑色の水平線はレジスタンスとして機能し、赤色の線はサポートとして機能します.
ロング&ショートトレードの考え方 ローソク足が緑色の内側バー ラインの上で閉じ、全体的なトレンドが上向きの場合は、買い注文を出します。 ローソク足が赤の内側のバー ラインより下で閉じ、全体的なトレンドが下向きの場合は、売り注文を出します。 R インサイド バー インジケーターは、すべての通貨ペア (メジャー、マイナー、エキゾチック) で同様に機能し、正しく使用すれば有望な結果を示します。
ヒント
お気に入りのトレード エントリ、ストップ ロス、テイク プロフィット メソッドを自由に使用して、R インサイド バー インジケーターと取引してください。
いつもの
FREE
BBMAGC BBMAGC is an automatic trading system with a work strategy obtained from famous BBMA indicator combine with advance grid system . This EA use dangerous trading systems like martingale and grid so please understand the risk before using this EA Time Frame: H1 Symbol: best result on EUR/USD, GBPUSD, GBPCAD VPS recommended 4/5 digit broker Min Deposit 1000$ Low spread always better Since you using Grid system, always trade using money that you are willing to lose. When you use an expert a

Identification of support and resistance areas
A useful indicator for traders
completely free
Can be used in all symbols
Can be used in all time frames
It has three different trends: short term, medium term, long term
Settings:
Clr1,2: You can change the color of the lines
Type Trend: You can determine the trend
Message me for questions, criticism and suggestions
FREE

Bollinger Bands Tunnel EA is a free expert advisor developed with the idea to be useful for traders who love to trade using the popular indicator Bollinger Bands. Bollinger Bands Tunnel EA has very simple trading logic. It trades inside of the Bollinger Bands indicator. When the price crosses the Bollinger Bands upper line and reverses, the EA opens a SELL position. When the price crosses the Bollinger Bands lower line and reverses then the EA opens a BUY position. The algorithm of closing the
FREE
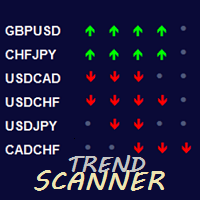
This product is based on the single indicator TREND MATE. Link: https://www.mql5.com/es/market/product/50082
The aim of this EA is to watch for all pairs in a single panel in order to have a quick view of changes or new uptrends/downtrends. It is possible to watch from your mobile by sending push notifications when changes appear. If you want to have all push notifications for even exit trends you may receive multiple messages.
FREE

Civetta Night Scalper is a night Scalper who trades at the beginning of the daily session when volatility is lower and spreads have now stabilized by monitoring price levels on various indicators. Once positions are opened and monitors them until they are closed with a profit if possible, or with a small loss.
Civetta Night Scalper does not use dangerous strategies such as martingale, average positions, expected loss, etc. Positions always have a Take Profit and a Stop Loss and can be ope
FREE

Indicador "Trade Zones: Supply and Demand Opportunities" para MetaTrader: Eleva tu Trading con Precisión Estratégica El indicador "Trade Zones: Supply and Demand Opportunities" es una herramienta revolucionaria diseñada para potenciar la toma de decisiones de los traders al identificar claramente las zonas de oportunidad basadas en los principios fundamentales de oferta y demanda. Este indicador, compatible con MetaTrader, proporciona una visión intuitiva de las áreas críticas del mercado donde
FREE
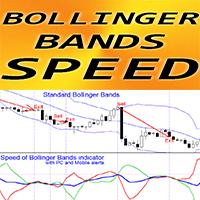
ボリンジャーバンドの速度 - ユニークなトレンドインジケーターです
このインジケーターの計算は、物理学の方程式に基づいています。 速度は、標準のボリンジャーバンドの 1 次導関数です ボリンジャーバンドの速度インジケーターは、BB 中間線と BB 境界が方向を変える速度を示します デフォルトでは、青い線は BB 中間線の速度、赤い線は下の境界の速度、緑の線は上の境界の速度です トレンド戦略では、BB 速度を使用することをお勧めします。BB 中間線の速度の値が 0 未満の場合: トレンドは下降し、値が 0 を超える場合: トレンドは上昇します 次の取引エントリを検討できます: 青い線が 0 より上で、緑の線が青い線を上向きに交差するときに、買い取引を開きます 青い線が 0 より下で、赤い線が青い線を下向きに交差するときに、売り取引を開きます インジケーターには、モバイルおよび PC アラートが組み込まれています。
// より優れたエキスパートアドバイザーとインジケーターは、こちらで入手できます: https://www.mql5.com/en/users/def1380/sel
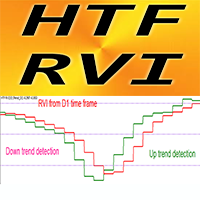
MT4 用 Forex インジケーター HTF RVI オシレーター、リペイントなし
MT4 用プロフェッショナル HTF RVI オシレーターで取引方法をアップグレードしましょう。HTF は、Higher Time Frame を意味します。RVI は、トレンドの変化を検出し、売られすぎ/買われすぎ領域からエントリーするのに最適なオシレーターの 1 つです。このインジケーターは、売られすぎ/買われすぎ領域からの価格アクション エントリーを備えたマルチタイム フレーム取引システムに最適です。 HTF RVI インジケーターを使用すると、Higher Time Frame の RVI を現在のチャートに添付できます --> これはプロフェッショナルな取引アプローチです。買われすぎ領域は 0.23 を超えています。売られすぎ領域は -0.23 を下回っています。 インジケーターには、モバイルおよび PC アラートが組み込まれています。
// より優れたエキスパート アドバイザーとインジケーターは、こちらで入手できます: https://www.mql5.com/en/users/
The Fractal LVL AM indicator analyzes the price patterns that form on the candlestick chart and display the turning points of the market trend. A fractal consists of candles, the middle of which is either the highest (upward fractal) or the lowest (downward fractal) of all the candles taken for analysis. Unlike the original indicator where fractals are formed by five candles (maximum/minimum in the center and two candles with smaller/larger maximum/minimum values on each side), the proposed ve
FREE

KF Trix V1.00 The triple exponential average (TRIX) indicator is an oscillator used to identify oversold and overbought markets and is also a momentum indicator. The triple smoothing of moving averages is designed to filter out price movements that are considered insignificant or unimportant. About Software details and MQL login link Copyright 2022, Forex KRAL
FREE

EMA Separation Coefficient reflects the separation between short-term and long-term exponential moving average trend resistance, as well as the direction of the current movement. Pay attention to potential crossover points when the coefficient approaches zero, this may indicate an upcoming breakout or reversal. Wait for confirmation of the trend before entering the trade, and exit when the coefficient forms a max (for calls) or a min (for puts). This is a small tool to help visualize the differe
FREE

| Fully-automated Smart Money Concept (ICT) inspired trading solution with multi-strategy capabilities | Built by a grid trader >> for grid traders. This is MT4 version, click here for Blue CARA MT5 (settings and logics are same in both versions) Real monitoring signal --> Cara Gold Intro Blue CARA EA ('CARA') - short for C omprehensive A lgorithmic R esponsive A dvisor is a next-gen multi-currency multi-timeframe EA base on the widely known (and perhapse most popular) Inn
Der Ichimoku EA handelt vollautomatisch
Du bekommst hier einen tollen EA mit extra Zubehör, Kostenlos !
Er verwendet keine gefährlichen Strategien wie Martingale oder Gritter usw. Bei diesem EA kannst du vieles nach deinen Wünschen, oder nach meinem Set einstellen. Zusätzlich hat er einen News Filter, er pausiert die trades während der eingestellten Zeit. Zusätzlich erhöht er auf Wunsch die lots Grösse automatisch.
Der Backtest und die trades wurden mit IC Markets gemacht Hebel 1:500 Zer
FREE

Xmasterインジケーターの新しいより正確なバージョン。最も効果的で正確な式を得るために、世界中の200以上のトレーダーが、PCでこのインジケーターのさまざまな組み合わせの15,000以上のテストを実施しました。そしてここでは、正確なシグナルを表示し、再ペイントしない「Xmasterフォーミュラインジケーター外国為替再ペイントなし」インジケーターを紹介します。このインジケーターはまた、電子メールとプッシュによってトレーダーにシグナルを送信します。新しいティックが到着するたびに、75以上のパラメーターで市場を常に分析し、トレーダーに正確な売買シグナルを示します。また、このインディケータの助けを借りて、正しい方向で取引を開始するためにトレンドが現在どの方向に進んでいるかを確認できます。 新しい「Xmasterフォーミュラインジケーターforexno repaint」インジケーターはどのように機能し、古いバージョンと何が違うのですか? まず第一に、それは世界中のさまざまなトレーダーによって15,000回以上テストされた最も最適化された市場分析アルゴリズムです。 第二に、このインジケーター
After purchasing, you can request and receive any two of my products for free!
После покупки вы можете запросить и получить два любых моих продукта бесплатно! A simple multicurrency Expert Advisor. The basis of the advisor, indicators: Bollinger Bands, Moving Average, RSI. Entry into a position is carried out following a trend on pullbacks by a signal. Default: H1 (GBPCHF, GBPUSD, EURUSD, EURJPY, EURGBP, GBPJPY, EURCAD, GBPCAD, CADJPY, USDJPY, USDCHF, EURCHF, USDCAD, NZDCAD, NZDJPY, EURAU
FREE

This Indicator does not repaint itself at all, it's identifies a new TREND in the bud, this indicator examines the volatility, volumes and momentum to identify the moment in which there is an explosion of one or more of these data and therefore the moment in which prices have strong probability of following a new TREND.
CandleBarColorate never misses a beat, he always identifies a new TREND in the bud without error. This indicator facilitates the reading of charts on METATRADER; on a single wi

Hello The expert works in oscillation areas The beginning is opening two hedge deals When a deal is closed at a profit Two other deals are opened With a difference in the contract size If it continues to work in one direction only Continues to open deals with the trend with the same size as the first contract And opens deals against the trend With a contract size multiple When the trend reverses Closes the winning deals with the first losing deal And continues to do so until they are all closed
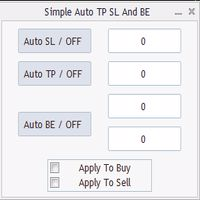
Program for automatic placement of stop loss and take profit orders. Values are calculated as points distance from open price. BreakEven option is also included. all options could be applied to BUY, SELL separately or together. Enter values in points in the fields on the right side of the menu and press dedicated button to aplly your settings.
If in doubt, The instruction is displayed in the tooltip.
FREE
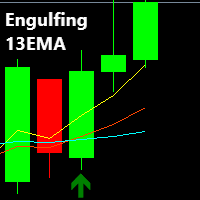
Description:
The Engulfing 13EMA is a Multi Timeframe Indicator that scans Multiple Symbols which will help you to identify potential trade set ups. As well as Forex, it can scan Crypto, Exotics, Metals, Indices, Energies or what ever else you have in your Market Watch list. You also have the option to enable/disable the time frames you want to scan. (M1,M5,M15,M30,H1,H4,D1,W1,MN1) All of these options are made possible from just ONE chart, from which the Indicator is attached
An alert is

In case you get Laguerre S crat indicator, you will get Laguerre Scrat Ea as a Gift. To get Ea and det a iled m anu al PDF contact me PM. Default settings are for usd/cad H4 For St able Long term Profits Laguerre Scrat is a trading system based on 4 indicator combinations in the shape of one indicator. Laguerre indicator (upgraded), CCI, Bollinger bands and market volatility factor. It generates arrows in the indicator window and nuts on the price chart, doubling arrows for a better view where

All about Smart Money Concepts Strategy: Market struture: internal or swing BOS, CHoCH; Orderblock; Liquity equal; Fair Value Gap with Consequent encroachment, Balanced price range; Level with Previous month, week, day level or in day level (PMH, PWH, PDH, HOD); BuySell Stops Liquidity (BSL, SSL); Liquidity Void Long Wicks; Premium and Discount; Candle pattern ... "Smart Money Concepts" ( SMC ) is a fairly new yet widely used term amongst price action traders looking to more accurately navigate

The EasyFX Trader is a very unique and customizable dashboard for manual trading. It is placed in the Expert folder but is not an auto trading robot. You input all the parameter and the dashboard will monitor and let you know when there is a good trading opportunity. The tool is simple to use whether you're experienced or just a beginner. It was designed for all types of trading styles including price action, day, swing, trend trader, or scalper. Each column is described below. When you load the

Product detailed post: https://www.mql5.com/en/blogs/post/756962
Get free demo from the link in above post.
Features: - Multi Heiken Parameters
- Alerts & Highlights for Heiken Switch
- Heiken Alignment Alerts
- Multi-timeframe Alignment Alerts
- Multi Currency
Heiken Explained: Heiken Settings: All comma separated lists will be used for different heiken ashi's. Example: 5,40,188 will mean that MAPeriod1 in 1st heiken will be 5; In 2nd heiken will be 40 and in 3rd heiken ashi will be 1

Introducing the HFT EA - your ultimate tool for passing Prop Firm challenges with confidence and efficiency. Be aware that price will increase after five purchased. Version 1.1 Now Available! Unlock your potential with the HFT EA, meticulously designed to not just meet, but exceed the requirements of HFT Prop Firm evaluations. Why Choose our EA? Profit with Precision: HFT EA swiftly achieves profit targets in a matter of days, sometimes even within a single trading session. Specially at News, o

## My Dream: Creating a Stable Hedge Robot
"This EA is based on a logic that suddenly came to me before going to bed yesterday. I hurriedly took out my PC and created it so I wouldn't forget it."
It has long been my dream to develop a stable hedge robot. However, despite years of effort, I have struggled to achieve consistent success. Hedge logic is inherently complex, and increasing the number of open positions often leads to larger drawdowns.
To address this challenge, I devised a ne

Obtain Funding Darwinex Un asesor experto diseñado para cuentas de Darwinex teniendo en cuenta sus reglas de drop y apalancamiento 1:10 .Diseñado especielmente para la gestión de activos de divisas.
Especializado para divisas en el eur usd por el bajo spread recomendación de métrica H1 Darwinex es una excelente plataforma y hemos creado este robot para trabajar expresamente con ella. Este robot de trading de Forex ha sido desarrollado por MRBEAST como una herramienta para facilitar el trading
Biwavelet is an indicator for harmonic forecast of the market based on one-dimensional wavelet transform functions. Wavelet transforms are one of the main tools of digital algorithmic trading. This is due to their ability to analyze and predict processes occurring in two independent basic dimensions - price and time. Wavelets have significant advantages over the Fourier transform, because wavelet transform allows evaluating not only the frequency spectrum of the price signal, but also the time a

The indicator displays the following elements: Supply Zones, Demand Zones, Fair Value Gaps and sends alerts when a supply or demand zone is reached. The zone timeframe is set independently of the chart timeframe. For example, it is possible to set M5 zones on an H4 chart. The importance of zones can be adjusted using the zone strength parameter. Demand zones are displayed if at least one candle in the range of the zone is entirely above the zone. Similarly, supply zones are displayed if at least

Catarina Devon is an EA that automatically opens orders based on any indicator. You just need to input the name of the indicator, Buy ID, Sell ID, and Catarina Devon will not miss any signals from your indicator. Features of the EA: Opens Buy-Sell orders according to the indicator Trailing Closes orders when there is a reverse signal Closes orders based on achieved profit conditions

A utility to close all orders automatically when conditions meet.
Various options are available to filter or select orders : Conditions : Closing conditions. 3 different conditions can be defined. EA will close orders anytime one or more defined conditions meet. Conditions can be defined based on account properties or selected orders properties. Also a fixed time to close orders is available.
Type of orders : Buy / Sell / Buy Limit / Sell Limit / Buy Stop / Sell Stop Symbol Selection : All /

Imbalance / Fair Value Gap (FVG), this is a zone / gap created when the price move with force in a given direction. It identify a zone where the price could potentially go back. This gives perfect targets for your trades.
Imbalance is created from the high and low of 3 candles. When the wicks the of 1st and 3rd candle does not fully overlap the middle one.
This indicator will help you to easily spot mitigated/unmitigated imbalances in your chart.
NEW FEATURE Update: Multi-TimeFrame Feat
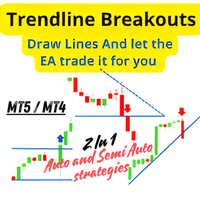
Trendline Breakouts is a semi-automatic expert advisor, which means you only need to draw the support and resistance lines, and then let the expert advisor handle the trading for you. You can use this expert for every market and time frame. Backtesting is not available because this is a semi-automatic EA. You draw the trendlines and let the expert trade for you. This expert enables you to automatically trade breakouts of both horizontal support and resistance and trendlines, unlike the traditi

after getting indic ator cont act me for Bonus E a. Non Repaint TMA channel with special conditioned arrows on price cross of channel lines plus market Volatility factor, which makes product much more accurate than any usual tma channel indicators. It is proven to be profitable with Ea built based on it which you will get as a BONUS in case of indicator purchase. Good luck.

The indicator determines the trend and its direction. At the same time, it shows
the oversold and overbought zones. Thus, it determines the most profitable
places to open a position. The indicator can be used as a filter and complement
to any strategy. It can also be used as an independent tool.
Advantages
The indicator does not redraw the values. Works on all available tools. Works on all periods. It has a minimum of settings. The ability to use it as a primary and auxiliary indicato

It's a triangular arbitrage system (three pairs correlation system) to use 3 currencies to make 3 pairs to open hedge orders on those.
The expert starts opening six orders for each ring (3 plus and 3 minus) and waits to move prices in one direction to make a grid of orders.
The expert can use a maximum of 8 currencies to make 28 pairs and make 56 rings.
It is important the order of currencies is from the strongest to the weakest.
Strongest... EUR/GBP/AUD/NZD/USD/CAD/CHF/JPY ...weakest.
FREE

The Pearson Trend!! My name is Murat Yazici. I have B.Sc. Statistics and M.Sc. Quantitative Methods degrees. I have several scientific papers, conference presentations in Texas, Toronto, London, Istanbul, books and book chapters studies, and many projects about mathematical and statistical modelling. I am also journal reviewer at some scientific journals.
What is The Pearson Trend's Logic? It is based on A Fuzzy Model developed by me. Vague or fuzzy data and application several fields,

The Awesome Oscillator (AO) Signal Candle Indicator is an indicator used to measure market momentum. Awesome Oscillator (AO) Signal Candle Indicator will change bar's color when set overbought or oversold levels reach. Colored Candles, based on Awesome Oscillator (AO) Signal.
-If the indicator is above zero, the market is bullish. -If the indicator is below zero, the market is bearish. -If the market is bullish, you can take a stand with green candle signals. -If the market is bearish,
FREE

Expert description
Algorithm optimized for Nasdaq trading The Expert Advisor is based on the constant maintenance of long positions with daily profit taking, if there is any, and temporary interruption of work during the implementation of prolonged corrections The Expert Advisor's trading principle is based on the historical volatility of the traded asset. The values of the Correction Size (InpMaxMinusForMarginCallShort) and Maximum Fall (InpMaxMinusForMarginCallLong) are set manually.
Recom
FREE

Introduction
News is basic requirement for trading now a days. Due to its biased impact on the market a trader should be proactive to deal such scenarios before they arises. In this news alert indicator you have multi currency option to scan news for different pairs and notify you on Telegram, email, mobile push notification and chart alert. You can turn on/off any of the alert you need. It has two different option one is alerting you X min (user input) before the news and second is alerting yo

The indicator helps you trade following the VSA (Volume Spread Analysis) and PRICE ACTION methods, as well as study these methods from a perspective. The indicator searches for VSA and PRICE ACTION patterns considering the current trend. It is possible to view the patterns of the higher timeframe on the current timeframe chart. The custom mode allows you to find your patterns based on VSA method. Also, there is a volume histogram that automatically configures the width and visual horizontal leve

uGenesys AI - 90% Accurate Daytrading Indicator
Introducing the ultimate forex trading indicator system, uGenesys AI, powered by cutting-edge AI technology and advanced analytical techniques, including Time-Series Analysis and Genetic Algorithms. Our AI-powered trading system leverages the power of time-series analysis to identify trends and patterns in historical price data, allowing traders to make informed predictions about future market movements. By analyzing vast amounts of data, our sys
This is a panel EA for one-click trading.
Demo version | User manual | Contact me for any questions / ideas for improvement / in case of a bug found
List of main functions
Risk management Calculate the lot size by X dollars(currency of deposit) and stop loss.
Calculate the lot size by percent of equity and stop loss. Calculate lot size by equity percent (free margin percent). Calculate lot size by specified lot for each X dollars(currency of deposit) of balance.
Positions and o

This strategy is best used for Trend based trading. While market is trending, price still makes smaller ranges. Darvas boxes show breakouts from these small ranges, while still following the original market trend. Detailed Description: https://www.mql5.com/en/blogs/post/747919
Features:
Darvas - Check Darvas Box Breakout
- Check Price Above/Below MA or Darvas Box has crossed MA
- Min, Max Box Height
- Max Distance Between Entry Price and Darvas Box
Other Indicators:
- NRTR Tren
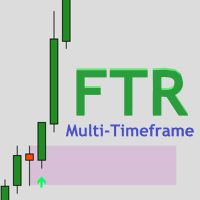
The FTR Multi-Timeframe indicator is a versatile tool that can add great value to your trading arsenal. This indicator is intended to be used to add confluence to your already existing trading strategy, such as, breakout & retest, supply and demand, patterns or continuation trading. FTR Multi-Timeframe is a continuation indicator. Rules are attached as a screenshot.
Settings for Demo/Strategy Tester: Set Server_Time_Filter to false in indicator settings ( IMPORTANT! ). Tick 'Show object desc
MetaTraderマーケットはトレーダーのための自動売買ロボットやテクニカル指標を備えており、 ターミナルから直接利用することができます。
MQL5.community支払いシステムはMetaTraderサービス上のトランザクションのためにMQL5.comサイトに登録したすべてのユーザーに利用可能です。WebMoney、PayPal または銀行カードを使っての入金や出金が可能です。
取引の機会を逃しています。
- 無料取引アプリ
- 8千を超えるシグナルをコピー
- 金融ニュースで金融マーケットを探索
新規登録
ログイン