Guarda i video tutorial del Market su YouTube
Come acquistare un Robot di Trading o un indicatore
Esegui il tuo EA
hosting virtuale
hosting virtuale
Prova un indicatore/robot di trading prima di acquistarlo
Vuoi guadagnare nel Market?
Come presentare un prodotto per venderlo con successo
Expert Advisors e Indicatori per MetaTrader 4 - 45

WindFlow HTF is a useful tool suited to use in conjunction together with my WindFlow indicator. This indicator will give you a background vision about the price action trend on a higher timeframe, so when it runs with the WindFlow indicator you have an almost complete trading solution. At this point, you only need some support/resistance analysis and a bit of focus to become a consistent trader.
The metaphorical "wind's ballet" Professional traders know that every timeframe is governed by its o
FREE

This scanner is monitoring the entire market for trade opportunities for all symbols and for all time frames. You don't have to look to all the charts, for all symbols and for all time frames. This scanner will alert you on your computer, or on your mobile, when a trade opportunity has been found. You never have to miss a trade opportunity! This indicator is designed to scan all pairs and symbols, for all time frames, to find a cross of the MACD main and signal line. MACD Definition
The
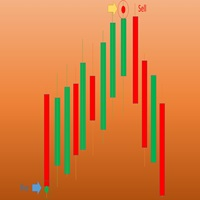
Wave Entry Alerts Oil is a custom indicator developed by Azad Gorgis for MetaTrader 4. This indicator is designed to provide alerts based on ZigZag patterns, specifically tailored for trading on the Oil (XIT/USD) symbol.
Key Features: - Chart Window Indicator: The indicator is designed to be displayed on the main chart window. - Arrow Signals: The indicator generates arrow signals on the chart, indicating potential reversal points based on ZigZag patterns. - Customizable Parameters: Traders ca
FREE

Diversify the risk in your trading account by combining our Expert Advisors. Build your own custom trading system here: Simple Forex Trading Strategies
The expert advisor opens trades when the SMA and RSI are aligned in the same direction and when the Stochastic has left overbought/oversold areas. The 5 and 10 SMA are also programmed to close the trades if the trend changes. The Stop Loss, Take Profit, and Trailing Stop are calculated based on the ATR indicator. The recommended currency pair
FREE

This indicator calculates gann support and resistance prices with use gann pyramid formulation and draw them on the chart. And If you want, Indicator can alert you when the current price arrive these pivot levels. Alert Options: Send Mobil Message, Send E-mail, Show Message and Sound Alert Levels: S1, S2, S3, S4, S5, R1, R2, R3, R4, R5 Inputs: GannInputPrice: Input price for gann pyramid formulation. GannInputDigit: How many digit do you want to use for calculation formula. (The number and the
FREE

ATR Pyramid ️: Il tuo biglietto per accumulare profitti più alti di una torre di Jenga sotto steroidi , trasformando la volatilità del mercato in una festa di surf sulle tendenze ️ e di aggiunta di posizioni , dove solo il primo trade rischia un wipeout , mentre proteggi il resto facendo scorrere il tuo stop loss verso l'alto come un ascensore , creando una zona di comfort che è l'unica vera via per moltiplicare il tuo conto forex più velocemente di un coniglio sotto espresso!!!
FREE
Vertical Lines for Hour - Time-Based Trading Indicator The Vertical Lines for Hour indicator allows you to mark up to 4 vertical lines at specific times on your chart. Simply enter the hour without considering the minutes, and you can also choose the color for each line. This indicator is useful for identifying session ranges or implementing custom trading strategies. It provides a straightforward solution for your trading needs. Key Features: Mark up to 4 vertical lines at specified times. Sele
FREE

The SFT Fibo Smart Pivot indicator is a powerful trading tool based on the Fibonacci Golden Ratio, designed to identify key support and resistance levels in the forex market. This indicator has the ability to pinpoint significant price levels that can serve as entry and exit points for trades. It enables traders to analyze the market more effectively and make well-informed decisions. The indicator uses the Fibonacci Golden Ratio to accurately determine support and resistance levels. These levels
FREE
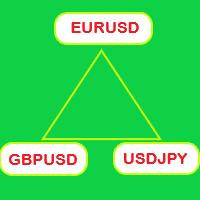
List of buttons to switch between symbols on multiple charts 1. Set x, y coordinates (horizontal, vertical) for list of buttons. 2. Show/hide buttons by clicking button or keypress. 3. The number of columns of the button list. 4. The color of the buttons and the color of the current symbol button. 5. The button list is separated by commas. If the list is empty, the indicator takes the list of symbols in the Market Watch. 6. Set the keypress to show and hide the list of buttons. 7. Multiple Char
FREE

Candlestick Oscillator is a truly unique Oscillator that uses the concepts of within candlestick trading called the Record Session High. This is a method of analysing candlesticks to gauge when a trend might be wearing out and therefore ready for reversal or pause. We call it a record session high when we get 8 or more previous candles that have higher closes. We call it a record session low when we get 8 or more previous candles that have lower closes.
We don't rely on the typical Oscillation
FREE

The Magic LWMA indicator is of great help in determining trend direction. It can be an excellent addition to your existing strategy or the basis of a new one. We humans can make better decisions when we see better visually. So we designed it to show a different color for rising and falling trends. Everyone can customize this in the way that suits them best. By setting the Trend Period, we can optimize it for longer or shorter trends for our strategy. It is great for all time frames.
IF YOU NEE
FREE

The Magic EMA indicator is of great help in determining trend direction. It can be an excellent addition to your existing strategy or the basis of a new one. We humans can make better decisions when we see better visually. So we designed it to show a different color for rising and falling trends. Everyone can customize this in the way that suits them best. By setting the Trend Period, we can optimize it for longer or shorter trends for our strategy. It is great for all time frames.
IF YOU NEED
FREE

This Indicator is based on Mr. Dan Valcu ideas.
Bodies of candles(open-close) are the main component used to indicate and assess trend direction, strength, and reversals.
The indicator measures difference between Heikin Ashi close and open.
Measuring the height of candle bodies leads to extreme values that point to trend slowdowns. Thus quantifies Heikin Ashi to get earlier signals.
I used this indicator on Heiken Ashi charts but, it's possible to choose to calculate Body size based on Heik
FREE
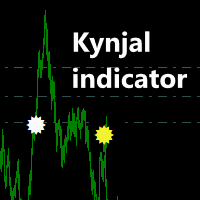
Kynjal indicator
Welcome back!
- Kynjal indicator was specially created for the M15 – M5 time frames and for the EURCAD currency pair.
- Indicator does not repaint.
- The white circle represents the signal to buy. - The yellow circle indicates the signal to sell.
Example
The attached video shows the results of testing this indicator for the period January 1, 2024 – November 17, 2024.
Without Stop Loss and with TP =10 pips, Kynjal indicator did very well. The initial deposit was $500 and
FREE

BuySell Volume is an indicator that approximates Buy and Sell volumes based on price movement. Input Description: applied_model: Choose the applied model. In low reversal mode, price is considered receive low bearish pressure during bullish candle's creation (high bearish pressure on high reversal model. In other words, Bullish Marubozu candles has really high Buy Volumes in low reversal model than in high reversal one.
Output Description: Buy and Sell Volume: Determines how many Buy and Sell vo
FREE

Per favore lascia una valutazione di 5 stelle se ti piace questo strumento gratuito! Grazie mille :) La collezione Expert Advisor "Risk Management Assistant" è una suite completa di strumenti progettati per migliorare le strategie di trading gestendo efficacemente il rischio in varie condizioni di mercato. Questa raccolta comprende tre componenti chiave: consulenti esperti di media, commutazione e copertura, ciascuno dei quali offre vantaggi distinti su misura per diversi scenari di trading.
Q
FREE

Live Pivots Indicator Time Frame: Suitable for any time frame. but recommended time frame 30M and above. Purpose of this indicator: Trend Prediction. Buy: When the candle crossed above the golden pivot line its buy call, TP1-R1, TP2-R2, TP3-R3. SELL: When the candle crossed Below the golden pivot line its sell call, TP1-S1, TP2-S2, TP3-S3. Happy trade....
FREE

Indicatore Slope Channel per MetaTrader
Stai cercando uno strumento per analizzare le tendenze di mercato adatto a qualsiasi stile di trading? Slope Channel – il tuo assistente affidabile per identificare i movimenti dei prezzi e i livelli chiave del mercato! Cos'è Slope Channel? Slope Channel è un indicatore innovativo che costruisce un canale inclinato sul grafico, calcolando automaticamente i suoi parametri in base agli estremi locali. Questo strumento evidenzia l'opzione di canale ot
FREE

Simple indicator that shows external ( outside ) bars. In certain cases, external bars can be seen as strong trend bars instead of range bars. This can be observed when a with-trend external bar occurs at a reversal from a strong trend. It will help you notice more easily different patterns like - Inside-outside-inside, Inside- Inside -inside, outside - Inside -outside, etc. Works perfectly with my other free indicators Internal bar and Shadows
Inputs: How many history bars to calculate on loa
FREE

Variable Index Dynamic Average (VIDYA) developed by Tushar Chande by default is contained in MT5 but not in MT4 platform and it is a dynamic EMA (Exponential Moving Average) that adjusts its Length (LB Period) automatically in response to Market Volatility originally measured through the Chande Momentum Oscillator(CMO). CMO value is used as the ratio to the smoothing factor of EMA ( The New Technical Trader by Tushar Chande and Stanley Kroll, John Wiley and Sons, New York, 1994). The higher th
FREE

The Keltner Channel indicator represents a channel along the moving average , with the width defined by calculating the average true range on the period of the moving average. This indicator can be applied for receiving signals, as well as a substitute for the Moving Average Envelopes indicator. Its advantage is the increased quality of channel width auto selection, which can be adjusted using the Size of channel in percent parameter.
Indicator Parameters Period of indicator - calculation perio
FREE

YOU CAN NOW DOWNLOAD FREE VERSIONS OF OUR PAID INDICATORS . IT'S OUR WAY OF GIVING BACK TO THE COMMUNITY ! >>> GO HERE TO DOWNLOAD
Camarilla Pivots Historical plots the historical data of the camarilla pivot point levels on the chart. The Camarilla Pivot levels was originated in 1989 by Nick Scott. The levels are used as primary support and resistance levels by Intraday traders. The levels are calculated with the following formula: R4 = C + RANGE * 1.1/2 R3 = C + RANGE * 1.1/4 R2 = C + RANG
FREE

PLEASE HELP REVIEW/ SUPPORT/ SHARE THIS OTHER INDICATOR HERE https://www.mql5.com/en/market/product/51637 AS YOU DOWNLOAD THIS ONE FOR FREE. THANKS.
A. This pivot indicator shows the days Pivot Price. Yellow line is pivot point. Blue line is resistance and red line is support. B. It also shows Resistance R0.5, R1, R1.5, R2, R2.5, and R3 C.It also shows support S0.5, S1, S1.5, S2, S2.5, and S3 INPUT: Under input you will see 3 Variables 1.ExtFomula. Here you can set your preferred exit at a
FREE
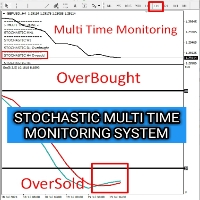
I’m thrilled to present the Stochastic Indicator, designed for multi-time frame monitoring! This tool allows you to effortlessly track Overbought and Oversold conditions in real-time, all on a single screen. My goal is for this indicator to support you in your analysis and help you capture those perfect trading moments using your own strategies. If you find this indicator helpful, I’d greatly appreciate your support by liking my channel and giving it a 5-star rating! Your feedback inspires me to
FREE

This indicator works by plotting fractals on the chart as arrows that can be used as buy or sell signals. It is a great tool for both new and experienced traders as it provides a clear visual representation of the market and helps traders identify fractals. Although it repaints, it can be used quite effectively in conjunction with other tools to filter trading strategies.
We use this indicator in this way in our RoyalFractals II Expert Advisor, which you can purchase on the MQL5 Market: https:
FREE

Indicator draws Round Number lines by distance of pips. 1. You can enable / disable indicator to show / hide the lines. 2. You can set distance of pips between the lines. 3. You can edit the number of lines. 4. You can edit properties of lines by inputs (style (DASH, DOT, SOLID, ...) , width (1 for DASH, DOT, 2 is not for DASH, DOT, it only SOLID), color). When indicator is deleted from the chart, the lines will be removed.
FREE

The Green Dragon is a strategy that uses the Ichimoku Kinko Hyo system to place trades. The primary element of the Green Dragon is the use of the Chinkou Span as it crosses price action to place trades. This is a classic strategy of the Ichimoku even though its not as popular as some of the other strategies. The Chinkou Span is normally thought of as a market momentum indicator and used to give a trade set up more conviction when analyzing price movement. I find this description somewhat vague a
FREE

This Expert Advisor analyzes the last candles and determines whether there will be a reversal or a large correction. Also, the readings of some indicators are analyzed (their parameters can be adjusted). Is a free version of Proftrader . Unlike the full version, in the free version of the adviser the initial lot cannot be higher than 0.1, trading pair only EURUSD and also it has fewer configurable parameters. Input parameters
Lots - lot size (at 0, the lot will be calculated from the percentage
FREE
This indicator displays signals on the price chart based on the data of the classic indicator - the Money Flow Index (MFI). The volume is taken into account when calculating the MFI values. MFI can be used to determine overbought or oversold zones in the market. This indicator allows you to display three types of signals on the price chart: MFI exit from the overbought or oversold zone; MFI entry into the overbought or oversold zone; MFI crossing the middle between the overbought and oversold zo
FREE

How it Works When the EA is active, it analyzes the chart based on the Execution Mode parameter. No existing positions on the chart: If the trend is bullish, the EA enters a buy trade. If bearish, it enters a sell trade. Existing positions with the last one in loss: The EA checks if the distance between the current market price and the order meets the minimum distance set by the user. It enters a trade based on the candle, calculates the lot size using the martingale method. EA Parameters Execut

The Trade Grid bot simplifies trading by executing multiple orders with a single click, as specified by the user. These orders are initiated instantly using the EA buttons on the chart and can be closed simultaneously using the close button also located on the chart. Additionally, Trade Grid efficiently manages trades by automatically closing them once they reach a predefined profit or loss threshold.
FREE

Данный советник предназначен для контроля просадки по символу, на который он установлен. В работу советник вступает когда открыта позиция тем объемом (лотом), который указан в настройках советника. Советник не осуществляет торговых операций по открытию позиций, только закрытие открытых позиций по символу, на который он установлен при соблюдении определенных условий! В советнике реализовано три уровня работы. Каждый уровень привязан к конкретному магическому номеру. В настройках советника необхо
FREE
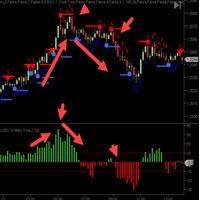
The C ycleTraderPro Close Strength Value Indicator measures the distance from the OPEN of a new bar to the CLOSE of that bar. Input - length = 10 default We add these values together going back the the length setting. If the 1st bar was plus 10 ticks and then the next bar was minus 7 ticks, then this would register +3
There are 2 ways to trade Close Strength Value: 1. Trading in the direction of lower highs and lower lows and vice versa for buys, higher highs, and higher lows. 2. Trade when the
FREE

please leave 5 stars to me A support level is a level where the price tends to find support as it falls. This means that the price is more likely to "bounce" off this level rather than break through it. However, once the price has breached this level, by an amount exceeding some noise, it is likely to continue falling until meeting another support level. A resistance level is the opposite of a support level. It is where the price tends to find resistance as it rises. Again, this means t
FREE

I will support only my client. สำหรับลูกค้า Win Sniper Follow is a fully automated Expert Advisor with no use of martingale. Night scalping strategy. The RSI indicator and an ATR-based filter are used for entries. Real operation monitoring as well as my other products can be found here : https://www.mql5.com/en/users/winwifi/ General Recommendations The minimum deposit is 100 USD, the recommended timeframe is M15, H1, H4. Use a broker with good execution and with a spread of 2-5 points. A ver

The purpose of this new version of the MT4 standard indicator provided in your platform is to display in a sub-window multiple timeframes of the same indicator. See the example shown in the picture below. But the display isn’t like a simple MTF indicator. This is the real display of the indicator on its timeframe. Here's the options available in the FFx indicator: Select the timeframes to be displayed (M1 to Monthly) Define the width (number of bars) for each timeframe box Alert pop up/sound/ema
FREE

Классическая Торговая стратегия возврата к среднему после сильного импульсного движения.
Файлы настроек + Тесты для всех покупателей в закрытой группе!
Мы имеем:
1-Индикатор Standard Deviation переводится как среднеквадратичное отклонение – математический термин, описывающий показатель рассеивания (дисперсии) значений случайной величины. Она полностью идентична расчету среднеквадратичного отклонения, определяемого относительно периода n как квадратичная разница текущей цены закрытия свечи Cl
FREE

Our team has finally achieved the expected result.
We have created artificial intelligence for binary options trading. Don't believe? Many users have already rated it positively. The results will surprise you too. This indicator broadcasts signals for a binary option through a telegram channel. All signals are reliable and of high quality.
Read more !!! ATTENTION !!!
You didn't dream !!! HOW TO EARN RIGHT NOW? The most successful signal channel for binary options Students, ho
FREE

The EU_15_111517128_S_Op_CF_SQ3 is an algorithmic trading strategy for MetaTrader, tested on EURUSD using the M15 timeframe from April 1, 2004, to April 24, 2024. There is no need to set up parameters, all settings are already optimized and fine-tuned.
Recommended broker RoboForex because of EET timezone.
You can find the strategy source code for StrategyQuant at the link: https://quantmonitor.net/eurusd-bollinger-bands-breaker/
Key details are:
Main Chart: Current symbol and timeframe
FREE

There are many candlestick patterns but only a few are actually worth knowing. Candlestick Pattern Filter detects and marks the most reliable candlestick patterns. Remember that these patterns are only useful when you understand what is happening in each pattern. They should be combined with other forms of technical analysis for best result. These patterns are included: Hammer / Hanging Man Inverted Hammer / Shooting Star Bullish / Bearish Engulfing Piercing Line / Dark Cloud Cover Morning Star
FREE
Индикатор предназначен для разметки ,фибо уровней и фибо зон.Также есть возможность удаления и редактирования уровней на текущем графике. При установке нескольких индикаторов (FIBO-ZONES)на график,не забывайте менять имя в поле (NAME).В утилите также есть возможность менять цвет зон, толщину линий и стиль линий уровней фибо. При установке индикатора ,зоны выстраиваются автоматически.
FREE

When prices breakout resistance levels are combined with Larry Williams' Percentage Range "WPR" oscillator breaks out its historical resistance levels then probability emerges to record farther prices. It's strongly encouraged to confirm price breakout with oscillator breakout since they have comparable effects to price breaking support and resistance levels; surely, short trades will have the same perception. Concept is based on find swing levels which based on number of bars by each side
FREE

The robot was created based on CCI (Commodity Channel Index) logic, and it is a very stable Expert Advisor (EA). It is optimized for XAUUSD (gold) by default, but you can run it on any currency pairs. Take Profit : 10 pips Stop Loss : 90 pips Grid Order : Every 5 pips All orders are closed when the total profit in dollars reaches a certain amount or when each individual order hits its take profit.
FREE

The Bullish and Bearish Engulfing Pattern Screener for MetaTrader 4 is a powerful tool designed for traders looking to identify key reversal patterns in the financial markets. This indicator scans price charts for bullish and bearish engulfing patterns, which signal potential trend reversals. Key Features: Real-time Scanning : Continuously analyzes price data to provide instant alerts when engulfing patterns are detected. Customizable Settings : Allows users to adjust parameters to fit their tra
FREE

The Direction Line indicator shows you if the current market is in a up trend or uf ut's in a down trend. The sensitivity of the trend calculation ist customizable. You can adjust it till it fit's your strategy. Even as a beginner is this indicator easy to use and you'll see every trend.
Key Features of Direction Line Real-time trend calculations of all time frames Graphical Interface Identical calculation for all time frames Customizable trend sensivity No repainting
Settings / Inputs
Sensit
FREE

EA Quantum La – Trading advisor based on the RSI and Bollinger Bands indicators, using pending orders and virtual orders, supported by a neural network. ️ Join our Telegram channel and get a powerful package of gifts that will make your trading even more successful: ️Our Telegram channel ️ t.me/EAQuantumLab
3 unique indicators - accurate market analysis in your hands.
Trading panel - convenient management of all trades.
Expert Advisor - your reliable assistant in

EA SCALPER GHOST PRO
This is single Entry type EA. It use smart alghoritme to detect market movement. It also use Stop loss and take profit . EA will not use any dangerous system like martingale, grid, averaging etc which can cause account blown in a second Tis EA use More than one pair to reduce risk. Right now im using 13 pair at the same time PROMO SALE PRICE Only $99 For first 10 copies!! 4 copies left Next Price will be ====>> $xxxx UP
RAMADHAN KAREEM PROMO ONLY $55 FOR LIFE TIME.. GRAB
FREE
Copiatrice->Interazione dell'interfaccia comoda e veloce, gli utenti possono utilizzarla subito ->>>> Si consiglia di utilizzarlo su computer Windows o VPS Windows Funzioni di base: La velocità di interazione normale del copy trading è inferiore a 0,5 s Rileva automaticamente le sorgenti del segnale e visualizza un elenco degli account delle sorgenti del segnale Abbinamento automatico dei simboli, il 95% dei simboli di trading comunemente utilizzati su diverse piattaforme (casi speciali co
FREE

BolingCustom is a Trend indicator designed for all Time frames and all currency pairs. For a better experience, it is recommended to use in time frames above 15 minutes.
Due to its understandable and simple presentation on the chart, even beginners can easily learn how to use it.
If you have any problems or questions, let us know. We will be happy to contact you: Direct massage
How this indicator works is that it shows the trend using a combination of several indicators such as the Bolling
FREE

"Upgrade to the Next Level of Trading with the Vondereich v1.3 Expert Advisor" "Take your trading to the next level with the upgraded version of the Vondereich v1.3 Expert Advisor. This cutting-edge EA features a wealth of advanced features, including: Auto compounding by percentage Customizable trading time frame RSI indicator integration Semi-hedging (Auto) system and more This EA uses a martingale strategy with a customizable pipstep to ensure the safety of your margin. By adjusting the pips
FREE

Auto TP SL Manul Open Panding Orders Overview:
AUto TP SL Manul Open Panding Orders is an innovative trading platform designed to enhance trading efficiency and effectiveness in managing financial investments. Key Features: Automated Management : Seamlessly manage take-profit (TP) and stop-loss (SL) orders with our advanced automation tools. Manual Adjustments : Maintain control with manual options, allowing traders to adjust orders according to market conditions.
FREE
Hello friends. I wrote this utility specifically for use in my profile with a large number of Expert Advisors and sets ("Joint_profiles_from_grid_sets" https://www.mql5.com/en/blogs/post/747929 ). Now, in order to limit losses on the account, there is no need to change the "Close_positions_at_percentage_of_loss" parameter on each chart. Just open one additional chart, attach this utility and set the desired percentage for closing all trades on the account. The utility has the following function
FREE
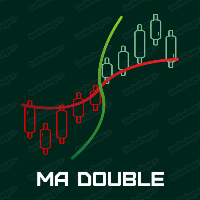
A ROBOT ON TWO MOVING AVERAGES! This Expert Advisor will allow you to trade (make trades) automatically using TWO moving averages. I also posted the robot on One moving average, you can also get acquainted with it.
Input parameters:
1. Lot 2. Stop Loss 3. Take Profit Well... everything is simple here)) 4. The Magic Number
The magic number of the orders.
In order for the adviser not to confuse market odrers with his own.
You can enter "0".
5. Maximum spread The maximum allowable Spread (slip
FREE

SmartDataExportEa – Il tuo strumento definitivo per l’esportazione di dati su MetaTrader 4
Descrizione EA SmartDataExportEaMT4 è uno strumento dedicato all’esportazione dei dati per MetaTrader 4. Questo EA non effettua operazioni di trading, ma si specializza nell’esportare i dati di mercato e i valori degli indicatori principali in formato CSV. È ideale per i trader e gli sviluppatori che desiderano rendere più efficienti le proprie analisi e lo sviluppo di strategie.
Compatibilità con l’ana
FREE

One-Click Close: Efficient Trade Management Tool Product Description One-Click Close is a powerful and user-friendly trading assistant designed to enhance your trading efficiency on the MetaTrader platform. With a simple and intuitive interface, you can quickly manage all positions and easily respond to market changes. Key Features One-Click Close Long Positions : Instantly close all long positions. One-Click Close Short Positions : Quickly close all short positions. One-Click Close All Positio
FREE

Necessary for traders: tools and indicators Waves automatically calculate indicators, channel trend trading Perfect trend-wave automatic calculation channel calculation , MT4 Perfect trend-wave automatic calculation channel calculation , MT5 Local Trading copying Easy And Fast Copy , MT4 Easy And Fast Copy , MT5 Local Trading copying For DEMO Easy And Fast Copy , MT4 DEMO Easy And Fast Copy , MT5 DEMO Fibo: from KTrade 1. Automatically calculate and analyze the band. -> Get the desired band 2.
FREE

このEAは、NinjaPlatformの無料のサンプル版です。
まず、 NinjaPlatformの説明をします。 NinjaPlatformは、お客様が自由にソースコードをいじって勝てる売買ロジックを構築できるEAのプラットフームです。 次のように思っておられる客様は、是非 NinjaPlatform をご検討下さい。
投資はギャンブルであるので、やるなら大きく勝ちたい。 勝つ自動売買プログラムを自分で創ってみたい。 勝つための理論や手法を学びたい。 お客様が勝てる売買ロジックを構築するために、 NinjaPlatformがサポート出来る事は、以下です。 1.豊富な売買ロジックやひな型が準備してある。お客様は、それらを簡単に微調整・変更・新規作成できる。 具体的には、 オープンロジックとして、一目均衡表/HULL移動平均/MACD/ AlligatorTrend/RCI/RCI_3line/STO/RSI/DMI/ Accelerator/ ボリジャーバンド/PIVOT/ ParabolicSAR/疑似グランビルの法則/疑似SinglePenetrationなどを用いた、1
FREE
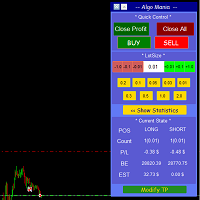
This is a trade manager specially for traders using martingale strategy and multiple trades at the same chart.
features: - easy and fast to set the lot size with mouse clicks. - Close all trades and close profit trades with a single click. - Show details on the running symbol: - number of trades (long - short) and total lots of each direction. - total profit/loss on this symbol separately and for both directions. - Break even point for both long and short. - Estimated profit if all the trades
FREE

本指标是根据黄金分割理论,分别获取过去22(默认)根K线高低价,并通过黄金分割系数计算得出支撑、压力曲线。 当价格第一次向上靠近压力线,或者多次靠近压力线时,会出现向下的箭头符合,提示有压力,适宜做空sell; 当价格第一次向下靠近支撑线,或者多次靠近支撑线时,会出现向上的箭头符合,提示有支撑,适宜做多buy; 在数据窗口,会提示各条支撑、压力线的价格数值,出现的箭头符合数值为up、down。
这个指标,适合在所挂的图表里做短线,也即进场开仓后,持仓几根K线柱,然后可以平仓。做多的话,止损可以在支撑线下方,止盈在压力线附近。做空的话,止损可以在压力线上方,止盈在支撑线附近。
本指标涉及的黄金分割系数分别为0.382、0.618、1.618、2.168、4.236,计算得到对应的支撑压力线。 由于MT4的指标数量有限,本指标分成了2个EX4文件,第一个的黄金分割系数为0.382、0.618、1.618,第二个为2.168、4.236,第二个文件名为“Golden Ratio Support Pressure Indicator extend”,可免费下载和使用。
FREE
In the dynamic world of trading, visual acuity is paramount for making informed decisions. For traders who struggle with color blindness—a condition that affects approximately 5-10% of males and a much lower percentage of females—distinguishing between buy and sell signals can be particularly challenging. Recognizing this unique challenge, we are proud to introduce “Open Buy Sell Color”, a MetaTrader 4 script designed to enhance visual clarity for all traders. This tool offers customization o
FREE

This expert is very simple and basic, it is based on the crossover of 2 Moving Average of the choice of the user. The indicator settings can be customized to your need and way of trading.
Expert Advisor Inputs: - Fast MA : The fast moving average. Default is set to 10. - Slow MA : The slow moving average. Default is set to 20. - Lot : The trading order lot. Default has been set to 0.01 lot (micro lot). - TP : The take profit. Default has been set to 10 pips. - SL : The stop loss. Default has be
FREE

Introducing News scalp: The Premier News Scalping Expert Advisor And Arbitrage
In the realm of forex trading, seizing fleeting opportunities amid market turbulence demands precision and speed. Enter News scalp, the pinnacle of news scalping Expert Advisors (EAs) designed to excel in the high-stakes arena of news-driven trading. With its innovative features tailored specifically for rapid-fire scalping strategies, News scalp promises to revolutionize how traders navigate volatile market con
FREE

Il nostro Indicatore Combinato RaysFX CCI-RSI è uno strumento unico che combina due dei più popolari indicatori di analisi tecnica: l’Indice di Forza Relativa (RSI) e l’Indice del Canale delle Materie Prime (CCI). Caratteristiche : Combinazione di CCI e RSI : L’indicatore calcola la differenza tra i valori di CCI e RSI per ogni barra del grafico. Media Mobile Semplice (SMA) : L’indicatore calcola una SMA su queste differenze e traccia due linee sul grafico. Segnali di trading : Ogni volta che qu
FREE

The Expert Advisor tool has been developed for NQ (Nasdaq), based on break logic and trend filter. The stop loss is based on fixed pips. It has been backtested on more than 10-year long on M1 data with high quality of modeling. The enclosed screenshots demonstrate the complexity and coverage of the test by Monte Carlo analysis with 200 simulations. The Expert Advisor passed via Cluster Analysis, Optimization profile, System parameter Permutation . There is no need to set up parameters - al
FREE

PROFIT XX FULLY AUTOMATED EA (ROBOT ) This is a trend EA, Works on all symbols (EURUSD, GBPUSD, EURJPY, USDJPY, EURCAD, EURGBP ) and many more. The EA works on all time frames (1m, 5m, 15m, 30m, IHR, 4HR, Weekly, Daily). but for best results 5 minutes time frame is recommended, The default settings are set best for 5 min chart. The EA is a combination of 200 SMA, 60SMA, 10SMA and 8RSI. the 200 SMA & 60 SMA gives a signal to open trades and the 10 SMA is closing single winning trades. The lo
FREE

L'indicatore forex R Ease Of Movement Metatrader 4 è un oscillatore di trading EMZ di colore blu. È un indicatore forex di tipo oscillatore che genera un'area di trading rialzista e ribassista. I valori al di sopra del livello zero sono detti rialzisti mentre i valori al di sotto del livello zero sono detti ribassisti.
L'oscillatore R Ease Of Movement non produce buoni risultati da solo, deve essere scambiato insieme a un indicatore tecnico che segue la tendenza. I buoni indicatori di tendenza
FREE
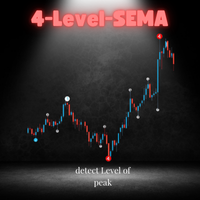
Well known to most, this indicator identifies the chart peaks and assigns the level of the peak. By classifying the peaks into levels, not only is a possible consolidation indicated but also the possible strength up to the highest level that indicates that a trend reversal is likely.
While most SEMA indicators work with 3 levels, this indicator has 4 levels.
This indicator is part of the OH-Strategy. You can view other indicators of this strategy if you click on my name as a seller.

1000% non-repaint high accuracy signal technical indicator. Solar wind Predator work on all pairs with high and low volatility Solar wind Predator work from the 1 minute timeframe to the Monthly timeframe Swing trading H1 to W1 Scalping M1 to M30 Blue arrows above the zero line look for buying(bullish) opportunities. Orange arrows below zero line look for selling(bearish) opportunities.
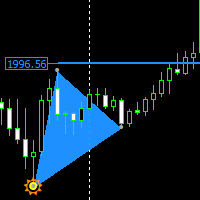
Non-repaint price action pattern based indicator works on all timeframe the indicator is based on a 123 Triangle pattern that happens everyday on the market the indicator will point out the pattern for you and you can turn on Fib level to see your take profit. Blue triangle is a buy signal Red triangle is a sell signal horizonal blue and red lines is an indication to place your trail stop loss one price has reached that area only entry when the triangle has fully formed

Hey traders, this EA has been made for a vey specific group of traders. this EA will work best for new traders with smaller accounts as I made it for myself originally. I would recommend using a 500USD account with a set lot size of 0.01(this can be changed as and when you feel like it) and this EA is ONLY intended for BTCUSD (Bitcoin vs the US Dollar) With this bot I can get 90%+ in back testing on MT4 the setting to use are as follows, but let me know if you need any help and ill be happy to e
Scopri come acquistare un robot di trading dal MetaTrader Market, il negozio di applicazioni per la piattaforma MetaTrader.
Il sistema di pagamento di MQL5.community supporta le transazioni tramite PayPal, carte bancarie e gli altri sistemi di pagamento più diffusi. Per essere pienamente soddisfatto, ti consigliamo vivamente di testare il robot di trading prima di acquistarlo.
Ti stai perdendo delle opportunità di trading:
- App di trading gratuite
- Oltre 8.000 segnali per il copy trading
- Notizie economiche per esplorare i mercati finanziari
Registrazione
Accedi
Se non hai un account, registrati
Consenti l'uso dei cookie per accedere al sito MQL5.com.
Abilita le impostazioni necessarie nel browser, altrimenti non sarà possibile accedere.