YouTubeにあるマーケットチュートリアルビデオをご覧ください
ロボットや指標を購入する
仮想ホスティングで
EAを実行
EAを実行
ロボットや指標を購入前にテストする
マーケットで収入を得る
販売のためにプロダクトをプレゼンテーションする方法
MetaTrader 4のためのテクニカル指標 - 9

Platone Breakout SMC - Advanced Trading Indicator Overview The Platone Breakout SMC is an innovative and powerful MetaTrader 4 (MT4) indicator designed for traders who seek to capitalize on smart money concepts (SMC) and breakout trading strategies. This indicator provides precision in identifying breakout levels, session times, and profit targets, ensuring that traders can execute well-informed trades with confidence. Trading Logic The core of the Platone Breakout SMC is its ability to identif
FREE

This indicator is designed to detect the best of all candlestick reversal patterns: Three Line Strike . According to the bestselling author and candlestick guru Thomas Bullkowski, this pattern has a winning percentage between 65% and 84% . This indicator scans for you up to 30 instruments (forex, indices or commodities) on up to 8 timeframes. You can get alerts via MetaTrader 4 and email if a Three Line Strike pattern occurs. Please note: Higher timeframes bring the most reliable signals. This i

** All Symbols x All Timeframes scan just by pressing scanner button ** ***Contact me after purchase to send you instructions and add you in "RSI scanner group" for sharing or seeing experiences with other users.
Introduction RSI divergence is a main technique used to determine trend reversing when it’s time to sell or buy because prices are likely to drop or pick in the charts. The RSI Divergence indicator can help you locate the top and bottom of the market. This indicator finds Regular div

Direct translation of blackcat's L3 Banker Fund Flow Trend Oscillator. Get push notifications on your phone app when a signal bar has formed. Historical signals are shown with buy/sell arrow right on the main chart. Indicator uses two data calculations to check for a cross below 25% level (a signal to go long) and above 75% level (a signal to short). For any further questions feel free to contact me directly. Including requests for product improvements.

Trend arrow Indicator is an arrow Indicator used as an assistant tool for your trading strategy. The indicator analyzes the standard deviation of bar close for a given period and generates a buy or sell signals if the deviation increases. It good to combo with Martingale EA to follow Trend and Sellect Buy Only/Sell Only for EA work Semi-Automatic.
You can use this Indicator with any EAs in my Products.
FREE

Gold Level MT4
A great helper for trading Gold.
Levels do not repaint and do not change their data We recommend using it with the indicator - Professional Trade Arrow
Levels are built every day, so you will trade every day with the indicator.
Gold Level.
Price markups are shown on the chart, after reaching TP1 or SL1, close half of the position, and the rest is transferred to breakeven.
Any questions? Need help?, I am always happy to help, write me in private messages or in telegram.
Brilliant Reversal Indicator - Your Ultimate Alert-Driven Trading Solution Unlock the potential for unparalleled trading success with the "Brilliant Reversal Indicator." This powerful tool has been meticulously designed to empower traders by identifying critical reversal opportunities with lightning-fast alerts. Key Features : Precise Reversal Detection : The Brilliant Reversal Indicator specializes in pinpointing potential trend reversals, helping you seize opportunities to enter or exit positi
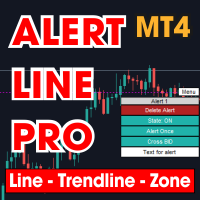
This is MT4 version , MT5 on this link : Alert Line Pro MT5 Alert line pro allows to make alert when price cross these objects: Horizontal lines Trendline Price Zone (Rectangle) Alert when close current bar (have new bar) When the price crosses the alert lines, the software will sound an alarm and send a notification to the MetaTrader 4 mobile application. You need to settings your MetaQuotes ID of MT4 apps to MetaTrader4 software to get notification to the mobile phone. Sound files must be

Dark Oscillator is an Indicator for intraday trading. This Indicator is based on Counter Trend strategy, trying to intercept changes in direction, in advance compared trend following indicators. We can enter in good price with this Indicator, in order to follow the inversion of the trend on the current instrument. It is advised to use low spread ECN brokers. This Indicator does Not repaint and N ot lag . Recommended timeframes are M5, M15 and H1. Recommended working pairs: All. I nst
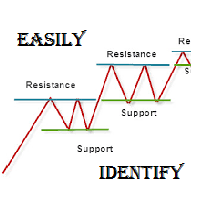
As per name Easily Identify, This Indicator is a affordable trading tool because with the help of Popular Developers & Support of M Q L Platform I have programmed this strategy. I tried to input 4 types and 3 periods of Calculation regarding Support Resistance, Furthermore, I have also care about Trend lines that Trader can easily get in touch with market in another way also. What is in for Trader?
Trading Modes: This selection is for activate whole strategy "Easily Identify" Support_
FREE

Allows multiple indicators to be combined into a single indicator, both visually and in terms of an alert. Indicators can include standard indicators, e.g. RSI, CCI, etc., and also Custom Indicators, even those purchased through Market, or where just have the ex4 file. An early alert is provided, say when 4 out 5 indicators have lined up, and a confirmed alert when all are in agreement. Also features a statistics panel reporting the success of the combined indicator by examining the current cha

This indicator can send alerts when a Heiken Ashi Smoothed color change occurs. Combined with your own rules and techniques, this indicator will allow you to create (or enhance) your own powerful system. Features Can send all types of alerts. Option to delay the alert one bar in order to confirm the color (trend) change. Input parameters Wait for candle close: 'true' or 'false'. Setting it to 'true' will delay the alert to the opening of the bar following the bar where the color change occurred.
FREE
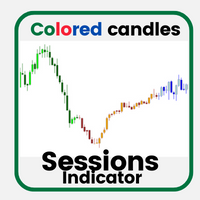
This indicator shows trading sessions using colored candles. It's made for volume profile and supply/demand traders to quickly see when specific candles are formed during different times or trading sessions.
Take a look at the screenshots for a usage example.
Core Features: Different colors for bullish and bearish candles, allowing users to distinguish between bullish/bearish candles.
FREE
Optimize your trading strategy of your custom indicators with the "Indicator Combiner Into One Indicator". This advanced tool combines multiple indicators, including your custom indicators, into a single, user-friendly interface. It generates an arrow signal based on your custom indicators, simplifying your decision-making process. Ideal for traders of all levels, this indicator offers:
Arrow Signals : Get a clear, single arrow signal that combines insights from your custom indicators, m
FREE

このインジケーターは有名なフラクタルインジケーターに基づいていますが、多くのカスタマイズ と柔軟性があり、
これは、トレンドの反転を特定し、潜在的な利益を最大化するための強力なツールです。
高度な機能とユーザーフレンドリーなインターフェイスを備えた、あらゆるレベルのトレーダーにとって究極の選択肢です。 MT5 バージョン : Ultimate Fractals MT5 特徴 :
カスタマイズ可能なフラクタル キャンドルの数。 反転ライン。 カスタマイズ可能な設定。 ユーザーフレンドリーなインターフェイス。 主なパラメータ: 左側のキャンドル - フラクタルを形成する左側のバーの数。 Candle On Right - フラクタルの右側のバーの数。
市場の不確実性によって行動を妨げないようにしてください。 「究極のフラクタル」インジケーターでトレーディング ゲームをレベルアップさせましょう。
このツールを利用して自信を持って意思決定を行い、財務目標を達成する成功したトレーダーの仲間入りをしましょう。 特定の「Ultimate Fractals MT4」インジケーター
FREE
The Reversal Candlestick Structure indicator detects multiple candlestick patterns occurring when trends are most likely to experience a reversal in real-time. The reversal detection method includes various settings allowing users to adjust the reversal detection algorithm more precisely.
A dashboard showing the percentage of patterns detected as reversals is also included. USAGE Figure 1 Candlestick patterns are ubiquitous to technical analysts, allowing them to detect trend continuati
このツールで市場構造を素早く分析し、重要な価格水準を活用しましょう。
市場構造 このカスタムインジケーターは、重要な価格水準をプロットし、エントリーポイントや利益目標として使用できます。
取引レンジの特定 このインジケーターを使用して、相場の転換点を考慮しながらスキャルピングを行いましょう。
ブレイクアウトの取引機会 このインディケータを使用して、ブレイクアウトの機会を見極めましょう。この取引戦略は、優れたリスクリワードレシオを可能にします。
カスタムアラート 価格が特定の取引レンジをブレイクアウトすると、携帯電話やEメールで通知されます。アラートをカスタマイズしたい場合は、お気軽にメッセージをお送りください。
スマートマネーのコンセプト このインジケーターは、自己勘定トレーダーのスマートマネーのコンセプトに従って開発されました。
シンプルなデザイン チャート上にすべての可能なゾーンをプロットするのではなく、フォローすべき主要なレベルのみをプロットすることにしました。従って、このインジケータはシンプルで、初心者に適したツールとなって

This Indicator is a affordable trading tool because with the help of Popular Developers & Support of M Q L Platform I have programmed this strategy. I tried to combine logic of Moving Averages, Parabolic Stop And Reverse, Trend Strength, Oversold, Overbought . Furthermore, I have also care about Support Resistance that Trader can easily get in touch with market by selecting one indicator only. What is in for Trader?
Trading Modes: This selection is for activate whole strategy "Power
FREE

Renko, Heiken Ashi, Ticks Bar, Range Bar. Easy switching, easy setup, all in one window. Place the Custom Chart indicator and view Renko, Heiken Ashi, Tick bar, Range bar charts in real time at real chart. Position the offline chart window so that the indicator control panel is visible. Switch the chart mode by click of a button. Connect to the output chart any indicator, expert advisor without any restrictions. No, it doesn't work in the tester. Yes, you can use an
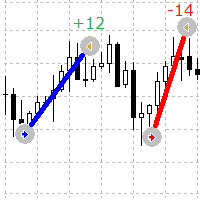
チャート上の注文のエントリーポイントとエグジットポイントを視覚的に確認するためのシンプルで便利なインジケーター
このインジケーターは、現在のオープン注文と完了した注文をシンボルで表示します
指標パラメータ
Lines Buy color - 買い注文のラインの色を指定します Lines Sell color - 売り注文のラインの色を指定します Lines Width - 線の幅を設定します。ソリッド スタイル タイプで機能します。 Lines style - 線のスタイルを設定します Lines positive profit color - 正の利益テキストの色を設定します Lines negative profit color - 負の利益テキストの色を設定します Lines Profit Value Font Type - 利益テキストのフォント タイプを設定します。コンピュータにインストールされているいずれかを設定できます。 Lines profit font size - 利益テキストのフォント サイズを設定します Lines profit value ang
FREE
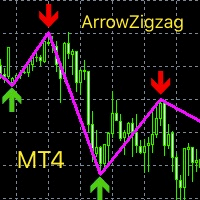
This index is based on the secondary development of zigzag, adding high and low point arrow indication, thickening the line and changing the color. Can be a good display of the current admission trading signals, current long or short. It can be combined with other indicators to determine the trading point, which has great reference value. Compared with the general trend index or oscillation batch standard, the accurate determination is higher from the perspective of historical data research and
FREE

Trend Master Chart、必要なトレンド指標です。 チャートをオーバーレイし、色分けを使用してさまざまな市場のトレンド/動きを定義します。 2 つの移動平均と異なるオシレーターを組み合わせたアルゴリズムを使用します。 これら 3 つの要素の周期は変更可能です。 どの時間枠やペアでも機能します。
上昇トレンドまたは下降トレンド、およびこのトレンドへのさまざまなエントリーポイントを一目で識別できます。 たとえば、顕著な上昇トレンド (薄緑色) では、このトレンド内のさまざまな市場インパルスが濃い緑色のローソク足で表示されます。 設定可能なアラートを使用すると、これらの衝動を決して見逃すことがなくなります。
MT5のバージョンです。
入力パラメータ:
Period 1: 高速期間移動平均。
Period 2: 低速期間の移動平均。
Oscillator period: オシレーター周期。
Sell/Buy alert: 市場衝動アラート、トレンドエントリーポイント。 Bullish/Bearish alert: トレンドが
FREE

FVG Fair Value Gap is an indicator that plot rectangle for last found fair value gap. There will be a total of eight fair value gaps. Four is bullish fair value gaps and another four is bearish fair value gaps. Bullish Fair Value Gaps Top Bullish/Bearish Fair Value Gap is the gap that will obey the "Recent candles" and "Nearby Size In Pips" parameters. This fair value gap will be above current price. Bottom Bullish/Bearish Fair Value Gap is the gap that will obey the "Recent candles" and "Nearb
FREE
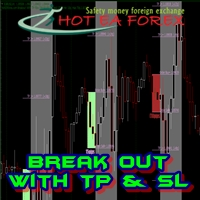
How To Trade
Execute your trades in 3 Easy Steps!
Step 1: Trade Setup Entry Buy in Signal price and TP1 in price indicator, You can use trailing stop in TP1. Entry Sell in Signal price and TP1 in price indicator, You can use trailing stop in TP1. Success Rate ≥ 75% 100:25 Step 2: Set Stop Loss Stop loss BUY ----> You can set stop loss on Line Order SELL. Stop loss SELL ----> You can set stop loss on Line Order BUY. Step 3: Set Take Profit Option 1: Take profit on TP1. Option 2: Partial take
FREE
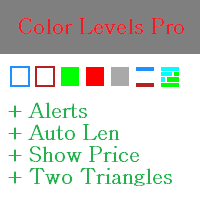
Color Levels Pro is a new version of the normal Color Levels. It allows setting two empty rectangles, three filled ones, two tredlines, and two triangles.
The indicator parameters are very simple and divided into blocks:
The ones beginning with 1 and 2 - empty rectangle (frame) parameters; 3, 4, and 5 - filled rectangle parameters; 6 and 7 - trendline parameters; 8 and 9 - triangle parameters. Simply click a desired object and it will appear in the corner.
Main Adjustable Parameters : C
FREE
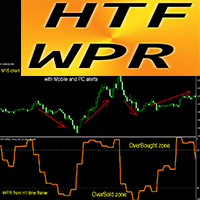
強力な MT4 用 Forex インジケーター HTF WPR オシレーター
MT4 用のプロフェッショナル HTF WPR オシレーターで取引方法をアップグレードしましょう。HTF は Higher Time Frame を意味します。WPR はスキャルピング用のトップ オシレーターの 1 つです。このインジケーターは、売られ過ぎ/買われ過ぎ領域からの価格アクション エントリを備えたマルチタイム フレーム取引システムに最適です。 HTF WPR インジケーターを使用すると、Higher Time Frame の WPR を現在のチャートに添付できます --> これはプロフェッショナルな取引アプローチです。 インジケーターにはモバイルおよび PC アラートが組み込まれています。 // より優れたエキスパート アドバイザーとインジケーターは、こちらで入手できます: https://www.mql5.com/en/users/def1380/seller これは、この MQL5 Web サイトでのみ提供されるオリジナル製品です。
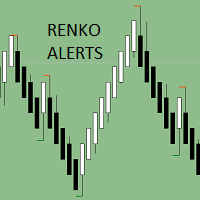
Renko Charts now have the alerts, we need. There are four alert types to choose from for notification on screen, email or phone notification. The alert types also have buffers for use with automation. This indicator can be incorporated with any system that requires renko charts. The four (4) alert types are: Three-bar Formation; Pinbar; Maubozu and Engulfing Bar The alerts may also be adjusted by settings found in the input window of the indicator.

Median Renko Terminator works best with renko charts if you do not have a renko chart generator I will email it to you for free and give you the correct settings for scalping or to swing trade NON-REPAINT COMES WITH ALERTS WHEN THERE IS A SIGNAL Conditions to sell: big purple arrow shows you the direction first then you take the small purple arrow to enter the same direction of the purple arrow. Conditions to buy: big white arrow shows you the up direction first then you take small white arrow

Was: $69 Now: $34 Blahtech VWAP - Volume Weighted Average Price (VWAP) is the ratio of price to total volume. It provides an average price over a specified time interval. Links [ Install | Update | Documentation ] Feature Highlights
Configurable VWAP Line Sessions, intervals, anchored or continuous Previous day settlement line Standard Deviation bands Alerts at bar close or real time Automatic Broker or Tick volumes Significantly reduced CPU usage
Input Parameters
Expert Advis

The ICT Unicorn Model indicator highlights the presence of "unicorn" patterns on the user's chart which is derived from the lectures of "The Inner Circle Trader" (ICT) .
Detected patterns are followed by targets with a distance controlled by the user.
USAGE (image 2) At its core, the ICT Unicorn Model relies on two popular concepts, Fair Value Gaps and Breaker Blocks. This combination highlights a future area of support/resistance.
A Bullish Unicorn Pattern consists ou
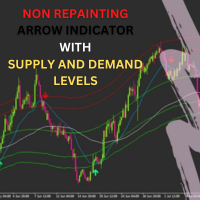
*****ARROWS NON REPAINT ***** Trade With Sam Simple Strategy Guide : https://www.mql5.com/en/blogs/post/740855
MT5 version of the indicator
Try Out and see the Difference
The Sam's Trend Blaster indicator tracks the market trend with an unmatched reliability, by ignoring sudden fluctuations and market noise. It has been designed to trend-trade intraday charts and small timeframes. Its winning ratio is around 85%. This is an arrow indicator that shows precise price reversals. A great ar

This indicator has been created for finding the probable reversal points of the symbol price. A small candlestick reversal pattern is used it its operation in conjunction with a filter of extremums. The indicator is not redrawn! If the extremum filter is disabled, the indicator shows all points that have a pattern. If the extremum filter is enabled, the condition works – if the history Previous bars 1 candles back contains higher candles and they are farther than the Previous bars 2 candle, such
FREE

[75% OFF! - SALE ENDS SOON] - RevCan Trend Entry Point is a trend based trade alert indicator for serious traders. It does all the price and chart analysis all by itself, and whenever it finds any potential high quality trading opportunity(Buy or Sell) using its revolutionized price prediction algorithms, it sends instant trade alert directly on the chart, MT4 terminal and on the mobile device. The trade signals will be visible on the chart as Up and Down arrows, while the instant audible aler

This scanner is monitoring the entire market for trade opportunities for all symbols and for all time frames. You don't have to look to all the charts, for all symbols and for all time frames. This scanner will alert you on your computer, or on your mobile, when a trade opportunity has been found. You never have to miss a trade opportunity! This indicator is designed to scan all pairs and symbols, for all time frames, to find a cross of the MACD main and signal line. MACD Definition
The

Market Profile 3 MetaTrader 4 indicator — is a classic Market Profile implementation that can show the price density over time, outlining the most important price levels, value area, and control value of a given trading session. This indicator can be attached to timeframes between M1 and D1 and will show the Market Profile for daily, weekly, monthly, or even intraday sessions. Lower timeframes offer higher precision. Higher timeframes are recommended for better visibility. It is also possible t
FREE

Gann Signal is a very simple indicator at first glance, but hidden inside is many years of experience in studying W.D.Ganna methods. The indicator gives accurate BUY/SELL signals, without redrawing. The indicator is very easy to use. All you need to do is attach it to your chart and follow its recommendations. The indicator constantly analyzes the market for entry opportunities. When such an opportunity appears, the indicator gives a signal in the form of an arrow. I repeat, all signals are NOT

Ichimoku Trend Alert is the Ichimoku Kinko Hyo indicator with Alerts and signal filters.
Ichimoku Trend Alert features: Optional check of Ichimoku cloud, Tenkan sen(Conversion Line), Kijun sen(Base Line), Senkou span A, Senkou span B, and Chikou span relative to price, and more. Popup, email, and phone notification alerts for selected symbols and timeframes.
There are 9 classic Ichimoku trend filters you can enable/disable in settings: Price/Cloud Order: Checks the price position relative to
FREE

BeST_Gann Hi-Lo Strategy is an MT4 indicator that is based on the Gann Hi-Lo Activator the famous trend-following indicator that allow us to to enter a trade quite early while also stay in a trade as longer as we can for taking profit.While it is built of a moving average it helps traders determine the direction of the trends and to produce with-trend trading signals.
This indicator is in fact a simple moving average of the highs and lows of the previous period. It follows the trends in the mar
FREE

Fast trend is a professional version of the trend direction indicator and entry points. The indicator with high probability determines the direction of the trend on any currency pairs, stocks, cryptocurrency without redrawing the result. To determine the trend, it uses Price action and its own unique filtering algorithm. Suitable for all types of trading, both for scalping and for long-term trading. This version of the indicator is another branch of the evolution of the Simple Trend indica

Description: The indicator measures, through the zigzag indicator, the levels of trend or correction. It shows in the chart the levels of each low or high detected. KEY LINKS: How to Install – Frequent Questions - All Products How is this indicator useful? This indicator determines, depending on Zigzag parameter if a trend is beginning, developing, or ending This indicator determines the direction of the trend Components Levels as positive or negative numbers, depending on the direction
FREE

The indicator shows De Mark patterns and gives trading signals in the form of arrows and alerts. Shows De Mark lines on the history of quotes. Has a multiframe., Can show DeMark patterns of higher timeframes on lower timeframes. Has a switchable function for displaying fractals. Trading signals are accompanied by sound alerts, as well as sending them to mail and mobile devices.

MACD is probably one of the most popular technical indicators out there. When the market is trending, it actually does a pretty good job, but when the market starts consolidating and moving sideways, the MACD performs not so well. SX Impulse MACD for MT5 is available here . Impulse MACD is a modified version of MACD that works very well for trading Forex, stocks, and cryptocurrencies. It has its own unique feature which perfectly filters out the values in a moving average range and enables it t

または(TDO)は、「純粋な勢い 」の原則を使用して価格変動率を測定する指標です。
証券価格が10から15に上がると、価格の変化率は150%になりますが、15から10に戻ると、価格の変化率は33.3%になります。そのため、「価格変化率」(ROC)や「モメンタム」などのテクニカル分析指標は、下降するものよりも上昇する価格の動きの方が高い値を示します。 TDOはこの問題を修正して、トレーダーが勢いを正しく読み取るのを支援します。
重要な情報
TDOユーザーズマニュアル: https://www.mql5.com/en/blogs/post/717970 TDO FAQ: https://www.mql5.com/en/blogs/post/722015 TDOビデオライブラリ: https://www.mql5.com/en/blogs/post/722018 TDOエキスパートアドバイザーの例: https://www.mql5.com/en/blogs/post/731141
TDOの機能
TDOは純粋な勢いをパーセントとして計算するため、さまざまな市場のさまざまな

This is an advanced multi-timeframe version of the popular Hull Moving Average (HMA). Features Graphical panel with HMA indicator data from all timeframes at the same time . If the HMA has switched its direction on any timeframe, a question mark or exclamation mark is displayed on the panel, accompanied by a text and audio message. The messages can be configured separately for each timeframe using the corresponding checkboxes.
The indicator is located in a separate window, so as not to overloa
Thank you for your interest in "Goldfish Indicator". I have been trading since 2008. I usually trade on Renko chart in reversal pattern with Goldfish Indicator. If you share your vps details with me, I will connect your account (Live/Demo). To get proper results copy my trades for at least 30 days. Minimum Deposit: $1000 Leverage: 100:1 Profit Target: Monthly average profit target is 10% to 20%+/- Draw-down: The average drawdown is 10% to 20% Risk
Warning: Trading financial products on margin
FREE
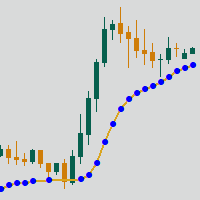
Adaptive Moving Average (AMA) is a trend indicator using moving average and market noise filter. Indicator feature are blue and red points, showing the power of trend. Recommendations for trading: Auxiliary Indicator Detecting trend Detecting power of trend Detecting potential reversal points Main indicator Shows entry points for swing trading Serves as dynamic support and resistance Recommendations for use: Any instrument Any timeframe Input parameters: Period - AMA period Fast Period - fast
FREE

YOU CAN NOW DOWNLOAD FREE VERSIONS OF OUR PAID INDICATORS . IT'S OUR WAY OF GIVING BACK TO THE COMMUNITY ! >>> GO HERE TO DOWNLOAD The system is a free open source pine script originally published on TradingView by everget . It was converted to Mt4 by Forex Robot Makers. This system is a popular trend indicator based on ATR ( Average True Range ) , Moving Averages and the Donchian channel .
System BackGround
ATR The average true range is an indicator of the price volatility of an as
FREE

NextCandlePredictor インジケーター NextCandlePredictorは、再描画しない、色が変わらない、動かない、消えない、遅延がないアラート付きのシグナルインジケーターです。あらゆるタイムフレームで次のキャンドルまたはその次のキャンドルの方向を識別するのに役立ちます。ニューヨーク、ロンドン、またはその両方の重なり合う高ボラティリティ市場に特にお勧めです。 主な特徴: タイムフレームの汎用性: M1からH1以上のあらゆるタイムフレームで迅速かつ正確なシグナルを提供します。 明確な買い/売りシグナル: ADXのDI+とDI-ラインを使用して明確な買いと売りのシグナルを生成し、最良のトレード判断を下せるようにします。 直感的な視覚化: シグナルはチャート上に緑色(買い)と赤色(売り)の矢印で直接表示され、迅速かつ簡単に読み取れます。 カスタマイズ可能な設定: 分析するバーの数とアラートオプションを好みとトレード戦略に応じて調整できます。使用するTFに応じた提案表を以下で確認してください。 即時およびオプションのキャンドル終了時アラート: デフォルトでは、ADX条件が
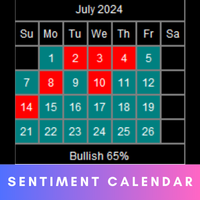
The Market Sentiment calendar provides a visual representation of market sentiment for each day or month. It will display daily and monthly BIAS . The calendar also highlights the percentage of bullish days or months within a given month or year. MT5 version - https://www.mql5.com/en/market/product/120768/ Inputs Frequency: Choose between "Daily" and "Monthly" calendar views. Sentiment Method: Select the method to determine daily or monthly sentiment: " L inear Regression ", " Accumulated Delta

Just another Auto Fibonacci Retracement indicator . However, this is the most Flexible & Reliable one you can find for FREE. If you use this indicator and you like it, please leave a review/comment. If you are looking for a more advanced Fibo indicator, check this Free Trend-Based Fibo indicator .
### FEATURES ### Auto-calculate up to 7 Fibonacci levels on your customized frame. Adjust levels as your need. Use High/Low price or Open/Close price to calculate. Freeze the levels and don't re
FREE

Place price Alerts on extended Rectangles and Trendlines - Risk reward indicator mt4 Extend Rectangles & Trendlines to the right edge Mark your supply demand zones with extended rectangle and draw support resistance lines with extended trendline. Find detailed manuals here . Find contacts on my profile . MT4 Rectangle extender indicator will simplify and make it easier for you to analyze markets and stay notified about important events. When you extend rectangle or trendline the action bu

BUY INDICATOR AND GET A PIVOT POINT EA FOR FREE AS A BONUS + SOME OTHER GIFTS! ITALO PIVOTS INDICATOR is the best pivot point indicator for strong price reversals and continuations of price movements ever created , and why is that? You will have for the first time inside a pivot point indicator the pivots above the monthly, so, you will have the 3-month pivot lines, 6 months, 1 year, 2 years, 3 years, 5 years and 10 years, very strong support and resistances. Not only that but for the fi
トレード矢印付きの Macd 2 ライン インジケーター。
含まれるもの:
MACDシグナルとMACDライン 2色のヒストグラム 0レベル 可能性のあるトレードの矢 読み方 :
クロスが発生するとインジケーターに矢印が表示され、ファストラインがゼロラインの上または下に移動します。 適切なリスク管理を行い、ボラティリティの高いニュースに基づいて取引しないでください。
他の製品をチェックしてください: https://www.mql5.com/en/users/gabedk/seller Torēdo yajirushi-tsuki no Macd 2 rain injikētā. Fukuma reru mono: MACD shigunaru to MACD rain 2-shoku no hisutoguramu 0 reberu kanōsei no aru torēdo no ya yomikata: Kurosu ga hassei suru to injikētā ni yajirushi ga hyōji sa re, fasutorain ga zero
FREE
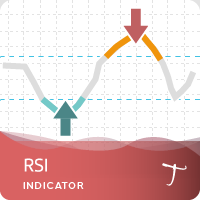
Tipu RSI Features 28 symbols, multi-time frame powerful Dashboard for the full market view Customizable Buy/Sell alerts, push alerts, email alerts, and visual on-screen alerts. Marked overbought and oversold levels. Three colors RSI that marks the normal, oversold and overbought levels. The relative strength index (RSI) is an oscillator devised by J. Welles Wilder in his famous book New Concepts in Technical Trading Systems in 1978.1 He also introduced Parabolic SAR (see Tipu Parabollic SAR Pane
FREE

BREAKOUT-SESSION-BOX LONDON EU US ASIA Open
watch the expectation of a volatile movement above or under the opening range We take the high of the range as Entry for a long trade and SL will be the low of the range and vice versa the low of the range as Entry for a short trade and the high for SL The size of the range is the distance to the TP (Take Profit) The range of the opening hours should not be larger than about 1/3 of the average daily range 4 breakout examples are already predefined:
FREE

「BIG FIGURE INDICATOR」は、価格チャート上で整数や半分の数字(たとえば、通貨取引での1.0000や1.5000など)など特定のレベルで自動的に水平線を識別して描画します。これらのレベルは心理的に重要であると考えられており、大口トレーダーや投資家が注目する可能性がある丸められた数字を表しており、潜在的なサポートまたはレジスタンスレベルにつながります。ビッグフィギュアインジケーターは、トレーダーが重要な価格レベルを特定し、これらのレベルに基づいて取引決定を行うのに役立ちます。
ラインはM1からH4のタイムフレームチャートにのみ表示されます。
ラインの色は入力パラメータタブで変更できます。
すべての通貨ペアで使用できます。
MT5バージョン: https://www.mql5.com/fr/market/product/96750
注意:当社のインジケーターを最適に機能させるには、まずデイリー(D1)タイムフレームを読み込む必要があります
FREE

Description: This indicator draw ZigZag Line in multiple time frame also search for Harmonic patterns before completion of the pattern.
Features: Five instances of ZigZag indicators can be configured to any desired timeframe and inputs. Draw Harmonic pattern before pattern completion. Display Fibonacci retracement ratios. Configurable Fibonacci retracement ratios. Draw AB=CD based on Fibonacci retracement you define. You can define margin of error allowed in Harmonic or Fibonacci calculatio
FREE
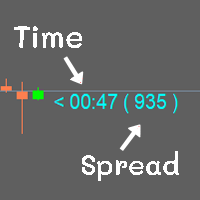
Show the time of candlesticks and spread. All data will be displayed in a rod. Can change color Can fix the size as needed
MT4 : Link https://www.mql5.com/en/market/product/102742 MT5 : Link https://www.mql5.com/en/market/product/102834
Most free code on various websites I didn't write it myself. I only do a little bit.
If you like it, please give 5 stars with it. Thank you.
FREE

収益性の高い取引機会を簡単に特定するのに役立つ強力な外国為替取引インジケーターをお探しですか?ビースト スーパー シグナル以外に探す必要はありません。 この使いやすいトレンドベースのインジケーターは、市場の状況を継続的に監視し、新しいトレンドを検索したり、既存のトレンドに飛びついたりします。ビースト スーパー シグナルは、すべての内部戦略が一致し、互いに 100% 合流したときに売買シグナルを発するため、追加の確認は不要です。シグナル矢印アラートを受け取ったら、単に売買します。 購入後、プライベート VIP グループに追加されるようにメッセージを送ってください! (完全な製品購入のみ)。
購入後、最新の最適化されたセット ファイルについてメッセージを送ってください。
MT5バージョンは こちらから入手できます。
Beast Super Signal EA は こちらから 入手できます。
コメント セクションをチェックして、最新の結果を確認してください。
ビースト スーパー シグナルは、1:1、1:2、または 1:3 のリスクと報酬の比率に基づいて、エントリ

About Scanner:
It will show you the Higher/Lower Highs and Lows of zigzag price. Use it to keep track of best ongoing trends and price ranges. Detailed blog post with free 2 weeks demo (till Sep-2,2022): https://www.mql5.com/en/blogs/post/750232
Symbols:
HH: Higher Highs HL: Higher Lows When price makes higher and higher Highs or higher Lows:
It will count Zigzag in reverse and find total number of last "Higher Highs" and "Higher Lows" or "Lower Lows" and "Lower Highs". LL: Lower Lows

MetaForecastは、価格データのハーモニクスに基づいて、どんな市場の未来を予測し視覚化します。市場が常に予測可能ではありませんが、価格にパターンがある場合、MetaForecastは可能な限り正確な未来を予測できます。他の類似製品と比較して、MetaForecastは市場のトレンドを分析することでより正確な結果を生成することができます。
入力パラメータ Past size (過去のサイズ) MetaForecastが将来の予測を生成するために使用するバーの数を指定します。モデルは選択したバー上に描かれた黄色の線で表されます。 Future size (将来のサイズ) 予測すべき将来のバーの数を指定します。予測された将来は、ピンクの線で表示され、その上に青い回帰線が描かれます。 Degree (程度) この入力は、MetaForecastが市場で行う分析のレベルを決定します。 Degree 説明 0 Degree 0の場合、価格の全てのピークや谷、そして詳細をカバーするために、「Past size」の入力に大きな値を使用することが推奨されています。 1 (推奨) Degr

How To Use
Check out this post for detailed description on All Indicator extras and template: https://www.mql5.com/en/blogs/post/758259
The Best Heiken Ashi System is a simple trading system for trading based only two indicators for generate signals: Heiken ashi smoothed and Vqzz indicator multi-timeframe. The system was created for scalping and day trading but can also be configured for higher time frames. As mentioned, the trading system is simple, you get into position when the two ind
FREE

A. A2SR とは何ですか ? * 先行テクニカル指標です (塗り直しなし、ラグなし)。
-- ガイダンス : -- https://www.mql5.com/en/blogs/post/734748/page4#comment_16532516 -- そして https://www.mql5.com/en/users/yohana/blog
A2SR には、サポート (需要) とレジスタンス (供給) のレベルを決定する特別な手法があります。 ネットで見かける通常の方法とは異なり、A2SR は実際の SR レベルを決定する独自のコンセプトを持っています。 元の手法はインターネットから取得されたものではなく、インターネット上で公開されたこともありません。 A2SR は、取引スタイルに応じて SR レベルを自動選択します。 時間枠を変更しても、SR レベルはその位置にとどまります。 実際のSRは、使用する時間枠から取得されるわけではないため. A2SR には、取引のための完全な手段があります 。
実際のサポート (需要) とレジスタンス (供給) の真のコンセプト。

Wolfe Waves scanner - It scans all the Symbols and identify the movement of price and it gives confidence in trade. It automatically plots fifth wave breaks out of the channel. According to the theory behind the pattern, a line drawn from the point at the beginning of the first wave and passing through the beginning of the fourth wave predicts a target price for the end of the fifth wave. If a trader properly identifies a Wolfe Wave as it forms, the beginning of the fifth wave represents an op

This indicator is very useful for day traders or short term traders. No need to calculate the number of pips manually, just look at the chart and you will see the Virtual Take Profit / Virtual Stop Loss target line and evaluate whether the entry point is feasible to reach the intended target or not.
Enter the intended Take Profit / Stop Loss pips for your trade. The indicator will display Virtual Take Profit / Virtual Stop Loss lines for you to easily see if the target is feasible or not.
FREE

[ MT5 Version ] Only the next 10 units at current price! Final price: $299 Are you tired of spending months on demo or live accounts to test your trading strategies? The Backtesting Simulator is the ultimate tool designed to elevate your backtesting experience to new heights. Utilizing Metatrader historical symbol information, it offers an unparalleled simulation of real market conditions. Take control of your testing speed, test ideas quickly or at a slower pace, and witness remarkable improvem

Smart Reversal Signal is a professional indicator for the MetaTrader 4 platform; it has been developed by a group of professional traders. This indicator is designed for Forex and binary options trading. By purchasing this indicator, you will receive: Excellent indicator signals. Free product support. Regular updates. Various notification options: alert, push, emails. You can use it on any financial instrument (Forex, CFD, options) and timeframe.
Indicator Parameters Perod - indicator calcula

MACD divergence indicator finds divergences between price chart and MACD indicator and informs you with alerts (popup, mobile notification or email). Its main use is to find trend reversals in the chart. Always use the divergence indicators with other technical assets like support resistance zones, candlestick patterns and price action to have a higher possibility to find trend reversals. Three confirmation type for MACD divergences: MACD line cross zero level Price returns to previous H/L Creat
FREE
Candle_Timer_and_Spread インジケーターは、選択したシンボルのスプレッドとともに、ローソク足の終了までの時間と価格変化の割合を 1 つのチャートに表示します。
現在の時間枠のローソク足の終わりまでの時間と、その日の始値に対するパーセンテージでの価格変化のタイマーは、デフォルトでチャートの右上隅に表示されます。 パネルには、選択したシンボルのその日の始値に対する現在の価格のスプレッドと変化率が表示されます。パネルはデフォルトで左上隅に配置されます。
入力設定: Candle_Time_Lable_Settings - ローソク足の終わりまでの時間と現在のシンボルの価格の変化に関するタイマーのタイプの設定。 Font_Size - フォント サイズ。 X_offset - 横軸に沿ってシフトします。 Y_offset - 縦軸に沿ってシフトします。 Text_color - フォントの色。 Multi_Symbol_Settings - マルチシンボル パネルの設定。 Symbols_to_work - パネルに表示するシンボルをカンマで区切って手動で入力し
FREE

Backtest with good trend detection results from January 2023
EURUSD Time frame: m15, m30, H1
AUDUSD Time frame: m15, m30 NASDAQ Time frame: m15 S&P 500 Time frame: m15, m30 XAUUSD Time frame: m30 BTCUSD Time frame: H4
These are just some of the assets tested (Please note that past results are no guarantee of future results). Note that this is not a complete strategy, you can use this indicator as an entry trigger after your analysis by setting stop loss and take profit values that you d
MetaTraderマーケットは、他に類のない自動売買ロボットやテクニカル指標の販売場所です。
MQL5.community ユーザーメモを読んで、取引シグナルのコピー、フリーランサーによるカスタムアプリの開発、支払いシステムを経由した自動支払い、MQL5Cloud Networkなど、当社がトレーダーに対して提供するユニークなサービスについて詳しくご覧ください。
取引の機会を逃しています。
- 無料取引アプリ
- 8千を超えるシグナルをコピー
- 金融ニュースで金融マーケットを探索
新規登録
ログイン