YouTubeにあるマーケットチュートリアルビデオをご覧ください
ロボットや指標を購入する
仮想ホスティングで
EAを実行
EAを実行
ロボットや指標を購入前にテストする
マーケットで収入を得る
販売のためにプロダクトをプレゼンテーションする方法
MetaTrader 4のためのテクニカル指標 - 5
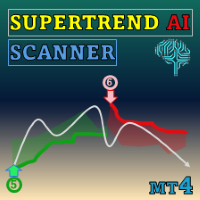
Special offer : ALL TOOLS , just $35 each! New tools will be $30 for the first week or the first 3 purchases ! Trading Tools Channel on MQL5 : Join my MQL5 channel to update the latest news from me SuperTrend AI Clustering with Scanner でAIの力を発見し、MetaTrader 4 (MT4) 用の革命的な取引ツールです。このインジケーターは、K-means クラスタリングと広く人気のある SuperTrend インジケーターを組み合わせることで市場分析を再定義し、トレーダーがトレンドとシグナルをナビゲートする際に優位性を提供します。 See more MT5 version at: SuperTrend AI Clustering MT5 with Scanner See more products at: https

Simple QM Pattern is a powerful and intuitive trading indicator designed to simplify the identification of the Quasimodo (QM) trading pattern. The QM pattern is widely recognized among traders for effectively signaling potential reversals by highlighting key market structures and price action formations. This indicator helps traders easily visualize the QM pattern directly on their charts, making it straightforward even for those who are new to pattern trading. Simple QM Pattern includes dynamic
FREE

Introducing our exciting new Price Retest indicator! Get instant alerts when the price retests, giving you a powerful edge in your trading strategy. Remember to do your own analysis before making any moves in the market. MT5 Version - https://www.mql5.com/en/market/product/118159/ Join To Learn Market Depth - https://www.mql5.com/en/channels/suvashishfx
Here’s a detailed explanation of how the Price Retest indicator works, its components, and how you can incorporate it into your trading str
FREE

The indicator displays trend reversal in the form of arrows. The indicator does not change its values (is not redrawn) after a signal. The program notifies about arrows by means of a pop-up window, or sending notification to e-mail. This is a multitimeframe instrument. Values of the indicator may be displayed from higher timeframes.
Parameters Time-frame - select time session; zero is the current timeframe (Time-frame cannot be lower than the current time interval). Bars - number of bars on the
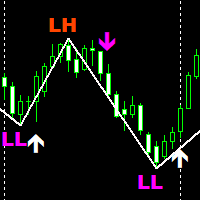
SMC Traders is a non-repaint indicator that is based on Price Action The indicator uses current market structure to predict future reversals. The indicator can be used with our free Market structure zig zag which can be found here: https://www.mql5.com/en/market/product/91579 Please note to find the HH AND HL CLINK ON LINK ABOVE Timeframes: 15 minutes for scalping 1 Hour for swing trading Purple Arrow look for sells in conjunction with LL White Arrow look for buys in conjunction with HL
FREE

Special offer : ALL TOOLS , just $35 each! New tools will be $30 for the first week or the first 3 purchases ! Trading Tools Channel on MQL5 : Join my MQL5 channel to update the latest news from me Supertrend Fakeout インジケーターは、従来の Supertrend インジケーターを改良したバージョンで、より信頼性の高いトレンドシグナルを提供することを目的としています。 Fakeout Index Limit や Fakeout ATR Mult といった高度な機能を取り入れることで、このインジケーターは短期的な価格変動や市場ノイズによって引き起こされる誤ったトレンド反転をフィルタリングするのに役立ちます。 MT5バージョンを見る: Supertrend Fakeout MT5 その他の製品を見る: すべての製品 動作の仕組み Supertr
FREE
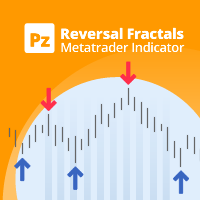
これは、ほぼ 10 年前に初めて公開された、私の有名な指標であるリバーサル フラクタルの最新版です。フラクタルの価格構造を調べて、市場で可能な反転ポイントを決定し、ファンダメンタルまたはテクニカル評価モデルをすでに持っているポジション トレーダーにタイミングを提供します。 [ インストールガイド | 更新ガイド | トラブルシューティング | よくある質問 | すべての製品 ] 反転フラクタルは長いトレンドを開始することができます インジケーターは非再描画です
あらゆる種類のアラートを実装します カスタマイズ可能な色とサイズ フラクタルは奇数のバーのフォーメーションであり、フォーメーションで最高または最低の中央バーであり、フラクタルのすべてのバーが閉じるとインジケーターが描画されるため、このインジケーターはリアクティブまたは遅延シグナルです。ただし、既存の方向性バイアスを持つトレーダーは、このインジケーターが非常に便利であり、初期のエントリーポイントを拾うことができます. このインジケーターは、煮詰めたシグナルインジケーターでも完全なトレーディングシステムでもありません。そのように評
FREE

RSI Entry Points is the upgrade of the standard RSI indicator to avoid lagging. Indicator draws the clouds and the arrows to have clear picture where price is and what to wait for. Why standard RSI is lagging? because mostly we do not use it correctly and it is with very weak visual flexibility, less informative. With my current upgrade I tried to Fix both problems same time and I got much better results and more exact entries than standard RSI has. I Made RSI line Dynamic, it gets more flexible
Nadaraya Watson Envelopeマルチカレンシースキャナー MT4 は、複数の通貨ペアと時間枠にわたる重要な反転シグナルを監視するための簡素化された方法を提供します。TradingViewでその正確な反転シグナルで知られている人気のインジケーターを基に構築されたこのスキャナーは、同じコアロジックをMT4互換の形式に適応させています。低時間枠での短期的な機会と高時間枠での強いトレンドシグナルに焦点を当て、トレーダーが市場の転換点に注意を払うのに役立ちます。 MT5バージョンはこちらで入手できます: Nadaraya Watson Envelope Multicurrency Scanner MT5 詳細なドキュメントはこちらをクリックしてください: ドキュメント 主な機能: インジケーターの統合:Nadaraya Watson Envelopeインジケーターを使用し、価格行動の周囲に滑らかなエンベロープを計算します。トレーダーはLengthパラメーターを調整して考慮するバーの数を定義し、Bandwidthを調整して平滑化を制御し、Multiplierを設定してエンベロープ

"The trend is your friend" is one of the best known sayings in investing, because capturing large trendy price movements can be extremely profitable. However, trading with the trend is often easier said than done, because many indicators are based on price reversals not trends. These aren't very effective at identifying trendy periods, or predicting whether trends will continue. We developed the Trendiness Index to help address this problem by indicating the strength and direction of price trend
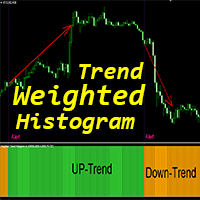
Crypto_Forex MT4用インジケーター「加重トレンドヒストグラム」、リペイント不要。
- 加重トレンドヒストグラムインジケーターは、標準的な移動平均線クロスよりもはるかに効果的です。 - トレンド戦略を好むトレーダー向けです。 - インジケーターの色は2色です。黄色は弱気な下降トレンド、緑色は強気な上昇トレンドです(色は設定で変更できます)。 - モバイルとPCの両方でアラート機能を搭載しています。 - このインジケーターは、プライスアクション、スキャルピング、モメンタムトレード、その他のインジケーターなど、他の取引手法と組み合わせるのに最適です。
高品質のトレーディングロボットとインジケーターをご覧になるにはここをクリックしてください! これは、このMQL5ウェブサイトでのみ提供されるオリジナル製品です。

Trend Guardian Pro - Advanced Trend Prediction Indicator Trend Guardian Pro is the result of collaborative work by a team of professional mathematicians, analysts, and traders. The indicator is based on years of market data analysis and employs cutting-edge mathematical modeling techniques for early detection of potential trend changes. Key Features: Early prediction - the indicator analyzes multiple market factors to identify signs of trend changes before they become apparent Comprehensive an

Bitcoin Predictor は、価格の反転を予測するために設計された矢印ベースのインジケーターです。 このツールは、BTC やその他の暗号で使用できます。また、通貨にも使用できます。ただし、どのペアが最も効果的かを最初に確認する必要があります。一部のペアと時間枠は、非常にうまく機能します。ご自身で自由にテストして確認してください。 インジケーターは非常に使いやすいです。必要なのは矢印に従うことだけです。インジケーターは、スタンドアロン システムとして機能することも、既に使用しているシステムの一部として機能することもできます。 信号は再描画しないでください! 購入後ご連絡ください!私の取引の推奨事項とボーナスをあなたと共有します!
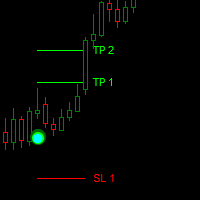
Dark Point is an Indicator for intraday trading. This Indicator is based on Trend Following strategy, also adopting the use of the atr to determine the right volatility. We can enter in good price with this Indicator, in order to follow the strong trend on the current instrument. If you love Dark Point, consider adding some power: Dark Power
Key benefits
Easily visible take profit/stop loss lines Intuitive directional points/arrows by colors Useful statistics , which indicate the win ra
FREE

This indicator uses Donchian channel and ATR indicators. This trend tracking system uses historical data to buy and sell. This indicator does not repaint. The point at which the signal is given does not change. You can use it in all graphics. You can use it in all pairs. This indicator shows the input and output signals as arrows and alert. Open long deals on blue arrows Open short deals on red arrows When sl_tp is set to true, the indicator will send you the close long and close short warnings.

Title: SMC Structure for EURUSD Description: This indicator is designed to map market structures based on Smart Money Concepts (SMC). It identifies Swing Structure, Internal Structure, Order Blocks, and Fair Value Gaps (FVG). The tool is optimized for performance to manage resources efficiently on the MetaTrader platform. Key Features: 1. Market Structure Mapping Identifies Major Swing Structure with BOS (Break of Structure) and CHoCH (Change of Character). Displays Internal Structure to visual
FREE

Buying the Dips Buying the Dips is a professional oscillator designed to identify market extremes and trend-based pullbacks across all markets and timeframes. Two adaptive quotient lines, visual trend clouds, and optional swing and scalping signals provide clear, non-repainting trading impulses for traders who want to identify oversold dips and overbought zones with precision. How It Works The indicator is built on an advanced quotient engine using high-pass filtering and adaptive normalization
FREE
本指標はSuperTrendの二次開発に基づいて、MA均線カスタムアルゴリズム、nrp、mtfの3つの指標を加重して機能を実現する組み合わせ指標を加えたものである。
バッチラインは2つの色に分けられています。オレンジ色は空いています。緑の代表が多いです。
SuperTrend指標は全ネット初の人工知能指数である。信号灯取引戦略。
人間の脳の不確定概念の判断、推理思惟方式を模倣し、モデルの未知または不確定な記述システム、及び強い非線形性、大きなヒステリシスの制御対象に対して、あいまいな集合と曖昧な規則を適用して推理し、横断的な限界または定性的な知識経験を表現し、人間の脳方式を模擬し、あいまいな総合判断を実行し、従来の方法では対処しにくい規則を推理する。型ぼかし情報問題。はっきりしないロジックは限界の不明瞭な定性的知識と経験を表現することに優れています。これは従属度の関数概念に助けを借りて、はっきりしない集合を区別して、はっきりしない関係を処理して、人間の脳を模擬して規則型推理を実施して、「排中律」の論理の破れから生じる様々な不確定な問題を解決します。
SuperTre
FREE

開発者ノート 私は11年以上の経験を持つ MQL4/5 開発者です。これまでインジケーターの販売を目的として活動してきたわけではありませんが、このシステムの安定したプラスの勝敗率(Rare Spear インジケーターを含む)には正直驚かされました。
そのため、本インジケーターを公開することに決めました。 すべてのロジック、構造、著作権は完全に私に帰属します。
いかなる保証も行いません — ご自身でテストし、ご自身の判断でご使用ください。 このインジケーターが他と違う理由 注意 — これは単なる視覚的な錯覚ではありません!
これは経験豊富な開発者によって作成された、実際に取引可能なエントリーとエグジットを示すインジケーターです。 多くのインジケーターは、ローソク足が確定した後に過去の足へ矢印が表示される視覚的錯覚の問題を抱えています。これは非現実的な利益計算や誤解を招く統計につながります。 本インジケーターはこの問題を完全に排除しています: エントリー矢印は新しいバーの始値でのみ表示 矢印は実際に取引可能な価格に表示 エグジット矢印は高値・安値ではなく、正確に計算された決済価格に表示 リ
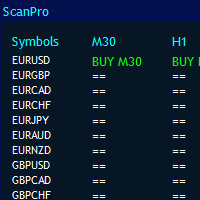
MT4 Universal Panel pro ex4ファイルを含むすべてのインジケーターとタイムフレーム用に設計されています。
それはあなたのコンピュータのパワーと最大10の時間枠に基づいて無制限のペアをスキャンすることができます。パネルのサイズは自動的に配置されます。
バッファによって任意のインジケータを呼び出すことができます。
これは、すべてのデフォルトおよびカスタムインジケーターで機能します。平観足、rsi、放物線、練行足、フラクタル、サポート抵抗、需給、発散、高値と安値の移動平均に簡単に使用できます。
すべての通貨に対して1つのウィンドウから操作できます。設定についてご不明な点がございましたらお問い合わせください。
これはmt4ダッシュボードであり、どのペアでも機能します。ペア名は以下のように入力するだけです。それは任意の外国為替インジケーターを呼び出し、そのシグナルバーをチェックします。
NS。パネル作業を行い、3ペアと複数の時間枠のみをスキャンする場合は、次のように入力します。
記号:EURUSD、GBPUSD、USDJPY
タイムフレーム:30、60、24

KT MACD Alerts は、MetaTrader に搭載されている標準の MACD インジケーターをベースにした、独自のカスタムバージョンです。以下の 2 つの重要なイベント発生時に、アラートを出し、チャート上に垂直線を描画します: MACD がゼロラインを上抜けたとき。 MACD がゼロラインを下抜けたとき。
主な機能 あらゆる時間足に対応したマルチタイムフレームスキャナーを内蔵し、それぞれの時間足における MACD の方向を確認できます。 MACD のゼロラインをまたぐクロスに注目した取引を行うトレーダーに最適です。 アラートと同時にクロスの位置に垂直線を描画し、視認性を高めます。 動作が非常に軽く、システムのメモリやリソースをほとんど消費しません。 MetaTrader が対応するすべての通知形式(ポップアップ、音声、モバイル、メールなど)に対応しています。
MACD の歴史 MACD(移動平均収束拡散法)は、テクニカル分析において非常に広く使われているインジケーターです。1970 年に Gerald Appel 氏によって開発され、価格トレンドの強さ・モメンタム・持
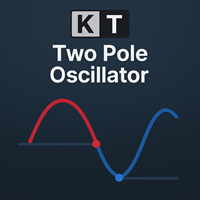
KT Two Pole Oscillator は、高度なスムージング手法を使用して、トレーダーが正確な市場シグナルを見つけられるように設計されたインジケーターです。偏差ベースの計算と独自の2極フィルター方式を組み合わせることで、視覚的に明確なシグナルを提供し、トレーダーが直感的に判断しやすくなっています。 この2極フィルターは適応性が高く、トレンド相場でもレンジ相場でも一貫したパフォーマンスを発揮するため、あらゆる市場環境に対応できる多用途なツールです。
特徴
2極フィルタリング: オシレーターのノイズを取り除き、相場のモメンタムとトレンド方向を鮮明に表示します。 買われすぎ/売られすぎの検出: 相場が極端な状態に達した際に明確なシグナルを示し、反転や調整の可能性を知らせます。 スケール範囲は1から-1: 明確なオシレーターのレベル設定により、特にゼロライン付近での誤信号を最小限に抑えます。 完全カスタマイズ可能: オシレーターの期間や色設定など、好みに合わせて自由に調整可能です。 多彩なアラート機能: MetaTraderのアラートやプッシュ通知を使って、画面を見ていなくても重要な
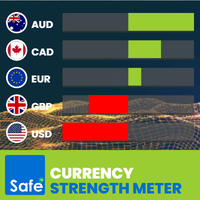
What Is the Currency Strength Meter? The Currency Strength Meter is an advanced yet easy-to-use indicator that measures the relative strength of 8 major currencies by analyzing their real-time performance across 28 currency pairs .
It visually ranks currencies from strongest to weakest, helping you: Spot high-probability trading opportunities
Match strong currencies against weak ones
Trade with confidence and precision
With just a glance at the dashboard, you'll know which currencies to trade –

このダッシュボードは、市場構造反転インジケーターで使用するためのアラートツールです。主な目的は、特定の時間枠での取消の機会と、インジケーターと同様にアラートの再テスト(確認)についてアラートを出すことです。ダッシュボードは、それ自体でチャート上に配置され、バックグラウンドで動作して、選択したペアと時間枠でアラートを送信するように設計されています。多くの人々が1つのMT4の複数のチャートで市場反転インジケーターを実行するのではなく、一度に複数のペアと時間枠を監視するためにダッシュを要求した後に開発されました。 M5、M15、M30、H1、H4、およびD1の時間枠でアラートを出します。もちろん、取引の場合と同様に、より高い時間枠が最も効果的です。
このダッシュボードは、市場構造反転インジケーターのアドオンとして設計されています。それは独立して機能し、マーケットリバーサルアラートインジケーターによって与えられたパターンと信号にアラートを出します。
ここでマーケットリバーサルアラートインジケーターを取得します:https:// www.mql5.com/en/market/product
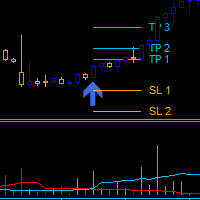
Dark Power is an Indicator for intraday trading. This Indicator is based on Trend Following strategy, also adopting the use of an histogram to determine the right power . We can enter in good price with this Indicator, in order to follow the strong trend on the current instrument. The histogram is calculated based on the size of the bars and two moving averages calculated on the histogram determine the direction of the signal
Key benefits
Easily visible take profit/stop loss lines Intui

Range Explosionについて Range Explosionは、市場のレンジを検出し、正確なサポートとレジスタンスゾーンを描画し、ブレイクアウトの機会を正確かつスタイリッシュに特定するための、強力で無料の取引ツールです。
Break Out Explosionプロジェクトの一部として、初心者からプロフェッショナルトレーダーまで信頼できる高度なビジュアルソリューションを提供します。 この製品のMT5バージョンはこちらで入手できます:
https://www.mql5.com/en/market/product/153004
ブレイクアウト取引の概念に興味がある場合は、主要トレンド方向のトレンドラインブレイクアウトを検出するための高度なツールをご覧ください:
https://www.mql5.com/en/market/product/155132 このインジケーターの矢印に基づいて取引を行うEAが欲しいですか? 下のリンクから $30 で直接ジョブを作成すれば、私が作成いたします:
https://www.mql5.com/en/job/new?prefered=eeecad
FREE
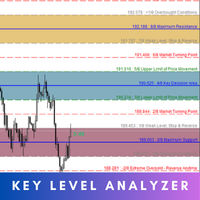
Key Level Analyzer – Know Better, Trade Smarter Key Level Analyzer is a powerful trading tool designed to provide precise market insights by identifying high-probability price zones , market turning points , and key decision areas . Unlike traditional indicators, it uses a smart algorithm to dynamically calculate support, resistance, and balance zones, helping traders make informed, data-driven decisions . MT5 Version - https://www.mql5.com/en/market/product/132810/ With real-time updates, mul

Delta Swing Pro - マルチタイムフレーム・トレンド同調システム 製品コンセプト:時間足の矛盾を解消し、真の同調を捉える トレードにおける最大の障壁の一つは、時間足ごとの「方向性の矛盾」です。短期足が上昇を示していても、長期足が下降トレンドにある場合、そのノイズは多くの不必要な損失を招きます。 Delta Swing Pro は、異なる時間足のベクトルを「シンクロ(同調)」させるために設計されました。複数の時間軸が同じ方向へ動き出す「確率的優位性の高い局面」のみを特定し、迷いのない環境認識とエントリー判断を提供します。 5つの核心的な導入メリット 1. トレンド・コンセンサス機能(マルチタイムフレーム分析の最適化) 独自開発のアルゴリズムが、監視している全ての時間足のトレンドベクトルを内部で照合します。 技術的利点: 「短期は買い、長期は売り」といった矛盾を自動的に整理し、大きな資金の流れ(スマートマネー)と一致した方向のみを抽出します。 結果: 複雑なMTF分析をシンプル化し、一貫性のある戦略的な意思決定が可能になります。 2. 視覚的ステータスによる「待つ規

The Forex Master Pattern is an alternative form of technical analysis that provides a framework which will help you to find and follow the hidden price pattern that reveals the true intentions of financial markets. This algorithm here does a good job detecting the Phase 1 of the Forex Master Pattern cycle, which is the contraction point (or Value).
On Phase 2 we get higher timeframe activation (also called Expansion), which is where price oscillates above and below the average price defined
M1 Golding — This is an easy to use trading system. It is an arrow indicator designed for the M1-M5 time frame. The indicator can be used as a standalone scalping system, as well as as part of your existing trading system. Bonus: When you buy the indicator, you get a gift - Trend Arrow Super I also provide an additional trend filter indicator absolutely free of charge - Filter The combination of these indicators can help you make your trading easier and more accurate.
Indicator Parameters: Tre

Gold Pro Scalper
Precise entry points for currencies, crypto, metals, stocks, indices! Indicator 100% does not repaint!!!
If a signal appeared, it does not disappear! Unlike indicators with redrawing, which lead to loss of deposit, because they can show a signal, and then remove it.
Trading with this indicator is very easy.
Wait for a signal from the indicator and enter the deal, according to the arrow
(Blue arrow - Buy, Red - Sell).
I recommend using it with the Trend Filter (download

THE ONLY CURRENCY STRENGTH INDICATOR THAT IS BASED ON PRICE ACTION. DESIGNED FOR TREND, MOMENTUM & REVERSAL TRADERS
This indicator reads price action to confirm trend and strength . Advanced multi-currency and multi-time frame indicator that shows you simply by looking at one chart, every currency pair that is trending and the strongest and weakest currencies driving those trends.
For full details on how to use this indicator, and also how to get a FREE chart tool, please see user manual HERE

The intention of the dashboard is to provide a quick overview of the daily, weekly and monthly range of configured assets. In "single asset mode" the dashboard shows you possible reversal points directly in the chart, thus making statistics directly tradable. If a configured threshold is exceeded, the dashboard can send a screen alert, a notification (to the mobile MT4) or an email. There are various ways of using this information. One approach is that an asset that has completed nearly 100% of

手動描画なしで数秒で明確なマーケット構造を取得!
HTF 自動サポート&レジスタンスインジケーター は、チャート上に主要なサポート・レジスタンスレベルを自動的に表示します。これらのレベルは高い時間足(HTF)に基づいており、短期的なランダムラインよりもはるかに信頼性があります。 主な機能: 最強のサポート・レジスタンスゾーンを自動検出 マルチタイムフレーム分析:より正確なレベルのため高時間足を選択 即時認識のための色分けされた明確なゾーン 主観的ミスなし – 固定ルールに基づいて客観的に計算 全市場に最適化:FX、株価指数、商品、暗号通貨 即使用可能 – 最適なデフォルト設定 トレーダーの利点: 市場が反転または反応する可能性が高い場所を素早く把握 強いゾーンでのみ取引して悪いセットアップを回避 時間を節約し、一貫した分析レベルで命中率を向上 スキャルパー、デイトレーダー、スイングトレーダーに最適 使用のヒント: 設定で好みの高時間足を選択(例:H4、D1、W1) ゾーンをプライスアクションやローソク足パターンと組み合わせ 市場の反応を観察し、計画的に取引
FREE
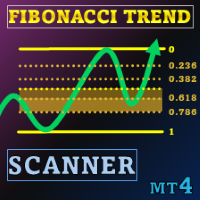
スペシャルオファー : ALL TOOLS 、1つあたり $35 のみ! New tools will be $30 for the first week or the first 3 purchases ! Trading Tools Channel on MQL5 : Join my MQL5 channel to update the latest news from me ボラティリティの高いトレード環境では、パワフルで直感的な分析ツールがあれば、チャンスを素早く捉えることができます。Fibonacci Trend Scanner は従来のFibonacciインジケーター機能とSuperTrendを統合しただけでなく、通貨ペアのスキャン、マルチタイムフレームのモニタリング、そしてトレンドが強気から弱気へ(またはその逆)転換する際にインテリジェントアラートを出す機能など、機能を拡張しています。 See more MT5 version at: Fibonacci Trend MT5 Scanner See more products at: A

このアルゴリズムは、指標 UPD1 Trend Direction に基づいて減少したボラティリティのゾーンを検出し、指標 UPD1 Volume Box に基づいて最大水平ボリュームを構築します。 原則として、蓄積を終了するときに強い傾向の動きが発生します。 価格が累積を残している場合は、その最大水平ボリューム(POC)をテストすることができます。 スマートアラートは設定で使用できます。
入力パラメータ 。
基本設定 。 Bars Count – 指標が機能する履歴バーの数 。 Timeframe Flat - フラットが検索され、クラスターが構築されている時間枠の選択。 デフォルトでは、それは常に現在のものです。 Data Source - 見積期間の選択。 自動的に検出(最適) 。 Vertical Step - 密度と垂直精度に影響します 。 Period - オシレーターの周期を選択します 。 Start Flat After Bar - フラットを描画を開始する傾向の終了後に無視するろうそくの数 。 Minimal Flat Bars - フラット内のキャンドルの最小
FREE

このインジケータは、2本目のローソク足が1本目のローソク足の内側にあるとき、つまり限界 を超えていないときに、チャート上にシグナルを表示します。 このローソク足パターンはインナーバーと呼ばれます。 このパターンはピン・バーやテイクオーバーほどポピュラーではありませんが、一部のトレーダーによって使用されることがあります。 トレンド(2本の移動平均線)と反転(RSIとボリンジャーバンド)によるフィルターが可能です。 多通貨パネルが利用可能です。その助けを借りて、あなたは簡単にチャートを切り替えることができます。
取引パターン トレンドの再テスト。 偽ブレイクアウト。 その他 。
EURUSD, GBPUSD, XAUUSD, ... M15、M30、H1。
入力パラメータ 。
基本。 Bars Count – インジケータが動作する履歴バーの数。 Min Ratio Candles - 最初のローソク足と2本目のローソク足の最小比率。 Calc Mode - 内部バーの決定方法(HL、OC、HLOC)。
フィルター 。 Filter 1 Trend And Reverse –

相対力指数 (RSI) インジケーターのマルチ通貨およびマルチタイムフレームの変更。パラメータで任意の通貨とタイムフレームを指定できます。また、パネルは買われすぎレベルと売られすぎレベルを越えたときに通知を送信できます。ピリオドのあるセルをクリックすると、このシンボルとピリオドが開きます。これが MTF スキャナーです。
ダッシュボードをチャートから非表示にするキーは、デフォルトでは「D」です
通貨強度メーター (CSM) と同様に、ダッシュボードは、指定された通貨を含むペア、またはその通貨を基本通貨とするペアを自動的に選択できます。インジケーターは、「ペアのセット」で指定されたすべてのペアで通貨を検索します。他のペアは無視されます。そして、これらのペアに基づいて、この通貨の合計 RSI が計算されます。そして、その通貨がどれだけ強いか弱いかを確認できます.
パラメータ RSI Period — 平均期間。 RSI Applied price — 価格タイプ。 Clear the chart at startup — 起動時にチャートをクリアします Set of Pairs

巻き込むローソク足パターンを表示するインジケーター。 設定では、巻き込むタイプ(ボディ、シャドウ、組み合わせ)を指定できます。 トレンド(2つの移動平均)と反転(RSIとボリンジャーバンド)でフィルタリングすることができます。 これは非常に人気のある価格行動パターンです。 マルチ通貨ダッシュボードが利用可能です。 それを使用すると、簡単にチャートを切り替えることができます。
取引パターン: トレンド別再テスト 。 偽のブレイクアウト 。 注文ブロック 。 その他 。
EURUSD, GBPUSD, XAUUSD, ... M15, M30, H1 。
入力パラメータ 。
メイン 。 Bars Count – インジケータが動作する履歴バーの数 。 Calc Mode – 巻き込みのタイプを選択します。 3 Lines Strike (Close overlap First Open) 。
PPR (Close overlap High) - クローズオーバーラップ高 。 High overlap High - 高重複高 。 Close overlap Open - 閉じるオ

流動性ショック検出機能(XAUUSD 1分足版) =======================================================
概要: ----------------------------------- 急激な価格変動によって生じた機関投資家の流動性ゾーンを検出し、複数時間枠のトレンド分析を提供します。
詳細: ------------------
流動性ショック検出機能は、機関投資家の活動を示唆する重要な価格変動を識別します。大規模な市場参加者がポジションを保有または決済すると、価格が頻繁に再訪する流動性ゾーンが形成されます。このインジケーターはこれらのゾーンを自動的に検出し、複数時間枠にわたるリアルタイムのトレンド分析を提供します。
仕組み
このインジケーターは、価格の変動速度とローソク足のサイズを監視し、急激な変動を検出します。大きな変動が発生すると、検証期間によってゾーンが維持されているかどうかを確認します。検証済みのゾーンはチャート上に表示され、ゾーンの強さと方向を明確に示すマーカーが視覚的に表示されます。
主な機能
-
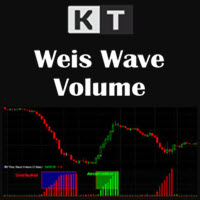
KT Weis Wave Volumeは、現在の市場トレンドと価格変動の方向に基づいたテクニカル指標です。このインジケーターは出来高に基づいており、価格の上昇と下降に対する累積出来高をチャート上に表示します。
さらに、インジケーターウィンドウには、緑色の波と上昇する赤い波のヒストグラムが表示されます。
緑色は上昇の動きを示しており、価格が上がるほど緑の出来高も増加します。赤色は下降の波を示しており、価格が下がるにつれて赤い出来高も増加します。インジケーターが描く各波を分析することで、市場の変動状態を深く理解することができます。
主な機能
あらゆる市場における価格波と出来高を表示します。 トレンドの方向性と強さを把握するのに役立ちます。 設定やカラースキームを自由にカスタマイズ可能です。 すべての時間足で使用可能です。
KT Weis Wave Volumeの仕組み Weis Wave Volumeでは、各波における出来高を合算して表示します。これにより、交互に現れる波の累積出来高を棒グラフとして視覚化できます。
累積された出来高こそが、Weis Waveチャートのユニークな
説明
Market Phase Analyzer は、市場の3つの主要フェーズである 蓄積(Accumulation) 、 操作(Manipulation) 、 分配(Distribution) を識別するために設計された高度なインジケーターです。
自動セッション分析を通じて アジアボックス(Asia Box) を描画し、重要なレベルの上下でのスイープ動作を検出し、 ATRフィルター を使用して反転を確認し、誤ったシグナルを減らします。 主な機能 カスタマイズ可能なアジアセッションのボックスをハイライト表示。 強気または弱気のスイープを自動検出。 シグナル確認のためのオプションATRフィルター。 日足始値ラインを表示。 矢印とテキストによる視覚的シグナル表示。 再初期化時のオブジェクト自動削除。 取引上の利点 潜在的な反転ポイントとトレンドフェーズを特定するのに役立つ。 スマートマネーコンセプトや高度なプライスアクション戦略に対応。 デイトレードおよびスイングトレードに最適化。 時間、色、レベルを完全にカスタマイズ可能。 推奨使用方法
M15、M30、H1チャートでの使用を推奨。市
FREE

Good old UT BOT converted from TradingView script by ' QuantNomad ', initially by ' Yo_adriiiiaan ' and ' HPotter ' - so you can bet this is powerful tool. If you know, you know. This is top of the line, while keeping it really simple.
Main function: trend identification with trend switch points , created by EMA(source) and ATR -source is CLOSE PRICE with option to use HEIKEN ASHI chart instead, for this you need "Heiken Ashi" indicator - its available as free download by MetaQuotes
One of th
FREE
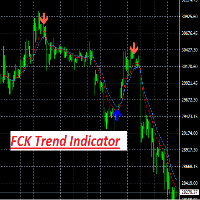
FCK Trend Indicator is an indicator for determining the current direction of price movement and reversal points. The indicator will be useful for those who want to see the current market situation better. The indicator can be used as an add-on for ready-made trading systems, or as an independent tool, or to develop your own trading systems. FCK Trend Indicator indicator, to determine the reversal points, analyzes a lot of conditions since the combined analysis gives a more accurate picture of t

Scalping Binary Option Pro is an arrow indicator that is completely free from repainting . Although it may work incorrectly in strategy testers, its signals remain relevant for real trading. Signals: A red arrow pointing down indicates a selling opportunity, while a green arrow pointing up indicates a buying opportunity. Settings: All you need to adjust are the colors of the signal arrows and the sound alert for signal notifications. Usage Recommendations: It is best to use the indicator on hig
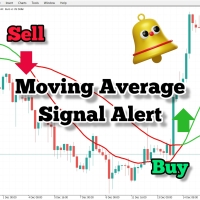
取引戦略で移動平均を使用している場合、このインジケーターは非常に役立ちます。 2つの移動平均がクロスするとアラートを提供し、音声アラートを送信し、取引プラットフォームに通知を表示し、イベントに関する電子メールも送信します。 独自の取引スタイルと戦略に適応するための簡単にカスタマイズ可能な設定が付属しています。
調整可能なパラメーター: 高速MA 遅速MA メール送信 音声アラート プッシュ通知
他の製品もチェックしてください: https://www.mql5.com/en/users/8587359/seller
それらに関する質問やフィードバックがある場合は、コメントを残すか、プライベートメッセージを送信してください。
成功した取引を!
FREE

We mark the fair value gap (FVG) and wait for the price to reach that zone, but sometimes it reverses before getting there. This can happen because we didn't notice the Balanced Price Range (BPR). My tools will enhance your analysis by displaying everything on the chart, helping you identify potential price reversal areas so you can make informed decisions about when to enter the market. MT5 - https://www.mql5.com/en/market/product/119228/ So, what is BPR or Balanced Price Range? A Balanced Pr

RSI divergence indicator finds divergences between price chart and RSI indicator and informs you with alerts (popup, mobile notification or email). Its main use is to find trend reversals in the chart. Always use the divergence indicators with other technical assets like support resistance zones, candlestick patterns and price action to have a higher possibility to find trend reversals. Three confirmation type for RSI divergences: RSI line cross 50 level (doesn't repaint) Price returns to
FREE

Was: $299 Now: $99 Supply Demand uses previous price action to identify potential imbalances between buyers and sellers. The key is to identify the better odds zones, not just the untouched ones. Blahtech Supply Demand indicator delivers functionality previously unavailable on any trading platform. This 4-in-1 indicator not only highlights the higher probability zones using a multi-criteria strength engine, but also combines it with multi-timeframe trend analysis, previously confirmed swings
This indicator was specially developed to support the powerful day trading strategy described in the book "The Price in Time". The NTZ BOX indicator automatically creates: The Day separators The No Trading Zone divided with the Green Box, the Peach Box and the Turqoise Box Extensions of the long and short Take Profit levels The Yellow Box to display the range of the Asian session The Money Manager for a perfect Position Sizing calculated on your risk percentage Using the NTZ BOX indicator will e
Top Bottom Tracker は、洗練されたアルゴリズムに基づき、市場のトレンドを分析し、トレンドの高値と安値を検出することができるインジケーターです / MT5バージョン 。
価格は500$に達するまで徐々に上昇します。次の価格 --> $99
特徴 リペイントなし このインジケーターは
新しいデータが到着してもその値を変更しません
取引ペア すべてのFXペア
時間枠 すべての時間枠
パラメーター ==== インジケータの設定
設定パラメータ // 40 (値が高いほど、シグナルは少なくなりますが、より正確です)
上レベル値 // 80 (上水平線の値)
下限値 // 20 (下限水平線の値)
インジケータ計算バー // 3000 (何本分のインジケータを計算するか。0を指定すると、全てのバーに対してインジケータを計算します)
==== アラーム設定
ポップアップアラート // true (端末にアラームを表示)
メールアラート // true (アラームをメールで通知)
アラート時間間隔 // 10 (アラーム間隔 (分))
警告
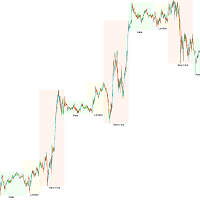
トレーディングセッション KillZone — マーケットタイミングの力を解き放つ
成功するトレーダーが知っている真実、それは「タイミングがすべて」ということです。各取引セッションには異なる活動レベル、ボラティリティ、チャンスがあります。これらを明確に把握し活用できるように、私たちは Trading Session KillZone インジケーター を開発しました。 このインジケーターはアジア、ロンドン、ニューヨークのセッションのアクティブ時間を強調表示し、市場が最も活発なタイミングを完全に把握できます。表示のカスタマイズも可能で、特定のセッションを表示/非表示、名前の追加・削除、色の変更、チャート上に表示する KillZone 数の設定などができます。 プロのヒント: KillZone トレーディングの力を最大限に引き出すには、適切なブローカーも必要です。そのため、私は IC Markets を推奨します。信頼できる ECN ブローカーで、超低スプレッド(0.0 pips〜)、高速約定、深い流動性を提供します。IC Markets なら、このインジケーターが示すチャンスを最
FREE

This unique multi-currency strategy simultaneously determines the end of the trend, entry points and the expected take profit levels for each trade. The indicator can determine entry points on any trading period from M1 to D1. For the convenience of users, the indicator renders the entry point (in the form of an arrow), recommended take profit levels (Fast Take Profit, Middle Take Profit, Main Take Profit, Global Take Profit) and the Stop Loss level. The detailed guide on how to use the indicato

This scanner is for showing Cross of various TDI elements: PriceLine, Trade Signal Line and Market Base Line And for getting alerts, so you can be prepared for finding good trade setups before they happen. It also shows TDI signals, trend, volatility and different timeframe alignment.
Detailed blog post:
https://www.mql5.com/en/blogs/post/759050
Features: Show TDI Signal and Trend Show Volatility & Overbought/Oversold Show cross between: PriceLine & TSL PriceLine & MBL MBL & TSL PriceLine and

Nas100 killer V2 (See video of how we test the indicator live) 1000% non-repaint indicator appears on current candlestick. Timeframes: M5, M15, M30, H1, H4. Works on pairs such as (NAS100, US30, SPX500, and Gold) The indicator is strictly for scalping do not hold trades for too long. Orange arrows look for selling opportunities. Light Blue arrows look for buying opportunities.
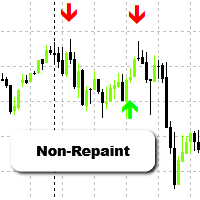
Spartan Arrows – Non-Repainting Buy/Sell Signals Spartan Arrows is a powerful MT4 indicator that delivers accurate buy and sell arrows directly on your chart. Built for traders who want clarity and precision, it filters out market noise and provides only high-probability signals. Once an arrow appears, it does not repaint – giving you the confidence to trade without second-guessing your entries and exits. Key Features Clear buy/sell arrows for instant decisions Non-repainting and non-lagging si

チャート上にフィボナッチレベルを手動で描画することにうんざりしていませんか?取引における主要なサポートとレジスタンスのレベルを特定する便利で効率的な方法をお探しですか?これ以上探さない! 自動フィボナッチ レベル を実行する究極の MetaTrader 4 インジケーターである DrawFib Pro の紹介 チャート上に描画し、これらのレベルを突破したときにタイムリーにアラートを提供します。 DrawFib Pro を使用すると、取引戦略を強化し、時間を節約し、より多くの情報に基づいた意思決定を行うことができます。 私のフィボナッチベースのインジケーター: WH Advanced Gartley Pattern MT4 || WH Price Wave Pattern MT4 主な特徴:
自動化 フィボナッチ描画. カスタマイズ可能 パラメータ. 正確な そして 信頼性のある. リアルタイム アラート. ユーザー フレンドリー インターフェース . DrawFib Pro は、チャート上でフィボナッチを自動描画するための効率的で信頼性が高く、使いやすい方
FREE

The Super Arrow Indicator provides non-repainting buy and sell signals with exceptional accuracy. Key Features No repainting – confirmed signals remain fixed Clear visual arrows: green for buy, red for sell Real-time alerts via pop-up, sound, and optional email Clean chart view with no unnecessary clutter Works on all markets: Forex, gold, oil, indices, crypto Adjustable Parameters TimeFrame Default: "current time frame" Function: Sets the time frame for indicator calculation Options: Can be set

MT5版 | Trend Monitor VZインジケーター | Owl Smart Levelsインジケーター | Owl Smart Levels戦略 | FAQ エリオット波理論は 、価格チャート上の波の視覚的モデルに依存している金融市場のプロセスの解釈です。 Valable ZigZagインジケータは、取引の決定を行うために使用することができる市場の波の構造を表示します。 Valable ZigZag indicatorはより安定しており、古典的なZigZag indicatorのように方向を変えることはなく、トレーダーを誤解させます。 これは、指標波の構築にフラクタルを使用することによって達成される。 Telegram チャット: @it_trader_chat 新しい Expert Advisor Prop Master - 取引ターミナルでテストしてください https://www.mql5.com/ja/market/product/115375
Valable ZigZagは、主にトレンド指標です 。 これは、トレーダーが取引すべき主な方
FREE
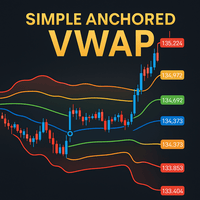
Simple Anchored VWAP is a lightweight yet powerful tool designed for traders who want precise volume-weighted levels without complexity.
This indicator lets you anchor VWAP from any point on the chart and instantly see how price reacts around institutional volume zones. MT5 Version - https://www.mql5.com/en/market/product/155321/
Join To Learn Market Depth - https://www.mql5.com/en/channels/suvashishfx Using VWAP bands and dynamic levels, the tool helps you understand where real buying and s
FREE
Special offer : ALL TOOLS , just $35 each! New tools will be $30 for the first week or the first 3 purchases ! Trading Tools Channel on MQL5 : Join my MQL5 channel to update the latest news from me SuperTrend by Kivanc Ozbilgic with Scanner をご紹介します。これは、マーケットトレンドに先んじるための多機能で強力なツールで、カスタマイズ可能な機能とリアルタイムのアラートが備わっています ATR の計算方法は、柔軟に対応するために RMA (相対移動平均)と SMA (単純移動平均)から選べます。デフォルト設定では、 ATR 期間が10、乗数が3に設定されており、 SuperTrend は効率的に買いと売りのシグナルを識別します。 組み込みのスキャナーとアラートシステムは、複数の通貨ペアやタイムフレームを監視し、リアルタイムの
FREE

** All Symbols x All Timeframes scan just by pressing scanner button ** - Discount : it is not 50$, it is just 39$. *** Contact me to send you instruction and add you in "Head & Shoulders Scanner group" for sharing or seeing experiences with other users. Introduction: Head and Shoulders Pattern is a very repetitive common type of price reversal patterns. The pattern appears on all time frames and can be used by all types of traders and investors. The Head and Shoulders Scanner in
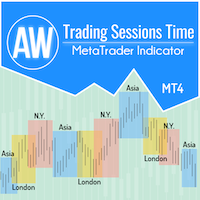
トレーダーが市場のパフォーマンスに関するデータを取得し、より適切な取引戦略を立てる際の利便性のために、当社は取引セッションインジケーターを開発しました。さまざまな取引所の営業時間は、市場活動や取引量に影響を与えるため、取引に影響します。これらの要因によって、さまざまな商品のボラティリティと取引機会が決まります。 AW トレーディング セッション インジケーターは、アジア、ロンドン、ニューヨーク市場の取引時間を表示します。トレーダーは、より良い体験のために、さまざまなタイム ゾーンを表示または非表示にすることができます。チャートでは、セッションの終了までの時間と、取引セッションのサイズを確認できます。チャート上のデータの表示には、さまざまなスタイルの取引チャートに適した柔軟なグラフィック調整機能があります。
その他の製品 -> こちら
利点:
アジア、ロンドン、ニューヨークの取引セッションを表示します。 必要に応じてセッションサイズを数字で表示します。 オンにすると、取引セッションの終了までの時間が表示されます。 取引セッションは個別に無効にすることができます。 チャート上のセッシ
FREE

短い説明 G3D Full Confluence は、**スマートマネーコンセプト(SMC)**と高度なテクニカル分析を融合させたエリート向けインジケーターです。強力なマルチタイムフレームの根拠に基づき、 オーダーブロック(OB) 、 フェアバリューギャップ(FVG) 、 RSIダイバージェンス を精密に特定します。 インジケーターの概要 プロフェッショナルな精度とチャートの明瞭さを求めるトレーダーのために設計された G3D Full Confluence は、相場のノイズを徹底的に排除します。機関投資家のロジックとボリュームの裏付けを組み合わせることで、複数の根拠が一致した高精度なシグナルのみを配信します。 主な機能: オーダーブロック(OB)の自動検知 : 大きな価格変動の起点となる機関投資家の供給・需要ゾーンを特定します。 フェアバリューギャップ(FVG)の識別 : 価格の不均衡(リクイディティゾーン)を検出し、市場が回帰しやすいターゲットを可視化します。 スマートRSIダイバージェンス : 価格とモメンタムの乖離から、トレンドの終焉や反転の兆しをいち早く捉えます。 マルチタイム
FREE

Did You Have A Profitable Trade But Suddenly Reversed? In a solid strategy, exiting a trade is equally important as entering.
Exit EDGE helps maximize your current trade profit and avoid turning winning trades to losers.
Never Miss An Exit Signal Again
Monitor all pairs and timeframes in just 1 chart www.mql5.com/en/blogs/post/726558
How To Trade You can close your open trades as soon as you receive a signal
Close your Buy orders if you receive an Exit Buy Signal. Close your Sell orders if

Consolidation Zone Indicator is a powerful tool designed for traders to identify and capitalize on consolidation patterns in the market. This innovative indicator detects consolidation areas and provides timely alerts when the price breaks above or below these zones, enabling traders to make informed trading decisions. MT5 Version : https://www.mql5.com/en/market/product/118748 Join To Learn Market Depth - https://www.mql5.com/en/channels/suvashishfx
Key Features:
1. Consolidation Detecti
FREE
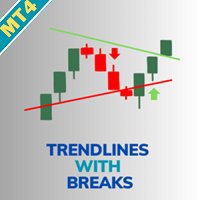
取引のブレイクアウトを強化するために、Trendlines with Breaks by LuxAlgo MT5を使用してください。これは、ピボットベースの革新的なインジケーターで、動的なトレンドラインを自動的に描画し、リアルタイムのブレイクアウトを強調します。TradingViewの人気LuxAlgoスイートから派生し、そこで100,000以上の使用とポジティブレビューを集め、サポート/レジスタンスレベルの検出精度で評価されています。RedditやYouTubeなどの取引コミュニティで、非再描画オプションとカスタマイズ可能なスロープで称賛され、このツールは外汇、株式、暗号トレーダーにトレンド反転と継続を捉える力を与え、ユーザーはエントリータイミングの改善と偽信号の減少を報告—ボラティル市場で勝率を10-20%向上させることが多いです, スペキュラティブな動きではなく確認されたブレイクアウトに焦点を当てることで。その利点には、アグレッシブなエントリーのためのブレイクアウトポイントの正確な識別、市場条件に適合する適応型トレンドラインの急峻度、常時監視なしで先を行く統合アラートが含まれ、ス

もちろん、こちらが日本語への翻訳です: "このインジケーターは、バイストラ・パターン理論に基づいてエントリーを検出し、エントリー値を提供し、ターゲットとストップのレベルでリミットオーダーを配置します。これにより、リスクの割合を計算できます。 注意事項: このインジケーターにはEAで使用できるバッファがあります。 この製品を使用する際には、良好なマネーマネジメントを実践することが重要です。 タイムフレームを変更すると、 インジケーターは前回のセッションで使用したテンプレートを保存します。 この方法を学ぶための書籍が必要な場合は、購入後にお知らせいただくか、ご購入後にご意見をお寄せください。 パラメーター: システムビジュアルを使用 - この製品の視覚的なテーマを有効/無効にします。 スピードに関連 - 最後の波の速い動きのみでパターンを検出するを有効/無効にします。 最後のキャンドルカウンターを表示 - キャンドルタイマーを有効/無効にします。 キャンドルカウンターの色 - キャンドルタイマーのテキストの色。 上昇パターンの色 - 上昇パターンの色。 下降パターンの色 - 下降パターンの
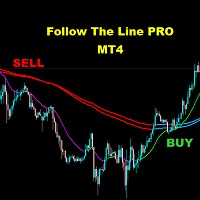
FOLLOW THE LINE (PRO VERSION) This powerful indicator is the full and complete version of my free indicator called "Follow The Line". IT IS BASED ON the popular maxim that: "THE TREND IS YOUR FRIEND" It gives alarms and alerts of all kinds. IT DOES NOT REPAINT and can be used for all currency pairs and timeframes.
AVOID FALSE SIGNALS:
BUY ONLY when price closes above the green line and the green line is above the blue channel.
SELL ONLY when price closes below the pink line and the pink line i

スマートサポート&レジスタンスインジケーター スマートサポート&レジスタンスインジケーターは、複数の時間枠で重要なサポートおよびレジスタンスレベルを自動的に識別し、トレーダーが情報に基づいた意思決定を行うのをサポートするために設計されています。このツールは、指定された回顧期間内で最もテストされたレベルに基づいて、最も高いおよび最も低い価格ポイントを効率的に計算し、その後、これらのレベルの平均を計算してチャートに動的にプロットします。これにより、生成されるサポートおよびレジスタンスレベルは、ほとんどのサポートおよびレジスタンスインジケーターよりも信頼性が高くなります。また、フィボナッチリトレースメントレベルを価格目標として統合し、市場予測を強化するだけでなく、追加のサポートまたはレジスタンスレベルとしても機能します。 主な特徴: 自動サポートおよびレジスタンスレベル: 回顧期間内で最も重要なサポートおよびレジスタンスレベルを識別(デフォルト:200)。 カスタマイズ可能な時間枠: 1分(M1)から月次(MN1)までのすべての主要な時間枠をサポートし、各時間枠で正確にレベルをプロットできま
MetaTraderマーケットは自動売買ロボットとテクニカル指標を販売するための最もいい場所です。
魅力的なデザインと説明を備えたMetaTraderプラットフォーム用アプリを開発するだけでいいのです。マーケットでプロダクトをパブリッシュして何百万ものMetaTraderユーザーに提供する方法をご覧ください。
取引の機会を逃しています。
- 無料取引アプリ
- 8千を超えるシグナルをコピー
- 金融ニュースで金融マーケットを探索
新規登録
ログイン