YouTube'dan Mağaza ile ilgili eğitici videoları izleyin
Bir ticaret robotu veya gösterge nasıl satın alınır?
Uzman Danışmanınızı
sanal sunucuda çalıştırın
sanal sunucuda çalıştırın
Satın almadan önce göstergeyi/ticaret robotunu test edin
Mağazada kazanç sağlamak ister misiniz?
Satış için bir ürün nasıl sunulur?
MetaTrader 4 için teknik göstergeler - 9

BREAKOUT-SESSION-BOX LONDON EU US ASIA Open
watch the expectation of a volatile movement above or under the opening range We take the high of the range as Entry for a long trade and SL will be the low of the range and vice versa the low of the range as Entry for a short trade and the high for SL The size of the range is the distance to the TP (Take Profit) The range of the opening hours should not be larger than about 1/3 of the average daily range 4 breakout examples are already predefined:
FREE

Otomatik Bağlı VWAP'lar ile Ticaretteki İçgörüleri Keşfedin: Otomatik Bağlı VWAP'lar , ticaret dünyasında rehberiniz olarak hizmet eder. Bu göstergeler, kritik piyasa dönüm noktalarını belirler ve VWAP çizgilerini kullanarak grafiğinizde gösterir. Bu, bağlı VWAP stratejilerini kullanan tüccarlar için bir oyun değiştiricidir. Nasıl Çalışır? Yüksek Noktaları Tanımlama: Eğer mevcut mumun en yüksek fiyatı önceki mumun en yüksek fiyatından düşükse, Ve önceki yüksek, ondan öncekinden daha yüksekse, Bi
FREE

Allows multiple indicators to be combined into a single indicator, both visually and in terms of an alert. Indicators can include standard indicators, e.g. RSI, CCI, etc., and also Custom Indicators, even those purchased through Market, or where just have the ex4 file. An early alert is provided, say when 4 out 5 indicators have lined up, and a confirmed alert when all are in agreement. Also features a statistics panel reporting the success of the combined indicator by examining the current cha

Simetrik üçgen formasyon panosu, burada bulunan simetrik üçgen formasyon göstergesi tarafından çizilen simetrik üçgen formasyonları için birden fazla piyasayı ve zaman dilimini aynı anda izlemenizi sağlar: https://www.mql5.com/en/market/product/68709/ Simetrik üçgen modellerinin nasıl oluşturulduğu ve bunları takas etmek için izlenmesi kolay stratejiler hakkında daha fazla bilgi edinmek için yukarıdaki göstergeyi ziyaret edin.
Gösterge paneli bağımsız bir üründür ve göstergenin çalışmasını GE

** All Symbols x All Time frames scan just by pressing scanner button ** *** Contact me after the purchase to send you instructions and add you in "Harmonic Scanner group" for sharing or seeing experiences with other users. Introduction Harmonic Patterns are best used to predict turning point. Harmonic Patterns give you high win rate and high opportunities for trade in during one day. This indicator detects the best and successful patterns base on Harmonic Trading books . The Harmonic Patterns S

RSI divergence indicator is a multi-timeframe and multi-symbol indicator that help us find divergences between price chart and RSI indicator. Always use the divergence indicators with other technical assets like support resistance zones, candlestick patterns and price action to have a higher possibility to find trend reversals. This indicator will identify the peaks and troughs of both price and the RSI indicator. You can adjust the parameters to adjust the strength and weakness of these peaks a
FREE
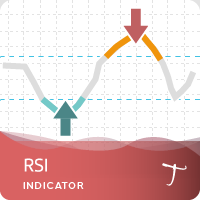
Tipu RSI Features 28 symbols, multi-time frame powerful Dashboard for the full market view Customizable Buy/Sell alerts, push alerts, email alerts, and visual on-screen alerts. Marked overbought and oversold levels. Three colors RSI that marks the normal, oversold and overbought levels. The relative strength index (RSI) is an oscillator devised by J. Welles Wilder in his famous book New Concepts in Technical Trading Systems in 1978.1 He also introduced Parabolic SAR (see Tipu Parabollic SAR Pane
FREE

Bu gösterge, Elliott dalga teorisi ile iki şekilde çalışır: Otomatik Çalışma: Bu modda gösterge, Elliott dalga teorisine uygun olarak grafikteki beş hareket dalgasını otomatik olarak tespit edecek ve tahminlerde bulunacak, potansiyel ters dönüş bölgelerini belirleyecektir. Ayrıca, önemli gelişmeler hakkında tüccarları uyarılar ve bildirimlerle bilgilendirebilme yeteneğine sahiptir. Bu otomatik işlev, Elliott dalga desenlerinin tanımlanması ve analiz sürecini basit hale getirir. Manuel Çalışma: B

Magic Moving is a professional indicator for the MetaTrader 4 terminal. Unlike Moving Average , Magic Moving provides better signals and is able to identified prolonged trends. In the indicator, you can set up alerts (alert, email, push), so that you won't miss a single trading signal. MT5 version can be found here You can test the program by downloading the demo version: https://www.mql5.com/en/blogs/post/749430 Advantages of the indicator Perfect for scalping. Generates minimum false signals.

No idea why demo is not working. you can check the GIF to see how it works.
Features With this scanner you can detect Candles which are below/above yesterday high/low lines. A pair's rectangle turns RED in dashboard if it is above the yesterday high, and rectangle turns GREEN in dashboard if it is below the yesterday low. It gives alerts in every 15m candle close. Contains a Dashboard which will help you to see all market pair's. It is possible to disable this sorting through to make it easie
Pipfinite creates unique, high quality and affordable trading tools. Our tools may or may not work for you, so we strongly suggest to try the Demo Version for MT4 first. Please test the indicator prior to purchasing to determine if it works for you. We want your good reviews, so hurry up and test it for free...we hope you will find it useful.
Combo Channel Flow with Strength Meter Strategy: Increase probability by confirming signals with strength Watch Video: (Click Here)
Features Detects ch
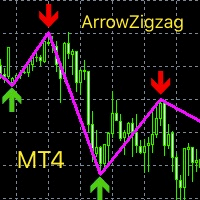
This index is based on the secondary development of zigzag, adding high and low point arrow indication, thickening the line and changing the color. Can be a good display of the current admission trading signals, current long or short. It can be combined with other indicators to determine the trading point, which has great reference value. Compared with the general trend index or oscillation batch standard, the accurate determination is higher from the perspective of historical data research and
FREE
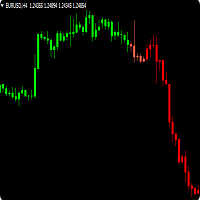
Trendfinder SMA are Colored candlesticks showing the trend based on two Simple Moving Averages and the slope of the slow moving average. This indicator will give you the color change on the next bar on the confirmation candle and will never repaint Trendfinder SMA is optimize to trade on any market and to be used trending and None trending markets. PLEASE TAKE NOTICE: For best results use this indicator as an extra tools after you have completed your regular analysis and use it for alerts base
FREE
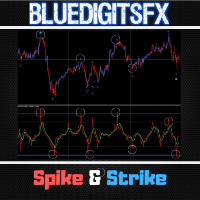
MT5 Version Available Here: https://www.mql5.com/en/market/product/50255
Telegram Channel & Group : https://t.me/bluedigitsfx
V.I.P Group Access: Send Payment Proof to our Inbox
Recommended Broker: https://eb4.app/BDFXOsprey
* Breakthrough Solution For Reversal Trading And Filtering With All Important Features Built Inside One Tool! BlueDigitsFx Spike And Strike Reversal is a mixed oscillator that mixes the readings of a number of indicators, which makes it potential to preci
Candle_Timer_and_Spread göstergesi, tek bir grafik üzerinde mumun sonuna kadar geçen süreyi ve seçilen semboller için spread ile birlikte fiyat değişim yüzdesini gösterir.
Geçerli zaman diliminde mumun sonuna kadar geçen süreyi ve günün açılış fiyatına göre yüzde olarak fiyat değişimini gösteren zamanlayıcı, varsayılan olarak grafiğin sağ üst köşesinde bulunur. Panel, seçilen semboller için geçerli fiyatın günün açılışına göre dağılımını ve yüzde değişimini gösterir. Panel varsayılan olarak s
FREE

This is an indicator for Quasimodo or Over and Under pattern. It automatically finds the swing points and can even place virtual trades with stop loss and take profit. Press the "Optimize" button to automatically find the most effective settings. The pattern consists of four legs A,B,C,D as shown in the pictures. Open and close prices of the virtual trades are Bid price but the statistics in Display Panel take current spread into account. Its parameters are explained below. Buffer - Pips distanc
FREE
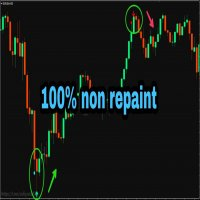
PLEASE NOTE You can customize the settings of K_period value, the oversold and the overbought value is customizable. You can change it as per your requirement. The accuracy will change as per your settings.
100% Non repaint indicator
Pre-alert (get ready) signals
Non-delay indications
24/7 signals
100% No lag
No recalculating The arrows wont repaint even if the signal fails, or you refresh or restart the mt4 Indicator is based on simple crossover strategy of main line and signal line
FREE
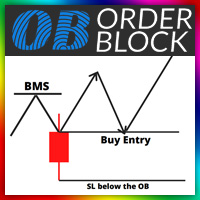
Orde Block Detector: The order block detector can automatically identify the breakthrough of the market structure. After the trend framework breaks through, the order block area can be drawn automatically. In order to draw the OB area more accurately, we also automatically find the candle on the left and right sides of the original candle according to its trading principle, and draw a more accurate ob area through more subtle quantitative rule judgment. Futures : 1. Customize the BMS color, and
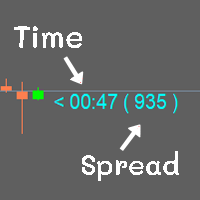
Show the time of candlesticks and spread. All data will be displayed in a rod. Can change color Can fix the size as needed
MT4 : Link https://www.mql5.com/en/market/product/102742 MT5 : Link https://www.mql5.com/en/market/product/102834
Most free code on various websites I didn't write it myself. I only do a little bit.
If you like it, please give 5 stars with it. Thank you.
FREE
Introducing the Engulfing Goddess Metatrader 4 (MT4) Indicator , a revolutionary tool designed for traders who seek to harness the power of candlestick patterns in their trading strategy. This indicator is built on the principles of engulfing candlestick patterns , a popular method used by successful traders worldwide. Our Engulfing Goddess Indicator stands out with its ability to detect various kinds of engulfing patterns . It employs a range of filters, providing you with a comprehensiv

Moving Average Trend Alert is a triple MA indicator that helps traders to identify potential market trends based on 3 MAs alignment and crossover.
Moving Average Trend Alert features: Customizable short-term, medium-term, and long-term MAs. Option to filter signals based on a minimum distance between moving averages to avoid premature MAs alignment. Optional Filter of signals with RSI indicator overbought/oversold levels. Optional Filter of signals with ADX indicator. Popup, email, and phone n
FREE
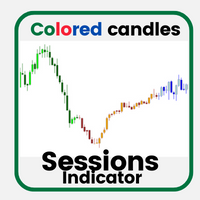
This indicator shows trading sessions using colored candles. It's made for volume profile and supply/demand traders to quickly see when specific candles are formed during different times or trading sessions.
Take a look at the screenshots for a usage example.
Core Features: Different colors for bullish and bearish candles, allowing users to distinguish between bullish/bearish candles.
FREE

Gösterge, gün içi aralığın yerel trendinin gücüne göre fiyat değişiminin dinamiklerini izlemenizi sağlar Önerilen süre: M5-H1 Price Channel PRO göstergesi yeniden çizilmiyor veya seviyeleri değiştirmiyor Gösterge ile ticaret yapmak çok kolaydır
Bir satış anlaşması nasıl açılır:
1. Yeni yerel fiyatın yüksek olmasını bekleyin 2. Fiyat kanalın ortasına doğru geri dönmelidir (yeşil çizgi) 3. Yeni mumdaki Sell izini açın 4. Stop Loss'u kanalın üst sınırının üzerine getirin (mavi çizgi) 5. Fi
FREE
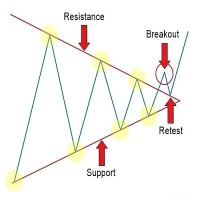
The indicator automatically plots significant trend lines and displays buy and sell signals. Signals are generated for reflection and breakdown from support and resistance lines. When a signal appears, the indicator displays it as an arrow of the specified color and also sends the message type specified in the input parameters. In the indicator settings, you can set the signal type, the maximum distance to the trend line, the type of notifications, as well as the settings for lines and arr

MFI Pointer is an indicator based on Money Flow Index indicator that uses both price and volume to measure buying and selling pressure. Money Flow Index is also known as volume-weighted RSI . MFI Pointer simply draws arrows on chart window when value of Money Flow Index (from parameter MFI_Period) is below MFI_Level (green upward pointing arrow) or above 100-MFI_Level (red downward pointing arrow). Indicator works on all timeframes and all currency pairs, commodities, indices, stocks etc. MFI Po

Introducing the SmartZone Reversal Master, a powerful indicator designed to assist traders in identifying potential trade entry points. This indicator utilizes the SMC concepts of liquidity engineering and higher resolution trend analysis to help traders make informed decisions.
By identifying institutional key levels in the market and monitoring price movements in relation to them around certain times of the day (ICT killzones) when volatility is higher, the SmartZone Reversal Master enhance

Bu göstergenin amacı, tüm zaman dilimlerinde Murray seviyelerini bulmak ve bunları güçlü Murray seviyelerine (+2, +1, 8, 4, 0, -1, -2) dayalı sinyal seviyelerini içeren birleşik seviyeler halinde birleştirmektir. Zaman dilimi ne kadar küçük olursa, birleşik seviyeyi hemen görme şansınız o kadar artar. Renkli olarak vurgulanacaktır. İmleci herhangi bir sayının üzerine getirirseniz, seviyenin hangi zaman dilimine ait olduğuna dair bir araç ipucu görünecektir. Ancak her zaman en solda geçerli zaman
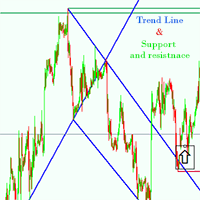
Support and resistance Strategy is one of the most widely used concepts in forex trading.
Strangely enough, everyone seems to have their own idea on how you should measure forex support and resistance. no more wasting time This Indicator is made to do it automatically for you, Features of support and resitance indicator * Automatically detection of the trend line and support & resistance * Works on any pair any time frame any time * Works on offline Chart Inputs : TrendLinePeriod=900 CycleSi

Advanced version of CyberZingFx Volume Plus, the ultimate MT4 indicator for traders seeking highly accurate buy and sell signals. With an additional strategy and price action dot signals that enhances its effectiveness, this indicator offers a superior trading experience for professionals and beginners alike. The CyberZingFx Volume Plus Advanced version combines the power of volume analysis and historical price data with an additional strategy, resulting in even more precise and reliable signals
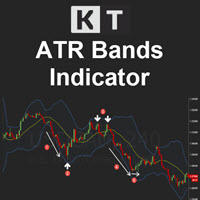
KT ATR Bands draws the volatility envelops and bands using a combination of Average True Range and Moving average. They are typically used to identify the potential reversal points and the periods of high and low volatility.
Features
Multi-Timeframe Ability: For example, you can have the atr bands from the daily timeframe on the H1 timeframe. Smart Alerts: You can turn on/off alerts for each band separately. Also, you can choose a minimum time interval between each alert to stop unnecessary,

Interceptor - professional volume and price extremes indicator. Interceptor is a powerful indicator, which thanks to a combination of four different types of normalized indicators in one algorithm can correctly identify extremes of the price leading to retracements and reversals in the trend. Algorithm is based mainly on combination of Accumulation/Distribution , On Balance Volume , Money Flow Index and Relative Strength Index . The first parameter of Interceptor is Interceptor_Depth which defin
Trend Scanner is a trend indicator that helps to determine the current and forecast market direction using an advanced algorithm. Thanks to flexible alert settings, the indicator will promptly warn you about a trend reversal. The indicator is intuitive and easy to use, and will be an excellent filter in your trending trading strategies. The lines of this indicator are also an excellent dynamic level for stop loss, and is used as one of the types of trailing stop in Trading Panel . To fine-tune t

KT Higher High Lower Low marks the following swing points with their respective S/R levels: Higher High: The swing high made by the price that is higher than the previous high. Lower High: The swing high made by the price that is lower than the previous high. Lower Low: The swing low made by the price that is lower than the previous low. Higher Low: The swing low made by the price that is higher than the previous low.
Features The intensity of swing high and swing low can be adjusted by cha

Gendel Gendut is Binary Option Indicator From @realTatino Trade with expaired time Pairs : All Forex Pair Time Frame : M5 only Trade Time All Time Alert : Alert Message, Alert Email, Alerts Push Buffer : 4 Buffer (0,2 (Buy) || 1,3 (Sell) Broker Suitable : All Broker Binary With Forex Pair Auto Trade : Yes Repaint : NO Delay : NO Other Binary Indicator : https://www.mql5.com/en/market/product/70915 https://www.mql5.com/en/market/product/71054
https://www.mql5.com/en/market/product/57755
etc I

The Penta-O is a 6-point retracement harmonacci pattern which usually precedes big market movements. Penta-O patterns can expand and repaint quite a bit. To make things easier this indicator implements a twist: it waits for a donchian breakout in the right direction before signaling the trade. The end result is an otherwise repainting indicator with a very reliable trading signal. The donchian breakout period is entered as an input. [ Installation Guide | Update Guide | Troubleshooting | FAQ | A
FREE

Χ15 indicator is a MetaTrader 4 tool that allows you to BUILD & BACKTEST ON REAL TIME your own strategies quickly, easily and efficiently. It contains 15 of the most popular technical analysis indicators that you can use, each one in a different way. Choose the indicators that you want to use, select how you will use them and you will see on the chart BUY (green) and SELL (red) arrows implementing your strategy. Choose Take Profit and Stop Loss and you will see the results of your strategy with
FREE

This indicator uses horizontal lines to identify support and resistance levels based on Zigzag legs and On-Balance Volume (OBV) analysis. Here is a summary of how the indicator works: Resistance and Support Lines : A horizontal line above the current price level indicates resistance. A horizontal line below the current price level indicates support. Drawing Horizontal Lines : Draw horizontal lines on every Zigzag leg within the last X legs, where X is a specified number (e.g., 10). Only the most
FREE

Size sadece grafiğin görsel yönünü geliştirmekle kalmayan, aynı zamanda ona canlı, dinamik bir karakter kazandıran bir gösterge sunuyoruz. Göstergemiz, renklerini sürekli değiştirerek ilginç ve renkli bir görünüm yaratan bir veya daha fazla Hareketli Ortalama (MA) göstergesinin bir kombinasyonudur.
Bu ürün grafiksel bir çözümdür, bu nedenle metinde ne yaptığını açıklamak zordur, indirerek görmek daha kolaydır, ayrıca ürün ücretsizdir. Bu gösterge, video düzenleme için güzel bir grafik resmi o
FREE
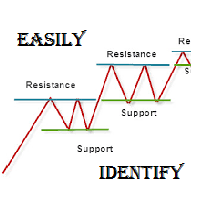
As per name Easily Identify, This Indicator is a affordable trading tool because with the help of Popular Developers & Support of M Q L Platform I have programmed this strategy. I tried to input 4 types and 3 periods of Calculation regarding Support Resistance, Furthermore, I have also care about Trend lines that Trader can easily get in touch with market in another way also. What is in for Trader?
Trading Modes: This selection is for activate whole strategy "Easily Identify" Support_
FREE
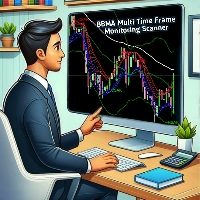
FREE UNLIMITED PM : https://linktr.ee/ARFXAUTOTRADE?utm_source=linktree_admin_share
This BBMA FULL SETUP Scanner indicator is based on Multi Time Frame Monitoring and can be used for direct entry when a signal appears. Rules for Using Indicators: 1. Wait for Full Setup BBMA / EMA 50 Cross Mid BB 20 2. Wait for Reentry / Reetes CANDLE when CSAK / CSM occurs 3. Stop Loss Candle CSAK / CSM is formed 4. Take Profit = 2-5 x Stop Loss Distance If you want to use this indicator for free and unlimit
FREE
This multi symbol indicator has been designed to automatically identify when price reaches major psychological levels. Also known as round numbers, whole numbers or key levels. As a bonus it can also scan for pivot point level on one selected time frame. Combined with your own rules and techniques, this indicator will allow you to create (or enhance) your own powerful system. Features Can write the signals to a file which can be used by an Expert Advisor for auto trading.
Can monitor all symbol

Market Profile 3 MetaTrader 4 indicator — is a classic Market Profile implementation that can show the price density over time, outlining the most important price levels, value area, and control value of a given trading session. This indicator can be attached to timeframes between M1 and D1 and will show the Market Profile for daily, weekly, monthly, or even intraday sessions. Lower timeframes offer higher precision. Higher timeframes are recommended for better visibility. It is also possible t
FREE
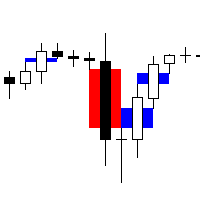
Fair Value Gap Scanner 4 is a sophisticated MetaTrader 5 indicator designed to detect fair value gaps (FVGs) in price action and display them as rectangles directly on the chart. This powerful tool empowers traders by providing visual representations of FVGs, enabling them to identify potential trading opportunities with ease and precision. With customizable parameters for color, width, and style, traders can tailor the indicator's appearance to suit their preferences and trading strategies. Key
FREE
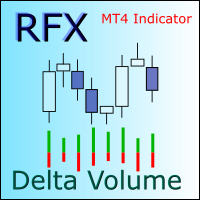
Note: This indicator cannot be tested in the strategy tester. Please download the free demo version from https://www.mql5.com/en/market/product/48627 RFX Delta Volume is an indicator to show bullish and bearish volumes separately for each trading candle. The indicator uses history data of one minute (M1) to estimate the true bullish and bearish volumes in a sub-window. There are two modes of operations for this indicator. In mode "Delta Volume", the indicator shows the difference in bullish a

Detect strength for uptrends and downtrends by tracking Buy Power and Sell Power. Stay on the right side of the market by being able to determine whether the market is in a bull or bear trend and how strong the trend is.
Free download for a limited time! We hope you enjoy, with our very best wishes during this pandemic!
Trend Trigger Factor aims to ride out sideways movement, while positioning the trader in the correct side of the market to capture big trends when they occur. It was orig
FREE

How To Use
Check out this post for detailed description on All Indicator extras and template: https://www.mql5.com/en/blogs/post/758259
The Best Heiken Ashi System is a simple trading system for trading based only two indicators for generate signals: Heiken ashi smoothed and Vqzz indicator multi-timeframe. The system was created for scalping and day trading but can also be configured for higher time frames. As mentioned, the trading system is simple, you get into position when the two ind
FREE
NO REPAINT ADVANCED CHART PATTERN INDICATOR
By definition, a price ( chart) pattern is a recognizable configuration of price movement that is identified using a series of trendlines and/or curves. When a price pattern signals a change in trend direction, it is known as a reversal pattern; a continuation pattern occurs when the trend continues in its existing direction following a brief pause. Advanced Chart Pattern Tracker is designed to find the MOST ACCURATE patterns. A special script is
Market Scanner Elite is a new generation of indicators of the Market Scanner series. The Elite version features an improved market analysis algorithm, with a better identification of the entry points and filtering of the false signals. The logic of market analysis and calculation of effective entry points applied in this product are significantly different from those applied in Market Scanner . This indicator cannot be called a big brother, as it is a completely new product with innovative analy
FREE

Read detailed description and Get Free Demo and extra indicators: https://abiroid.com/product/abiroid-halftrend-scanner
Features:
- Halftrend Arrow Scan: Scan Max Past Bars for Halftrend arrows. Show how many bars back the arrow occurred in a bracket - Past Bars Back Alerts: Num of bars back for which scanner will send alerts - Halftrend HTF Align: Scan Higher timeframes for Trend Direction of Halftrend Indicator and if trends align show a slanting Green/Red Arrow for Up/Down trend - Semafor

The indicator identifies when a divergence occurs between price and an indicator or oscillator. It identifies bullish and bearish hidden or regular (classical) divergences. Combined with your own rules and techniques, this indicator will allow you to create (or enhance) your own powerful system. Features
Can detect divergences for the following indicators/oscillators: MACD, OsMA (Moving average of Oscillator), Stochastics, RSI, CCI, RVI, Awesome (AO), ADX, ATR, OBV, MFI, Momentum and Composi
FREE

All Symbols AND All Time frames Scan
Document Introduction
A breakout refers to when the price of an asset moves above a resistance zone or moves below a support zone. A breakout indicates the potential for a price trend to break.Break provides a potential business opportunity. A break from the top signals to traders that it is better to take a buy position or close a sell position. A breakout from the bottom signals to traders that it is better to take sell positions or close the

MetaForecast, fiyat verilerindeki harmonileri kullanarak herhangi bir piyasanın geleceğini tahmin eder ve görselleştirir. Piyasa her zaman tahmin edilemezken, fiyatlarda bir desen varsa, MetaForecast geleceği mümkün olduğunca doğru bir şekilde tahmin edebilir. Benzer ürünlere göre, MetaForecast piyasa eğilimlerini analiz ederek daha kesin sonuçlar üretebilir.
Giriş Parametreleri Past size (Geçmiş boyut) MetaForecast'ın gelecekteki tahminler oluşturmak için kullandığı çubuk sayısını belirtir. M

QualifiedEngulfing, ProEngulfing Göstergesi'nin ücretsiz sürümüdür. ProEngulfing , Advance Engulf Göstergesi'nin ücretli sürümüdür. İndirin buradan. ProEngulfing'in ücretsiz ve ücretli sürümleri arasındaki fark nedir? Ücretsiz sürümünde bir gün içinde bir sinyal kısıtlaması bulunmaktadır. QualifiedEngulfing Tanıtımı - MT4 İçin Profesyonel Engulf Deseni Göstergeniz QualifiedEngulfing ile precision gücünü serbest bırakın; forex piyasasındaki nitelikli engulf desenlerini belirlemek ve vurgulamak i
FREE

Definition : VPO is a Volume Price Opportunity. Instead of using bars or candles with an Open, High, Low, and Close price, each "bar" in a Market Profile is represented by horizontal bars against the price It is called Market Profile terminology.
In other words volume-price-opportunity (VPO) profiles are histograms of how many volumes were traded at each price within the span of the profile.
By using a VPO chart, you are able to analyze the amount of trading activity, based on volume, for eac

Wolfe Waves scanner - It scans all the Symbols and identify the movement of price and it gives confidence in trade. It automatically plots fifth wave breaks out of the channel. According to the theory behind the pattern, a line drawn from the point at the beginning of the first wave and passing through the beginning of the fourth wave predicts a target price for the end of the fifth wave. If a trader properly identifies a Wolfe Wave as it forms, the beginning of the fifth wave represents an op

This indicator allows you to manage your exposure and see how the lot changes. You can choose the optimal lot value for your deposit without opening real positions. And also evaluate new trading instruments. If you trade manually, then risk management will help you avoid unexpected losses. The indicator includes the ability to receive a sound signal when a specified level is reached, as well as send push notifications and a message to the mail.
FREE

The ICT Unicorn Model indicator highlights the presence of "unicorn" patterns on the user's chart which is derived from the lectures of "The Inner Circle Trader" (ICT) .
Detected patterns are followed by targets with a distance controlled by the user.
USAGE (image 2) At its core, the ICT Unicorn Model relies on two popular concepts, Fair Value Gaps and Breaker Blocks. This combination highlights a future area of support/resistance.
A Bullish Unicorn Pattern consists ou

[ MT5 Version ] Only the next 10 units at current price! Final price: $299 Are you tired of spending months on demo or live accounts to test your trading strategies? The Backtesting Simulator is the ultimate tool designed to elevate your backtesting experience to new heights. Utilizing Metatrader historical symbol information, it offers an unparalleled simulation of real market conditions. Take control of your testing speed, test ideas quickly or at a slower pace, and witness remarkable improvem

Gösterge, seçilen zaman diliminde maksimum yatay hacmi görüntüler. Göstergeye dayanmaktadır UPD1 Volume Box . Çizgiler bağlanabilir veya ayrılabilir. Ayarlarda akıllı dokunuş uyarısını etkinleştirebilirsiniz. Böyle bir gösterge, piyasa profilini ve Akıllı Para kavramını kullanarak ticaret yapanlara faydalı olacaktır.
Giriş parametreleri.
Temel ayarlar. Bars Count - TF POC'NİN çizileceği çubuk sayısını belirtir. Data Source - kenelerin kullanılacağı zaman aralığı. Vertical Step - yoğunluğu v
FREE
Top Bottom Tracker , piyasa trendini analiz eden ve trendin en yüksek ve en düşük seviyelerini tespit edebilen sofistike algoritmalara dayanan bir göstergedir / MT5 sürümü .
Fiyat 500$'a ulaşana kadar kademeli olarak artacaktır. Sonraki fiyat --> $99
Özellikler Yeniden boyama yok
Bu gösterge, yeni veriler geldiğinde değerlerini değiştirmez
İşlem çiftleri
Tüm forex çiftleri
Zaman Dilimi
Tüm zaman dilimleri
Parametreler ==== Gösterge yapılandırması ====
Konfigürasyon param

Dark Inversion is an Indicator for intraday trading. This Indicator is based on Counter Trend strategy but use also Volatility. We can enter in good price with this Indicator, in order to follow the inversions on the current instrument. Hey, I made an Expert Advisor based on this indicator, if you are interested: Dark Titan
Key benefits
Easily visible Inversion Lines Intuitive directional arrows Automated adjustment for each timeframe and instrument Easy to use even for beginners Never rep
FREE

The principle of this indicator is very simple: detecting the candlestick pattern in M30 timeframe, then monitoring the return point of graph by using the pullback of High-Low of M5 Candlestick and finally predicting BUY and SELL signal with arrows, alerts and notifications. The parameters are fixed and automatically calculated on each time frame. Example:
If you install indicator on XAUUSD, timeframe M5: the indicator will detect the reversal, pullback, price action on this timeframe (for ex
FREE

Subscribe to the 'MA7 Trading' channel to receive notifications about new programs, updates and other information. Ask questions in the profile on the MQL5 .
Description of work
The 'MA7 Moss' indicator is based on the standard Accelerator Oscillator (AC) indicator. Shows overbought and oversold zones. Detailed information about the 'MA7 Moss' indicator.
Indicator settings
General settings: Upper level ; Lower level .
Message settings: Send message to the terminal (Alert) – permission t

Matrix Arrow Indicator Çoklu Zaman Çerçevesi Paneli MT4 , Matrix Arrow Indicator MT4 için ücretsiz bir eklenti ve harika bir varlıktır. 5 kullanıcı tarafından özelleştirilmiş zaman çerçevesi ve toplamda 16 değiştirilebilir sembol/araç için mevcut Matrix Arrow Indicator MT4 sinyalini gösterir. Kullanıcı, Matrix Arrow Indicator MT4 'ün içerdiği 10 standart göstergeden herhangi birini etkinleştirme/devre dışı bırakma seçeneğine sahiptir. 10 standart gösterge özelliğinin tümü, Matrix Arrow Indicato
FREE

Bu gösterge size aşağıdaki seviyeleri çizecektir:
Günlük açık hat: aşağıda ayı piyasası var, yukarıda ise yükseliş var. Ortalama günlük aralık yüksek ve düşük Asya piyasası yüksek ve düşük Dünün en yüksek ve en düşük seviyeleri Bu seviyeler herkesin dikkat etmesi gereken güçlü destek ve direnç seviyeleridir.
Başlamak için zamanını kullanmadıysanız! Fiyat bu seviyelere yaklaşırken dikkat etmeniz gerekiyor!
Kolaylaşan ticaretin tadını çıkarın!
FREE
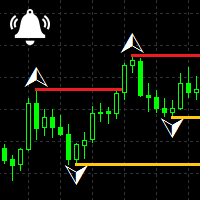
Fractals Notifier MT4 is a modification of Bill Williams' Fractals indicator. The fractal consists of two sets of arrows - up (upper fractals) and down (lower fractals). Each fractal satisfies the following conditions: Upper fractal - maximum (high) of a signal bar exceeds or is equal to maximums of all bars from the range to the left and to the right; Lower fractal - minimum (low) of a signal bar is less or equal to minimums of all bars from the range to the left and to the right. Unlike a stan

MACD divergence indicator finds divergences between price chart and MACD indicator and informs you with alerts (popup, mobile notification or email). Its main use is to find trend reversals in the chart. Always use the divergence indicators with other technical assets like support resistance zones, candlestick patterns and price action to have a higher possibility to find trend reversals. Three confirmation type for MACD divergences: MACD line cross zero level Price returns to previous H/L Creat
FREE
AW Süper Trend - Bu, en popüler klasik trend göstergelerinden biridir. Basit bir ayarı vardır, yalnızca trendle çalışmanıza izin vermez, aynı zamanda bu gösterge tarafından hesaplanan zararı durdur seviyesini de gösterir. Faydalar:
Aletler: Döviz çiftleri , hisse senetleri, emtialar, endeksler, kripto para birimleri. Zaman dilimi: М15 ve üstü. İşlem süresi: 24 saat. Mevcut trendin yönünü gösterir. Durdurma kaybını hesaplar. Ticaret ile çalışırken kullanılabilir. Üç tür bildirim: push, e-p
FREE
The relative strength index (RSI) is a momentum indicator used in technical analysis that measures the magnitude of recent price changes to evaluate overbought or oversold conditions in the price of a stock or other asset. The RSI is displayed as an oscillator (a line graph that moves between two extremes) and can have a reading from 0 to 100. The indicator was originally developed by J. Welles Wilder Jr. and introduced in his seminal 1978 book, “New Concepts in Technical Trading Systems.”
FREE

Description: The indicator measures, through the zigzag indicator, the levels of trend or correction. It shows in the chart the levels of each low or high detected. KEY LINKS: How to Install – Frequent Questions - All Products How is this indicator useful? This indicator determines, depending on Zigzag parameter if a trend is beginning, developing, or ending This indicator determines the direction of the trend Components Levels as positive or negative numbers, depending on the direction
FREE
MetaTrader Mağaza, geçmiş verilerini kullanarak test ve optimizasyon için ticaret robotunun ücretsiz demosunu indirebileceğiniz tek mağazadır.
Uygulamaya genel bakışı ve diğer müşterilerin incelemelerini okuyun, doğrudan terminalinize indirin ve satın almadan önce ticaret robotunu test edin. Yalnızca MetaTrader Mağazada bir uygulamayı tamamen ücretsiz olarak test edebilirsiniz.
Ticaret fırsatlarını kaçırıyorsunuz:
- Ücretsiz ticaret uygulamaları
- İşlem kopyalama için 8.000'den fazla sinyal
- Finansal piyasaları keşfetmek için ekonomik haberler
Kayıt
Giriş yap
Gizlilik ve Veri Koruma Politikasını ve MQL5.com Kullanım Şartlarını kabul edersiniz
Hesabınız yoksa, lütfen kaydolun
MQL5.com web sitesine giriş yapmak için çerezlerin kullanımına izin vermelisiniz.
Lütfen tarayıcınızda gerekli ayarı etkinleştirin, aksi takdirde giriş yapamazsınız.