YouTubeにあるマーケットチュートリアルビデオをご覧ください
ロボットや指標を購入する
仮想ホスティングで
EAを実行
EAを実行
ロボットや指標を購入前にテストする
マーケットで収入を得る
販売のためにプロダクトをプレゼンテーションする方法
MetaTrader 4のためのテクニカル指標 - 140
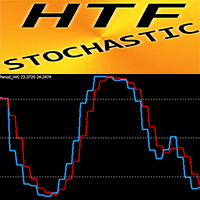
Crypto_Forex インジケーター HTF ストキャスティクス MT4 用。
- ストキャスティクス オシレーターは市場で最も優れたインジケーターの 1 つで、多くのトレーダーにとって最適なツールです。HTF は「Higher Time Frame」を意味します。 - OverBought ゾーン - 80 以上、OverSold ゾーン - 20 以下。 - HTF ストキャスティクス インジケーターは、特にプライス アクション エントリを使用するマルチタイム フレーム トレーディング システムに最適です。 - このインジケーターを使用すると、Higher Time Frame のストキャスティクスを現在のチャートに添付できます --> これはプロフェッショナルなトレーディング アプローチです。 - インジケーターにはモバイルおよび PC アラートが組み込まれています。 - HTF ストキャスティクス オシレーターは、通常のダイバージェンス検出にも使用できます。
// 素晴らしいトレーディングロボットとインジケーターはここから入手できます: https://www.mql

This indicator ( dashboard) provides trend for multi currency on multi timeframe Charts. It gives entries and Stoploss on the chart itself if the currency pair is uptrend then the cell color is displayed as Green and if its downtrend the cell displays the color as Red.If the cell colour displayed on particular currency is green it represents strong uptrend and vice versa if the cell colour is Red.If the cell has just an arrow it means the currency is ready for the trend.If the cell has neither
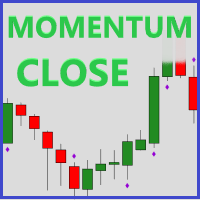
Momentum Close is a useful tool to identify volume based on the strength of a candle close. A strong candle close is when there is a small wick in comparison to the candle body and is a sign that the market will continue in that direction. *This is a NON-repainting indicator*
How this can help you? Identify trend strength Trend confirmation Seeing potential reversals (strong rejection candle) Developing entry and exit strategies Strong confluence to add to your strategy Volume analysis
Featur

Buy Sell Storm
Professional indicator for trading on financial markets, designed for MT5 platform .
Trading on the indicator is very simple, Blue arrow to buy , Red arrow to sell.
Special offer - https://www.mql5.com/en/users/bossik2810
The indicator does not redraw and does not change its values.
( see the video of the EA on the indicator).
In the default settings the Period parameter is set to - 1
You can change this parameter for more accurate signals.
If you have any
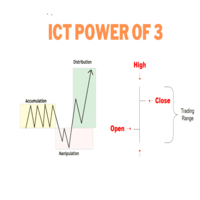
ONLY LOOK TO TRADE DURING TIMES AS SEEN IN SCREENSHOT. START TO LOAD THE INDICATOR BEFORE TO CALCULATE THE BARS SO IT SHOWS THE PHASES ACCORDING TO ICT. 1. London Silver Bullet (3:00 AM - 4:00 AM NY Time) Before 3:00 AM : The market is typically in the Accumulation Phase before the London open, where price consolidates, and large market players accumulate positions. You watch for this quiet consolidation leading up to the manipulation. 3:00 AM - 4:00 AM : Manipulation Phase occurs. During this
The Multi MA Trend Change MT4 indicator is designed to help traders identify and capitalize on trend shifts with precision. By monitoring multiple moving averages, it highlights areas where trends are either gaining strength or beginning to reverse. This makes it an excellent tool for spotting early trend changes and anticipating market movements before they become apparent. The indicator excels in identifying potential retracement entries, ensuring that traders can catch pullbacks during establ

In the context of trading, Malaysia SNR (Support and Resistance) refers to the technical analysis of support and resistance levels in financial markets, particularly for stocks, indices, or other assets traded. There are three type of Malaysia SNR level Classic , GAP and Flipped 1. Classic Support is the price level at which an asset tends to stop falling and may start to rebound. It acts as a "floor" where demand is strong enough to prevent the price from dropping further. Resistance

Advanced UT Bot & HTS Indicator This indicator is an advanced technical analysis tool that combines two methods: UT Bot and HTS (Higher Timeframe Smoothing) , to generate accurate buy and sell signals. 1. Indicator Structure Works within the main chart window and utilizes 11 buffers to store various data points, including arrows (buy/sell signals) and bands from both UT Bot and HTS systems. Uses colored arrows to represent different trading conditions: Blue arrows : Normal buy signals. Red arro

Advanced ATR Trailing Stop with EMA Filter Indicator Introducing the ATR Trailing Stop with EMA Filter Indicator , a powerful tool designed to enhance your trading strategy with advanced signal filtering. This indicator combines the precision of ATR (Average True Range) trailing stop calculations with the flexibility of an EMA (Exponential Moving Average) filter, ensuring you capture the best opportunities in the market. Key Features: Dual Signal Arrows: The indicator provides two types of arrow

Zenマーケットフロー - MTFスーパートレンド
MTFスーパートレンドは、任意のタイムフレームで使用できるシステムです。このマルチタイムフレームインジケーターは、1つから3つのタイムフレームのシグナルを同時に表示し、それらの整合性を示します。
スーパートレンドインジケーターを気に入っている方は、このバージョンもきっと気に入るでしょう。
インジケーターのシグナルと描画をバックテストでテストすることもでき、マルチタイムフレームのシグナルを表示することができます。
すべてのタイムフレームが同じ方向を示しているときに、インジケーターはシグナルを提供し、スクリーンショットを撮り、アラートウィンドウをポップアップし、メールやプッシュ通知をスマートフォンに送信します。
高いタイムフレームの場合、クローズしたローソク足に基づいて値を表示するか、ローソク足ごとにインジケーターの値がどのように変化したかを確認するオプションがあります。
バックテストを行いたい場合も問題ありません。インジケーターは現在のタイムフレームのローソク足に基づいて、より高いタイムフレームのローソク足をシミュレーショ

This is a comprehensive multi-timeframe , multi-indicator dashboard designed to simplify and enhance your trading experience. The dashboard provides real-time insights across multiple currency pairs and timeframes, helping traders quickly assess market conditions and make informed decisions. With a user-friendly interface, customizable settings, and a robust selection of indicators, this tool is an essential addition to any trader's arsenal.
Key Features: Multi-Timeframe Analysis: Monitor key

The Fast flat indicator can recognize and notify you of short flats after the price rises or falls. Where the price can rush further or reverse. ++ The indicator is open to arbitrary flat settings. You will probably have to conduct quite a few tests, approaching the best results. I will be very grateful if you share in the comments your tests, parameters and advice to other users, who may also be able to improve your results. Should I use it for entry signals, order stops, hedging...? - The indi
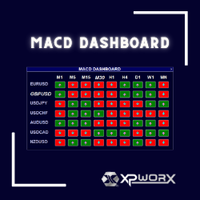
Simplify Your Trading with the MACD Dashboard
Are you tired of juggling multiple MetaTrader charts to monitor MACD across different timeframes and symbols? The MACD Dashboard is the solution you've been waiting for. This innovative MetaTrader indicator provides a centralized view of MACD signals on multiple charts, making it easier than ever to identify trading opportunities and manage your risk.
Key Features: Multi-Timeframe Monitoring: Track MACD signals on multiple timeframes simultaneousl
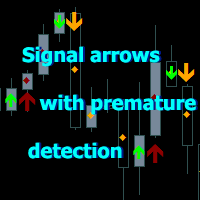
An arrow indicator showing price reversals and following the trend.
The indicator determines price reversals on the chart and is suitable for scalping on TF 1M-5M and day trading on TF 1H and 4H. Buy and sell arrows are displayed on the chart as entry signals. Diamonds are displayed behind the arrows as a continuation of the signal.
They are not repainted and are formed after the candle closes.
Red arrows are buy signals.
Orange arrows are sell signals.
The indicator also contains green prematur
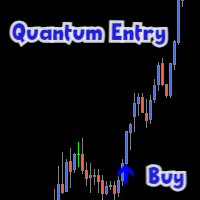
Top Quantum Entry MT4 indicator that gives signals to enter trades.
Perfect entry points for currencies, cryptocurrency, metals, stocks and indices.
Special offer - https://www.mql5.com/en/users/bossik2810
The indicator 100% does not repaint!!!
If a signal appears, it does not disappear anymore! Unlike indicators with redrawing, which lead to loss of deposit, because they can show a signal, and then remove it.
Trading with this indicator is very easy.
Wait for a signal from the indicat

BotM5 MT4
Exact entry points for currencies, crypto, metals, stocks, indices!
Special offer - https://www.mql5.com/en/users/bossik2810
Indicator 100% does not repaint!!!
Version MT5 - https://www.mql5.com/en/market/product/123028
If a signal appeared, it does not disappear! Unlike indicators with redrawing, which lead to loss of deposit, because they can show a signal, and then remove it.
Trading with this indicator is very easy.
Wait for a signal from the indicator and enter the deal
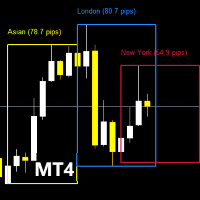
このインジケーターの機能に入る前に、この商品に評価を付け、経験を共有するためにコメントを残し、最新の更新や新しいツールについての通知を受け取るために私のページに登録してください。あなたのサポートは非常に貴重で、私の創作を常に改善するのに役立ちます! 説明: TradingSessionPipsVisualizer - トレーディングセッションをマスターするためのプロフェッショナルツール 外為市場のセッションを一目で視覚化し、最適なトレードタイミングを見極めよう! TradingSessionPipsVisualizer は、MetaTrader 4用のプレミアムインディケーターで、主要なトレーディングセッション(ロンドン、ニューヨーク、アジア、シドニー、フランクフルト)を直接グラフ上にハイライトします。要求の高いトレーダーのために開発されており、以下のことを可能にします: 高い取引活性期を瞬時に識別 (セッションの重複) リアルタイムでのボラティリティ分析 (表示されるピップ範囲) 最適な時間帯に合わせて戦略を調整 (スキャルピング、デイトレード、スウィングトレード) 自分の取引ス
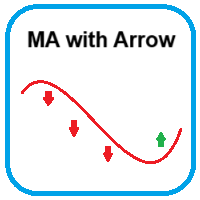
The indicator provides a moving average with buy and sell arrows
Only buy arrows are shown above the moving average and only sell arrows are shown below the moving average
Added a Rsi filter to reduce arrows
The moving average can be adjusted as preferred - Default is 200 EMA
The arrows is non repaint after close of candle to lock it in place
The arrows also has alerts if needed
Suitable to any timeframe or instrument of choice
Test in demo before purchase
Enjoy
This indicator managge all kind of ICT FVG include: FVG, SIBI, BISI, Inverse FVG. The advantage point of this indicator is mangage FVG on all timeframe. FVG - Fair value gap ICT Fair value gap is found in a “three candles formation” in such a way that the middle candle is a big candlestick with most body range and the candles above & below that candle are short and don’t completely overlap the body of middle candle. * This indicator allow filter FVG by ATR. So you can just show valid FVG which

Hello Traders, Introducing a powerful indicator designed to enhance your buy/sell decisions by combining 15 different indicators into one. This unique combination helps minimize false entries, providing you with a more reliable trading strategy. The indicator is easy to use: an upward arrow signals a buy opportunity, while a downward arrow suggests a sell. The indicator is highly versatile and can be applied to any currency pair and any timeframe. However, for optimal performance, I recommend us

The Real Cloud indicator for MT4 is a popular and useful Forex indicator. This indicator provides traders with an easy way to identify potential trading opportunities in the Forex market. The Real Cloud indicator uses a unique algorithm to analyze price action and generate signals. It is designed to identify strong trends and provide traders with an edge in their trading. The Real Cloud indicator is easy to use and requires no additional setup. Simply attach the indicator to your chart and it wi
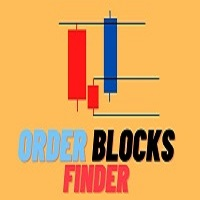
Индикатор Order blocks Mtf строит уровни на основе smart mony(умные деньги) Строит уровни как сразу получил излом тренда, индикатор очень удобен и практичен для использование на форекс и на бинарных опционов В него в шита система поиска сигналов на касании старших уровней таким же уровней излома тренда и ретеста к среднему значению При касании уровня очень хорошо отрабатывает на бинарных опционах,
Ephraim Umpan Gold Coins Magnet Indicator is an Indicator that helps traders do the decisions. With this Indicator, Every trader will now have an edge in trading and will be more profitable in their trades. Accordingly, this indicator can help increased the winning capability of every trader. Would you like to try of this indicator? Now is your chance to do so.
Ephraim Umpan インジケーターは、マニュアル取引を希望する外国為替トレーダーにとって優れたインジケーターです。このインジケーターを使用すると、すべてのトレーダーが取引で有利になり、素晴らしい安定した結果を得ることができます。この指標は、私たちが市場からどのように学べるかを証明するだけではありません。さらに、このインジケーターは素晴らしいツールです。外国為替市場で大きな収入を得るためにこのツールを活用しましょう。
Ephraim Umpan インジケーターは、マニュアル取引を希望する外国為替トレーダーにとって優れたインジケーターです。このインジケーターを使用すると、すべてのトレーダーが取引で有利になり、素晴らしい安定した結果を得ることができます。この指標は、私たちが市場からどのように学べるかを証明するだけではありません。さらに、このインジケーターは素晴らしいツールです。外国為替市場で大きな収入を得るためにこのツールを活用しましょう。

To access the TD sequential Scanner for MT5, please check https://www.mql5.com/en/market/product/123369?source=Site +Market+My+Products+Page. One of the MT5 versions includes additional timeframes such as M1, M2, M3,H2,H6,H8 and so on.( https://www.mql5.com/en/market/product/123367?source=Site +Market+My+Products+Page) TD Sequential Scanner: An Overview The TD Sequential scanner is a powerful technical analysis tool designed to identify potential price exhaustion points and trend reversals in fi
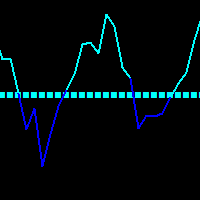
An easy-to-use indicator for various trading systems. Gives early signals in the price direction.
There is a main smoothed trend and a line of change of short-term directions. When using, you can choose the calculation method and smoothing of the main trend, the rest of the parameters are already configured.
Easy to use, you just need to attach it to the chart and follow simple recommendations for trading.
Signal for purchases: blue squares of the main trend + blue signal line is directed upwa
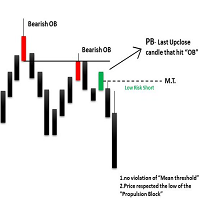
The ICT Propulsion Block indicator is meant to detect and highlight propulsion blocks, which are specific price structures introduced by the Inner Circle Trader (ICT). Note: THIS IS MTF version. Single Timeframe version avaiable at here
Propulsion Blocks are essentially blocks located where prices interact with preceding order blocks. Traders often utilize them when analyzing price movements to identify potential turning points and market behavior or areas of interest in the market.

小さな価格変動をフィルタリングし、大きなトレンドに焦点を当てる . Renkoチャート指標は、小さな価格変動をフィルタリングして、全体のトレンドに焦点を当てるのに役立ちます。 価格が指定された距離だけ動くことで、Renkoブロックが作成されます。 これにより、価格が動いている現在のトレンド方向を簡単に特定できます。 多機能ユーティリティ : 66以上の機能を含む | ご質問があればご連絡ください | MT5バージョン インジケーターの設定で、以下を構成できます: 計算設定: ブロックサイズ(ポイント単位); インジケーターのスタイル:
ブロックの色; プログラムファイルは " Indicators " ディレクトリに配置してください。
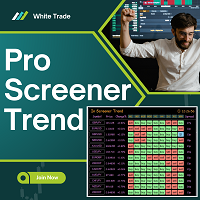
プロスクリーナーのトレンド Pro Screener トレンド取引指標は、最新の機械学習アルゴリズムを使用して金融市場のトレンドの方向を決定するように設計されています。このインジケーターは、ポジションをオープンおよびクローズするための明確なシグナルを提供することで、新規トレーダーと経験豊富なトレーダーの両方の取引を大幅に簡素化します。
主な特徴: 1. 複数の通貨を含むダッシュボード: このインジケーターは、10 を超える通貨ペアのトレンドを同時に表示するインタラクティブなダッシュボードを提供します。これにより、トレーダーはチャートを切り替えることなく、市場の現在の状態を迅速に評価することができます。
2. マルチタイムフレーム分析: 「プロ スクリーナー トレンド」は、すべての主要な時間枠 (分から日足まで) の分析をサポートしており、トレーダーは短期と長期の両方でトレンドを確認できます。これは、異なる時間枠間で収束戦略を使用する場合に特に役立ちます。
3. 機械学習アルゴリズム: このインジケーターは ML の最新の進歩に基づいており、過去のデータを分析し、標準的なテク

Detailed blog post with extras downloads: https://www.mql5.com/en/blogs/post/759154
About: Price ranges most of the time in forex… Like 70-80% of the time. And then it breaks out of the range to continue in a trend. Even in a trend, price makes smaller ranges all the time. Range Breaker Scalper is a tool to find the times when price breaks out of a range. A sudden break means that price will continue on for next few bars towards the breakout. So, these areas are best for scalping. Especially if
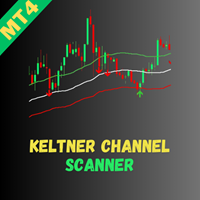
Welcome to the Keltner Channel Multicurrency Scanner , an advanced tool designed to enhance your trading by detecting Keltner Channel breakouts and real-time insights. This MT4 indicator is built to scan multiple currency pairs simultaneously, helping you capitalize on market trends more effectively. Key Features: Effortless Multicurrency Scanning
Monitor multiple currency pairs in real-time and receive instant alerts when key Keltner Channel breakout signals are detected. This allows you to re

Statistical Trend Indicator is an advanced custom indicator designed to analyze market movements and provide traders with calculated probabilities of upward or downward trends. By analyzing historical price data over a specified lookback period, this indicator computes the likelihood of the market continuing in either direction, offering traders a statistical edge in decision-making.
Key Features: Probability Display: It calculates and displays the percentage probabilities of an upward or down
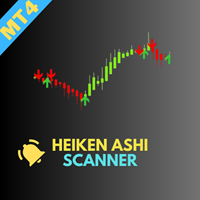
Welcome to the Heiken Ashi Multicurrency Scanner , an advanced tool designed to help traders efficiently monitor market trends using the Heiken Ashi indicator. This MT4 scanner allows you to scan multiple currency pairs simultaneously, enabling quick identification of market trends and reversal opportunities. Key Features: Effortless Multicurrency Scanning
Track numerous currency pairs in real-time and receive instant alerts when significant Heiken Ashi signals are detected. Stay ahead of marke
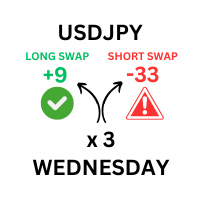
このツールは、取引プラットフォームで利用可能なすべての通貨ペアの詳細なスワップレートを表示するように設計されています。 これにより、トレーダーは視覚的に強化された別個のウィンドウでロングとショートの両方のスワップ値をすばやく確認できます。 このツールは、ロット サイズのユーザー定義の入力を提供し、現在のスワップ レートと取引量に基づいて正確な計算を保証します。 さらに、標準レートと週末調整レートの両方を考慮して、スワップ手数料が適用される時期も提供されます。 注: スワップ情報は取引プラットフォームに応じて毎日変わります。 ------------------------------------------------------------------------------------------------------------------------------------------------------------- このツールは、取引プラットフォームで利用可能なすべての通貨ペアの詳細なスワップレートを表示するように設計されています。 これにより、トレーダーは視覚的

Binary Scalper 6 – MT4用の強力なバイナリーオプション指標
Binary Scalper 6 は、 MetaTrader 4 (MT4) 向けに設計された、先進的なトレンド分析とバイナリーオプショントレーディングツールです。すべてのレベルのトレーダーに適しており、明確なシグナルと統計を提供します。 主な特徴: トレンド検出 :トレンド市場を正確に特定し、明確な方向性を提示。 すべての通貨ペアに対応 :お好みの市場で取引可能。 あらゆるタイムフレームに対応 :1分足から月足まで。 1キャンドルの満期シグナル :迅速かつ簡潔なトレーディング機会。 統計情報を表示 :市場のパフォーマンスに関する貴重なデータを提供。 バッファ矢印 :取引エントリーを視覚的にサポート。 使用方法:
MQL5 フォルダをダウンロードし、MetaTrader 4 ディレクトリに移動します。 こちら からダウンロードできます。

Trend StarteR は、上昇トレンドと下降トレンドのシグナルを矢印の形で提供するマルチ RSI ベースのインジケーターです。このインジケーターは、起こり得るトレンドを予測し、トレーダーがそれらのトレンドの取引に参加できるようにするために作成されました。 このインジケーターは鉱石のバックペイントを再描画しません。このインジケーター信号は遅延しません。 ================= 推奨事項 : 低スプレッドのブローカー、時間枠は問いませんが、スプレッドに勝つには M5 以上に固執することをお勧めします。 ================================= パラメータ: 第 1、第 2、および第 3 RSI 期間 クロスが発生したときに信号が出力される上下のレベル 通知設定: モバイルアラート、サウンドアラート、MT4メッセージ ================================================= ================
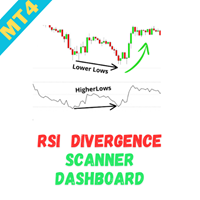
Welcome to the RSI Divergence Multicurrency Scanner Dashboard , an advanced tool designed to help traders efficiently detect RSI divergence patterns across multiple currency pairs. This scanner enables quick identification of potential reversal opportunities, giving you an edge in your trading strategy. Key Features: Effortless Multicurrency Scanning
Monitor multiple currency pairs in real-time and receive instant alerts when significant RSI divergence patterns are detected. This allows you to
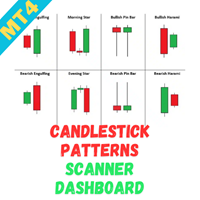
The Candlestick Pattern Scanner Dashboard MT4 is a powerful tool for monitoring candlestick patterns across multiple currency pairs and timeframes. It organizes detected patterns in a grid format, displaying the pattern's short form and how many candles ago it appeared (e.g., BUEN(3) for a Bullish Engulfing pattern detected three candles ago). You can find the MT5 version here CandleStick Patterns Multicurrency Scanner MT5 For detailed documentation click here Candlestick Pattern Det

Forex Scalper Indicator – 金融市場で利益を得るための精密ツール
MT4用のForex Scalper Indicatorは、市場で最大の精度でスキャルピングを行いたいすべてのトレーダーにとって完璧な味方です。正確なデータに基づいた分析により、このインジケーターは迅速な決定を下すのに理想的な、タイムリーで正確なシグナルを提供します。
オーダーメイドの精度 チャートに表示される各矢印は綿密な計算に基づいており、最適なエントリーとエグジットの機会を提供します。これらはランダムなシグナルではなく、リアルタイムで市場を分析する正確な指示です。
反転ポイントの正確な検出 このインジケーターは、価格の潜在的な反転ポイントを高精度で識別し、取引において不可欠なツールとなります。信頼できるデータに基づいて生成されたシグナルにより、市場が最も不安定な局面でも利益を最大化できます。
クリーンで読みやすいインターフェース スクリーンショットで見られるように、Forex Scalper Indicatorはチャート上にわかりやすい矢印を表示し、シグナルの読み取りと解釈を簡単にし
The presented technical analysis indicator marks the points on the price chart of a financial instrument at which the short-term/long-term trend has changed its direction. The indicator identifies the trend direction by analyzing the divergence of the price series with the data of the digital filter selected by the user. The ability of the applied digital filters to adapt to sharp price fluctuations allows achieving high efficiency of the indicator signals in most markets. The indicator signals

Machine Learning Adaptive SuperTrend - Take Your Trading to the Next Level!
Introducing the Machine Learning Adaptive SuperTrend , an advanced trading indicator designed to adapt to market volatility dynamically using machine learning techniques. This indicator employs k-means clustering to categorize market volatility into high, medium, and low levels, enhancing the traditional SuperTrend strategy. Perfect for traders who want an edge in identifying trend shifts and market conditio

Vondereich MTF Strength Indicator Description: Overview: The Vondereich MTF Strength Indicator is a powerful yet user-friendly multi-timeframe analysis tool designed to simplify market insights for traders of all experience levels. By evaluating currency pairs across various timeframes using a combination of technical indicators such as the Stochastic Oscillator, Relative Strength Index (RSI), Exponential Moving Average (EMA), and Average True Range (ATR), this indicator delivers clear buy, sell

The indicator is a histogram for scalping the lower timeframes
When the hill behind appears go short and when it disappears go long
The indicator has only sound alerts
The colors can be adjusted as preferred
Suitable for lower timeframes - 1 - 5 minutes
Test in demo before purchase
Enjoy -----------------------------------------------------------------------

Scopri l'Indicatore Avanzato di Zone di Offerta e Domanda Sei pronto a portare il tuo trading al livello successivo? L'indicatore "Advanced Supply and Demand Zone" è lo strumento definitivo per identificare con precisione le zone chiave di supporto e resistenza sul mercato, permettendoti di prendere decisioni informate e tempestive. Come Funziona Questo indicatore innovativo analizza il mercato utilizzando frattali veloci e lenti per individuare i punti di inversione del prezzo. Si basa sui prin

ADX Shark Scalper – The Ultimate Hybrid Indicator for Precision Scalping Dive into the markets with the ADX Shark Scalper , a powerful and versatile tool designed for traders who seek precision in every trade. This cutting-edge indicator seamlessly combines multiple advanced technical signals into one streamlined system, allowing you to spot good buy and sell opportunities with ease. At its core, the ADX Shark Scalper leverages the power of trend and momentum detection through the integration of

Description : In the world of trading, candlestick patterns are a popular technical analysis tool used by many traders. There are numerous candlestick patterns, ranging from reversal patterns to continuation patterns. However, remembering all these patterns can be challenging, especially for novice traders. This often leads to traders having to manually memorize and identify candlestick patterns, which can be time-consuming and prone to errors. Candle Pattern Pro is a powerful indicator design
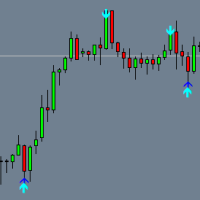
MT4用Binary DUNKS Binary DUNKSは、バイナリーオプション取引のための高い勝率を誇るインジケーターで、M5以上のタイムフレームとあらゆる通貨ペアで効果的に機能します。 満期: デフォルトでは1本のローソク足に設定されていますが、設定で変更可能です。 シグナル: 矢印で表示されます:
赤い矢印 — 売りシグナル。
青い矢印 — 買いシグナル。
取引は、ローソク足の上または下に2つの矢印(確認)がある場合のみ推奨されます。 統計: グラフにはシグナルの成功率に関する統計が表示され、リアルタイムでインジケーターの有効性を分析できます。 インストール方法:
インジケーターを正しく動作させるには、「MQL5」フォルダをターミナルのディレクトリにコピーしてください。 ここ からダウンロード 。
インストール手順: 動画 を見る 。 追加情報:
シグナルが表示された際にポップアップ通知を受け取るには、 追加 のインジケーター をご利用ください。
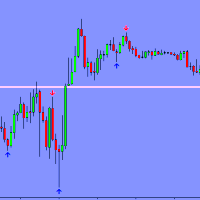
バイナリー クレーターは、バイナリー オプション取引専用に設計された MetaTrader 4 の強力で多用途なインジケーターです。どの時間枠でもどの通貨ペアでも効果的に機能するため、トレーダーにとって非常に柔軟なツールとなります。
主な特徴:
トレンド分析: このインジケーターは市場の現在のトレンドを自動的に判断するため、トレーダーがトレンドの方向に沿って取引を開始できるようになり、取引が成功する可能性が高まります。
シグナルの発行: このインジケーターは、取引へのエントリーの可能性を示すバッファー矢印を生成します。上矢印は買いシグナルを示し、下矢印は売りシグナルを示します。
1 キャンドル満期: このインジケーターは、シグナルを 1 つのキャンドル満期に使用できるため、短期取引に最適です。
汎用性: このインジケーターはあらゆる時間枠と通貨ペアに適用できるため、さまざまな戦略や好みを持つトレーダーにとって役立ちます。
使いやすさ: このインジケーターはインストールと使用が簡単で、あらゆるレベルのトレーダーが利用できます。
あらゆる利点があるにもかかわらず、バイナリー

Gann Box インジケーターは、トレーダーが市場の重要なレベルを特定し、活用するのを支援するために設計された強力で多機能なツールです。このインジケーターを使用すると、チャート上に長方形を描くことができ、それが自動的に 0, 0.25, 0.50, 0.75, 1 の戦略的レベルを持つ複数のゾーンに分割されます。価格がこれらのレベルのいずれかに達すると、アラートがトリガーされ、トレーディングの意思決定に貴重な支援を提供します。描いたゾーンに対する市場の動きを即座に把握できます。ゾーンをトレースするには、単純な長方形を描いて名前を GannBox に変更するだけです。 このインジケーターは、 サポートとレジスタンス の概念を使用するトレーダー、 サプライとデマンド 、 ICTテクニック 、または**公正価値ギャップ(FVG)**の専門家など、すべてのタイプのトレーダー向けに設計されています。 デイトレーダー、スイングトレーダー、またはポジショントレーダーであろうと、 Gann Box は市場の動きをより良く理解し予測する手助けをし、反応性とパフォーマンスを向上させます。 MT5バージョ

The presented product is a dynamic support/resistance line based on standard moving averages. The simplest and most effective trend indicator, useful for both a beginner in trading and a professional trader. Allows you to get the maximum result in trending areas of the market and minimize losses in areas of lateral price movement. Thanks to a wide range of customizable parameters, it allows you to get results in any market and TF. After the bar is formed, the indicator does not repaint. Princip

Unlock the Power of Multi-Market Insights with Our Cutting-Edge Dashboard Indicator
Are you tired of juggling multiple charts and indicators just to stay on top of the markets? Introducing the "RSI & EMA Cross Dashboard" - a revolutionary trading tool that consolidates critical signals across your favorite currency pairs and timeframes into a single, easy-to-read display.
Meticulously coded by our team of seasoned developers, this indicator harnesses the power of RSI and EMA crossover analysi

This dashboard shows you the 3MA Cross Overs current status for Multi-currency multi-timeframes. Works for Metatrader 4 (MT4) platform. Detailed Post:
https://www.mql5.com/en/blogs/post/759238
How it Works:
MA Cross Signals It will show “S” Green/Red Strong Signals and “M” or “W” Green/Red Medium or Weak signals. We have 3 types of MA: Faster, Medium and Slower MA. A strong signal is when FasterMA and MediumMA are both above/below SlowerMA. A medium signal is when only FasterMA is above/below

Advancing in NASDAQ 100 Trading with the Smart "Candle Color" Indicator The indicator we offer is one of the good tools for trading in the NASDAQ 100 market, especially in the 1-minute and 5-minute timeframes. This indicator is designed with precision and scientific rigor and can also be used in other timeframes. All you need to do is activate it and leverage its power. Unique Features: Optimized Performance in 1-Minute and 5-Minute Timeframes: This indicator is specifically designed for these

Magic Moving AI The Magic Moving AI indicator is one of the best tools for trading in the NASDAQ 100 market. This tool is specifically designed for the 1-minute and 5-minute timeframes and operates with high precision. You can easily activate this indicator and benefit from its advantages. Unique Features: Specialized Performance in 1-Minute and 5-Minute Timeframes: While this indicator is capable of working in other timeframes, its primary focus is on these two timeframes to deliver optimal re

NASDAQ 100市場での高度な取引機会をNASDAQスマートインジケーターで発見 NASDAQスマートインジケーターは、NASDAQ 100市場での取引において非常に強力で効果的なツールの一つです。このインジケーターは特に1分と5分のタイムフレームに合わせて設計されており、高精度で高度なパフォーマンスを発揮します。簡単に設定してそのメリットを活用できます。 主な特徴 : 1分と5分のタイムフレームでの最適なパフォーマンス :このインジケーターは特にこれら2つのタイムフレーム向けに設計され、最高の結果を提供します。ほかのタイムフレームでも機能しますが、特に重要なこれらのタイムフレームに注力しています。 NASDAQ 100戦略との互換性 :このインジケーターは私たちのNASDAQ 100戦略の重要な要素で、適切な取引機会の理解を助けます。 このインジケーターは1年間にわたり利用・バックテストされてから提供されており、満足のいくパフォーマンスを示しています。しかし、利用前に必ずユーザー自身でバックテストし、機能性を確認してください。 オシレーター構造 :NASDAQスマートインジケータ

The indicator now available to you is one of the best tools for trading in the NASDAQ 100 market, particularly in the 1-minute and 5-minute timeframes. This tool is designed with precision and can also be used for other timeframes. All you need to do is activate it. Key Features: Specialized Performance in 1-Minute and 5-Minute Timeframes: While this indicator can work in other timeframes, it delivers optimal results in these two timeframes. Compatibility with the NASDAQ 100 Secret Strategy: Th
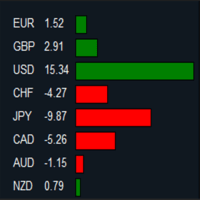
MT5 Version: https://www.mql5.com/en/market/product/124136 Imagine you’re at the helm of your trading terminal, scanning charts of various currency pairs, trying to figure out which ones are strong, which ones are weak, and where the real opportunities lie. It’s a lot to process—flipping between charts, calculating movements, and comparing performance. But what if all of that could be done for you, neatly displayed in one place? That’s where this Forex Strength Dashboard comes in. Picture thi
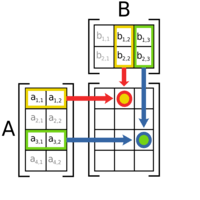
MT5 Version: https://www.mql5.com/en/market/product/124107 A Day in the Life of a Trader: Discovering the Forex Matrix Dashboard In the fast-paced world of forex trading, keeping track of multiple currency pairs can feel overwhelming. That’s where the Forex Matrix Dashboard comes in, making the life of a trader much easier. Imagine opening the dashboard and instantly seeing all your favorite currency pairs, like EUR/USD, GBP/USD, and USD/JPY, displayed clearly with their latest prices. No mo

MT5 Version: https://www.mql5.com/en/market/product/124150 You’re sitting in your trading room, sipping coffee as the markets start their day. The screen in front of you is alive with numbers, price movements, and endless charts. Each one demands your attention. But you don’t have time to dive into every single detail. You need a quick, reliable way to read the market’s mood. That’s when you glance at your Sentiment Dashboard—a custom-built tool designed to simplify your trading decisions. This
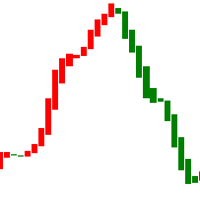
This is an indicator that tracks price trends and can alert traders when the market exhibits abnormalities. The indicator chart is marked with red and green colors. The background color of the chart is white and cannot be modified to other background colors. When the indicator color changes from red to green, it means that the market price has paused or even reversed. This is a reminder to traders of the possibility of short orders. When the indicator color changes from green to red, it means t
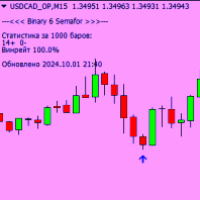
Binary 6 Semafor は、MetaTrader 4 のユニバーサル バイナリー オプション インジケーターです。
- あらゆる時間枠と通貨ペアで動作します
- エントリーポイントの正確な検出
- 現在のローソク足が閉じる前にシグナルがチャートに表示されます
-有効期限1キャンドル
- 入力用のバッファ矢印
- 現在の資産の統計を表示します
テスト結果:
このインジケーターは素晴らしいリターンでテストに合格し、さまざまな市場状況での有効性を実証しています。利益を最大化し、リスクを最小限に抑えたいトレーダーにとって理想的です。
注意、インジケーターが正しく動作するには、ターミナルフォルダーに「MQL5」フォルダーを配置する必要があります。以下のリンクからダウンロードできます: https://disk.yandex.ru/d/DPyo0ntaevi_2A
注記:
この指標は利益を保証するものではなく、適切なリスク管理と併せて使用する必要があります。実際の口座で使用する前に、デモ口座でインジケーターをテストすることをお勧めします。
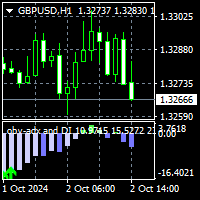
To get access to MT5 version please click here . This is the exact conversion from TradingView: "OBV ADX and DI" by " kocurekc ". This is a light-load processing and non-repaint indicator. All input options are available. Buffers are available for processing in EAs. You can message in private chat for further changes you need. I removed the background coloring option to best fit into MT platform graphics.
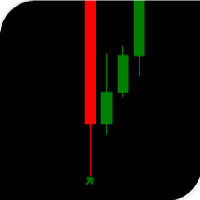
The arrow indicator without redrawing shows potential entry points into the market in the form of arrows of the appropriate color: the up arrows (usually green) suggest opening a purchase, the red down arrows suggest selling. The appearance of arrows may be accompanied by beeps. It is usually assumed to enter at the next bar after the pointer, but there may be non-standard recommendations. Arrow indicators visually "unload" the price chart and save time for analysis: no signal – no deal, if ther
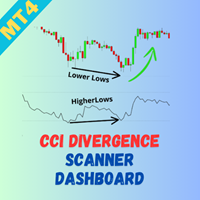
Welcome to the CCI Divergence Multicurrency Scanner Dashboard , an advanced tool designed to help traders efficiently detect CCI (Commodity Channel Index) divergence patterns across multiple currency pairs. This scanner enables quick identification of potential reversal opportunities, giving you a significant edge in your trading strategy. Key Features: Effortless Multicurrency Scanning Monitor multiple currency pairs in real-time and receive instant alerts when significant CCI divergence patter
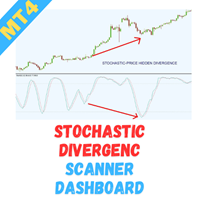
Welcome to the Stochastic Divergence Multicurrency Scanner Dashboard , an advanced tool designed to help traders efficiently detect Stochastic divergence patterns across multiple currency pairs. This scanner enables swift identification of potential reversal opportunities, providing a strategic advantage in your trading endeavors. Key Features: Effortless Multicurrency Scanning Monitor multiple currency pairs in real-time and receive instant alerts when significant Stochastic divergence patterns
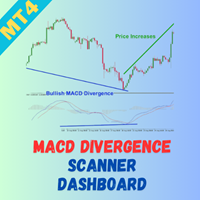
Welcome to the MACD Divergence Multicurrency Scanner Dashboard , a powerful tool designed to help traders quickly detect MACD divergence patterns across multiple currency pairs. This scanner allows for efficient identification of potential reversal signals, giving you a competitive edge in your trading strategy. Key Features: Effortless Multicurrency Scanning Monitor multiple currency pairs in real-time and receive instant alerts when significant MACD divergence patterns are identified. This cap

Trading System Double Trend - an independent trading system consisting of several indicators. Determines the direction of the general trend and gives signals in the direction of price movement.
Can be used for scalping, intraday or weekly trading.
Features
Works on any time frames and trading instruments (forex, cryptocurrencies, metals, stocks, indices.) Simple visual reading of information that does not load the chart The indicator does not repaint and does not complete signals Works only wh
the indicator presents three supertrends that identify a possible trend for the day and places possible entry flags when they are aligned, audible and visual alarms available, usable on all timeframes, ability to customize trends, colors, and time filter.
each asset needs its own specific supertrends, indicator has standard trends that can be used on M5

Want to create an Expert Advisor (EA) using an indicator that doesn’t store the required data in a buffer (visible in the Data Window) and only draws objects on the chart? This solution captures chart objects and places them into buffers, allowing you to create an EA—whether you're using EA Builder Pro or writing code with iCustom—by selecting the correct values using those buffers (modes). It works with any object visible in the Object List that has a unique Name or Description, such as: Trend

サポート レジスタンス ウィスパラーは、 トレーダーが市場で重要なサポート レベルとレジスタンス レベルを特定できるように設計された強力なツールです。このインジケーターは、価格アクションを使用してチャート上に赤いレジスタンス ラインと緑のサポート ラインを動的に描画し、潜在的な市場の反転やブレイクアウトが発生する可能性のある主要な価格帯を明確かつ視覚的に表示します。フラクタルに依存する従来の方法とは異なり、このインジケーターは、カスタマイズ可能なルックバック期間の最高価格と最低価格に基づいてサポートとレジスタンスを計算することで遅延を回避します。 主な特徴: ルックバック期間: LookbackPeriod パラメータを使用して、特定の数のローソク足の価格データを分析するようにインジケーターをカスタマイズします。これにより、トレーダーはサポート レベルとレジスタンス レベルの感度を微調整できます。 履歴データ分析: このインジケーターは、最大 500 個の履歴バー ( 履歴 パラメーターで調整可能) をスキャンして、市場価格の変動を包括的に分析できます。 SR 継続フィルター:
MetaTraderプラットフォームのためのアプリのストアであるMetaTraderアプリストアで自動売買ロボットを購入する方法をご覧ください。
MQL5.community支払いシステムでは、PayPalや銀行カードおよび人気の支払いシステムを通してトランザクションをすることができます。ご満足いただけるように購入前に自動売買ロボットをテストすることを強くお勧めします。
取引の機会を逃しています。
- 無料取引アプリ
- 8千を超えるシグナルをコピー
- 金融ニュースで金融マーケットを探索
新規登録
ログイン