YouTubeにあるマーケットチュートリアルビデオをご覧ください
ロボットや指標を購入する
仮想ホスティングで
EAを実行
EAを実行
ロボットや指標を購入前にテストする
マーケットで収入を得る
販売のためにプロダクトをプレゼンテーションする方法
MetaTrader 4のためのテクニカル指標 - 78

Launch promotion For a limited time only: 30$ instead of 157$ Summary Create precise trend lines in a second Description This indicator will draw your trend lines automatically with great precision, saving you some precious time. It uses Bill Williams Fractals to identify the key points and draws both inner and outer trend lines.
Features Automatically draws precise trend lines

PINBAR SCANNER PRO with TREND and RSI + CCI OSCILLATORS filter This indicator has been designed to automatically and constantly scan entire market to find high probability pinbar formations, so you can just wait for the perfect trading opportunity come to you automatically.
PINBAR is the strongest candle reversal pattern known in technical analysis. It shows excellent areas to determine potential entries and exits with opportunity to use excellent risk and reward ratios. It includes an RSI an
DBD AND RBR CANDLESTICK PATTERN: This indicator based on the concept of two candlestick patterns. DROP BASE DROP (DBD) is a buy candlestick pattern and RALLY BASE RALLY (RBR) is a sell candlestick signal pattern. The arrows indicate potential signal setup for long trade and short trade. This indicator includes pop-up alert, push to phone and send to email alert which can be enabled and disabled. The color and size for DBD and RBR can be changed.
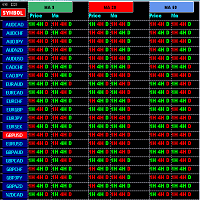
Constantly checking multiple pair & charts during day and still missing trade opportunities ? Let Market scanner do this job and you just focus on analysing opportunities and making trading decisions. Specially developed for need of intraday & scalping Traders . Must have tools for active traders. Market scanner indicator constantly monitors all Pairs from your MT4 watchlist for 9 /20 /50 Moving Average crosses in 1HR ,4HR & Daily Chart along with Closing price of last candle and alerts you if
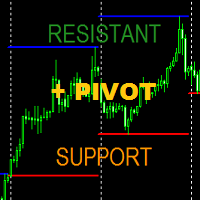
Indicator can drawing Support Level (Lowest price of choosed Time Frame) and Resistance Level (Highest price of choosed Time Frame), and this indicator can drawing last of Pivot Level from the Last of Support Resistance Level. Support and Resistance based Highest and Lowest at choosed Time Frame can be your next good experience for your forex trade to maximize your trade win and lost ratio.
Parameter : _S_and_R__Setup_ , Default is # SUPPORT AND RESISTANT # , No Need To Change Drawi

Forex Daily Percentage Calculator Forex Daily Percentage Calculator indicator is created for the Trader who cherishes the discipline of choosing only a percentage of their Trading account balance as profit per trade, per time or day. All you need to do is enter your desired percentage of your account balance, enable the notification popup alert to know when it has been attained so as to get out of the market till another day or trade. This helps the traders who are using it to determine a certai

強力な分析方法の1つは、Levyプロセスを使用した金融シリーズのモデリングです。これらのプロセスの主な利点は、最も単純なものから最も複雑なものまで、膨大な数の現象をモデル化するために使用できることです。市場におけるフラクタルな価格変動の考えは、レヴィ過程の特別な場合にすぎないと言えば十分でしょう。一方、パラメータを適切に選択すると、どのLevyプロセスも単純な移動平均として表すことができます。図1は、フラグメントを数倍に拡大したLevyプロセスの例を示しています。 価格チャートを滑らかにするためにLevyプロセスを使用する可能性を考えてみましょう。まず、線形プロセスをシミュレートするために使用できるように、Levyプロセスのパラメータを選択する必要があります。それから、異なる符号の係数を含む重みのシステムを得ます。このおかげで、私たちは財務範囲を平準化するだけでなく、そこに存在する反トレンドと定期的な要素を追跡することもできるでしょう。 インジケータの動作は、パラメータ LF を選択することによって設定されます。分析されるストーリーの深さを決定します。このパラメーターの許容値は、0か
弱い通貨に対して強い通貨を取引することは、常に最も安全なプレイです。この指標は、主要通貨間の相対的な強さを測定し、金融商品の選択、入場、退出をより簡単にします。基本的な考え方は、弱い通貨をカウンター通貨として使用し、その逆を使用することです。弱さに対する強さおよび強さに対する短い弱さを購入します。 [ インストールガイド | 更新ガイド | トラブルシューティング | よくある質問 | すべての製品 ] 一目で強い通貨と弱い通貨を見つける ある通貨を別の通貨と簡単に比較する 通貨は強化されていますか?長い間探します 通貨は弱くなっていますか?ショートパンツを探す 複数時間枠のダッシュボードを実装します それは取引のための最高品質の確認です インディケーターは最適化をまったく必要としません カスタマイズ可能なルックバック期間 インジケーターは再描画されていません インジケーターの解釈はかなり簡単です。 27通貨ペアの現在と以前の価格を比較し、各通貨が他のすべての通貨に対して獲得または損失した回数をカウントします。通貨は8つしかないため、最大スコアは+7(他のすべてに対して獲得された通貨

Session Volume Profile is an advanced graphical representation that displays trading activity during Forex trading sessions at specified price levels. The Forex market can be divided into four main trading sessions: the Australian session, the Asian session, the European session and the favorite trading time - the American (US) session. POC - profile can be used as a support and resistance level for intraday trading.
VWAP - Volume Weighted Average Price.
ATTENTION! For the indicator to
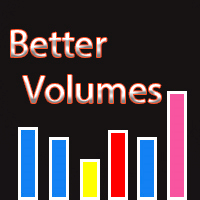
Description: The indicator of tick volumes Better Volumes allows you to assess the general mood of the market and quite accurately catch the moments of the formation of large movements. The indicator is a color histogram in an additional window. In the calculation of Better Volumes the Price Action combinations are taken into account, the values of the volumes with the height of columns and color marking are displayed. Input parameters: Display_Bars - the number of displayed bars (at 0, all are

This dashboard is designed and simplified for use on the standard mt4 terminal. There are 1 spread columns and adjustable signal columns for 5 different timeframes. For the signals, I used a special indicator that I developed and called mars. I haven't published the Mars indicator in the market yet. You can use this indicator only as dashboard signals. I'm in preparation for an expert for the indicator, and I will publish it when it's ready. ( Published https://www.mql5.com/en/market/product/40

ADX arrow このインジケーターは、ADXインジケーター(平均方向移動インデックス)の信号をチャート上のポイントとして表示します。
これにより、信号の視覚的識別が容易になります。 インジケータはまた、警告(ポップアップメッセージボックス)プッシュと電子メールに信号を送信する機能します。
パラメータ 期間-期間を平均化します。 計算に使用される価格:終値、始値、高値、安値、中央値(高値+安値)/2、標準値(高値+安値+終値)/3、加重終値(高値+安値+終値)/4。 アラート-アラートを有効/無効にします。 電子メール-電子メールへの信号の送信を有効/無効にします。 Push -pushへの信号の送信を有効/無効にします。

Mars 7 is a Trend indicator is a powerful indicator of TREND CHANGE for any par and any timeframe. It doesn't requires any additional indicators for the trading setup.The indicator gives clear signals about opening and closing trades.This Indicator is a unique, high quality and affordable trading tool.
Perfect For New Traders And Expert Traders Low risk entries. Never repaints signal. Never backpaints signal. Never recalculates signal. For MT4 Only Great For Scalping Great For Swing Trad
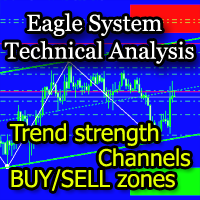
The EagleSystem indicator is a complete trading system.
The indicator algorithm determines wave movements, price channels formed, Pivot-levels, zones of intended purchases and sales (overbought / oversold zones).
The indicator can be used both independently and as an addition to any trading system.
Settings Alert for turning points - Alert when forming a point; Send Emails - Send to e-mail; Display the EagleSystem - Show price peaks; Alert at the color dot change - Alert when the dot chan

Arrow signal indicator for scalping Defines price reversals, kickbacks and trend changes All arrows remain in place and do not disappear Can send notifications to your phone or email Works on any currency pairs, metals and cryptocurrency Suitable for working with binary options Distinctive features Does not redraw; Defines trend changes; Sends signals to a smartphone or email; Advanced settings for fine tuning; Works on all timeframes and on all symbols; Suitable for trading currencies, metals,

Update: Push to mobile notification is now added as optinal in the settings. Most traders fail to generate profit because of the lack of so-called filters and scanners. If you want to win at trading you need a solid system and also a filtering tool for some or all of your entry criteria. It is impossible to follow 24 currency pairs, all the indices, stocks and commodities without a filtering tool. Imagine you can get an email any time CCI crosses bellow 100 and 0 when the price is bellow MA5 an

This is a very powerful indicator which is very useful in trend detection the way is used is similar to moving average but giving very reliable results. principle is very easy, that depicts a mobile support and resistance line when the price is below the orange line the trend is bearish and the line act as resistance and as soon as the resistance is broken and price is above the line then the trend becomes bullish and the line changes into the support line. this can be used in any time frames. i

The indicator algorithm with the highest accuracy generates input signals using the arrows. Strategy for trading in a flat, all the necessary functions built into one tool! The principle of the indicator is to automatically determine the current state of the market when it is placed on a chart, analyze historical data, based on historical data and display instructions to the trader for further actions. The system itself shows in the form of arrows when to buy and when to sell.

This indicator can be interpreted as a trend and channel indicator. The indicator divides the market into two parts. In one part, it is more promising to buy, the whole price zone is allocated for purchase. In the other part, for sale, there is also an entire zone. If you work with algorithms such as grids or catch-up, then this indicator is very good to use for work.

A great indicator that allows one to spot reversals, and follow a trend easily, on any timeframe. Works on any forex pair and other instruments. Works extremely well on exotic pairs It changes colour and direction and can be set to provide an alert for both long and short trades. It can also be used to set the stop loss and manually trail the trade. The indicator can be used on different timeframes easily, and is reliable in that it does not change during slight market corrections, once a tren
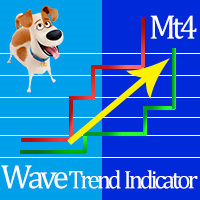
厳密に道氏の理論に従って作られたバンドの高低点は支持と抵抗の位置を区別するためにも使えるし、トレンドの起点を識別することもできます。
あなたがトレンドトレーダーであれ、日中の短線トレーダーであれ、または頭皮を剥いたトレーダーであれば、この指標はあなたに大きな助けになると信じています。
例えば、価格の下で緑の線を着ると、現在の空振り傾向が始まります。同様に価格の上で赤い糸を着ると、多頭傾向が始まります。対応する高い点と低い点が対応する開倉の有効なストップロスラインとして、対応する逆がストップの位置として通り抜けられます。
もちろん他の理論に協力してグラフ、カン、ウミガメなどの指標がより大きな役割を果たします。
他の私はここでは詳しく説明しません。お客様の取引戦略によってこの指標の他の興味深い用途を発見することができます。
指標には外部パラメータがなく、追跡柱の個数によって結果が違ってくることはありません。すべての使用条件は完全に市場から来ています。つまり市場はどうすればいいですか?永遠に市場のペースに従います。
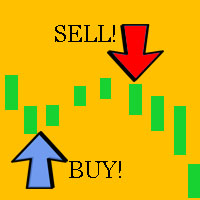
トレーダーにシグナルを売買するレディトレーディングシステム。チャート上にインディケータを配置するだけで十分です、それは自動的に市場の状況を分析し、トレンドの方向を決定し、サポートとレジスタンスのレベルを計算し、矢印の形でトレーダーにチャートを表示します。
ScalpingCirclesでのトレーディング戦略 これらのシグナルとの取引はとても簡単です。どの通貨ペアにもインディケータを追加して、チャートの一番下でそれがどのくらいの利益を予測するかを見てください。利益の額が少ないか、インディケータが損失を予測している場合は、通貨ペアまたは時間枠を変更することができます。利益の額が私たちに合っているならば、指標からの合図を待ちます。インディケータ設定を開き、SIGNAL = trueパラメータで指定した場合、インディケータは私達の電話とEメールにシグナルを送ります。インディケータが買いシグナル(青い矢印)を出したら、買い注文を出して0.05の注文量を設定します。得点セット100ポイントを取ります。トレーリングストップは50ポイントを設定します。ストップロスは120ポイントを設定しま

NEW check the FULL Version Including the private ICT tools limited so far until the release of the full 2016 Mentorship Core Content to the public. Indicator type: Money Management Calculator; Forex Position Size Calculator; Fixed or ATR value for Stop Loss and Take Profit levels; Average Position Size Indicator (True Average Price); Acc ount Information; Stop-out Level, Margin and Risk Exposure Warning, Forex Sessions; Institutional Levels Grid; Major Highs and Lows, Detailed Account Report an

DailyFx - EA for scalping. Works on the principle of a smooth analysis of the market and the determination of peak wave values. With the help of three adaptation algorithms, EA systematically scans the time segments of the price chart by determining the impulse points of contact between demand and supply. The smoothed neural network algorithm, learning from historical data of price behavior, predicts its further behavior.
Trading with the indicator is very simple. To do this, simply place the

Indicator patterns Price Action. The indicator uses in its work 12 patterns, a trend channel and horizontal price lines (support and resistance lines). You can work both by channel and lines, or simply by patterns. Some patterns are customizable. Below is a small manual.
Period of candles: Set the period on which the indicator will work.
Parameters of information on the chart
Consider trend and horizontal

Stick - уникальный авторский индикатор, отображающий сигналы в направлении основной тенденции, и против нее. Благодаря разнообразию настроек и фильтров индикатор можно настроить под свой стиль торговли. Stick подходит для любого таймфрейма, валютной пары. Сигналы индикатора не пропадают ни при каких условиях. Отличительной особенностью является возможность настроить сигналы индикатора отдельно для тенденции и против нее. С помощью Stick можно открывать сделку только в направлении основного д

indicator for trading binary options and forex trading. The indicator does not redraw the readings. when trading binary options, testing was performed. This indicator showed the good results correct predictions.
Under these conditions, the eur / usd m1 chart, when a signal appears, the transaction opens in the direction indicated by the indicator for 5 candles, then the truth is (5 minutes since in us the 1-minute chart of a candlestick is 1 minute) the result was.
When trading in the forex
Strike Line is an accelerator combining in itself a large number of the best tools filtered An exclusive algorithm ...
-------------------------------------------- It is great for scalping or binary options trading this the tool does not lag he draws there is a multi currency with him very simple work use given the tool stands with additional filters for example, like makdi or bolinger waves ......

非常に頻繁に、トレーダーは価格が近い将来に変化する可能性がある範囲を決定するという課題に直面しています。この目的のために、ジョンソン分布タイプSBを使用することができます。この配布の主な利点は、少量の累積データでも使用できることです。この分布のパラメータを決定する際に使用される経験的アプローチにより、価格チャネルの最大レベルと最小レベルを正確に決定することができます。 これらの値はさまざまな状況で使用できます。たとえば、マーケットオーダーのストップロスやテイクプロフィットレベル、未決注文のエントリーポイントを設定するために使用できます。また、これらのレベルはトレーリングストップを使用するときに方向付けることができます。さらに、十分に大きい履歴では、インディケータは上昇トレンドまたは下降トレンドの始まりを知らせることができます。そのような傾向があったならばまあ、またはその終わりについて。 この指標の主な不利な点は、価格の排出に対する極めて高い感度と、市場の状況の変化に対する反応がやや遅いことです。 青と赤の線は、それぞれ価格チャネルの最大値と最小値を示しています。緑色の線は、特定の市場

Mars 8 is a TREND indicator is a powerful indicator of TREND DIRECCTION for any par and any timeframe. It doesn't requires any additional indicators for the trading setup.The indicator gives clear signals about opening and closing trades.This Indicator is a unique, high quality and affordable trading tool. Can be used in combination with other indicators Perfect For New Traders And Expert Traders Low risk entries. Never repaints signal. Never backpaints signal. Never recalculates signal. For

Motivated from: A market is the story of cycles and of the human behavior that is responsible for overreactions in both directions. - Seth Klarman
NeuroWave Scalper PRO is a advanced powerful cycle algorithm which depicts the cycles of market in a effective manner.This Indicator works in trending as well as ranging market conditions. This indicator is perfect for scalp trades as well as swing trades. NeuroWave Scalper PRO is not just an indicator, but a trading strategy itself. It doesn

Chart Linker This tool is indicator for linking charts in Metatrader 4. Thanks to this tool you have to change symbol only in the main window and all other change automatically. Add this tool to all charts that you want to be linked with each other. Set one chart as a main. Change symbol in the main window and linked windows change automatically to the new symbol.
Compare to https://www.mql5.com/en/market/product/30048 Chart linker can work simultaniously with other indicators and/or expe

Automatic redrawing of Trend Supports and resistances levels and Possible Wedge pattern formation to indicate price breaking of Rising Wedge (signal SELL) or price breaking of falling Wedge (signal BUY) Very simple and smart indicator ALERTS AND MOBILE NOTIFICATIONS availavle !!! you can edit the calculation bars of the bars count for formation of the trend lines and the initial shift from current price Smaller values for bars /shift inputs when using Higher Time frames (D1-H4) and the reverse
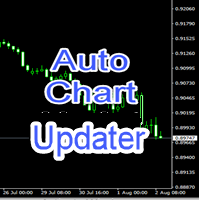
Auto Chart Updater Indicator is created to update the window chart for any indicator, expert or any trading program receive fresh data retrieval at xx period interval set by the user as a preference. It is laced with on-chart Candle clock to give the user the sense of time when the updater would refresh the chart or the remaining time for the candle/session to end. It also has an option for the user to choose when exactly does he/she wants the Updater to update the chart. The User can also selec
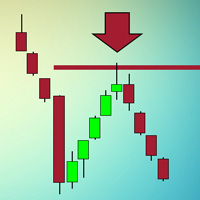
Индикатор, который ищет качественные точки входа в рынок и отображает их в виде стрелок. Действует по сложному алгоритму. Сначала ищет на графике специальные уровни, которые обязательно должны быть пробиты импульсом. Если цена возвращается к этому уровню в виде свечи с длинной тенью и маленьким телом и касается уровня только тенью - возникает точка входа. Не перерисовывается! Лучше всего выглядит и отрабатывает на Н1.
Может использоваться как: Индикатор уровней, где цена будет останавлива

MM Trend Direction follow trend. Color change trend changed. Works in EURUSD/GBPUSD/AUDUSD/USDCHF/EURNZD/NZDUSD/SILVER/USOIL/US500/AUS200/USDTRY/EURTRY and all pairs
Best timeframe 15M
Signal on close of a bar.
DOES NOT repaint. DOES NOT repaint. DOES NOT repaint. DOES NOT repaint.
DOES NOT recalculate. DOES NOT recalculate. DOES NOT recalculate. DOES NOT recalculate NOTE : COLOR CHANGED TREND CHANGED
Settings : No Settings
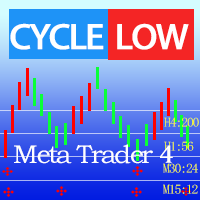
物事を行うと取引を行うには、時間敏感な、地理的、人々フレンドリーです。通常、我々は唯一の価格は、価格を停止するために価格を停止するには、価格を気にするだけで、どの価格は、利益を止めるためには、地理的利点と呼ばれる。小さな注意は、位置を開くには、損失を停止し、Tianshiと呼ばれる収益を停止するときに支払われます。
この指標は、あなたの家族、旅行、および遊びに同行するためにコンピュータをオフにするときに取引を行うときに見つけるのを助けることができます。
あなたはチャートトレーダー、トレンドトレーダー、短期短期トレーダー、または頭皮トレーダーであるかどうか、私はこの指標はあなたに大きな助けとなると思います。
たとえば、トレンドラインを描画するときは、対応する時間枠での安値を接続すると、この時間は、トレンドラインをより興味深い見つけるでしょう。
私は、ここでこれ以上の詳細に入りません。あなたの取引戦略に応じて、この指標の他の興味深い用途を見つけることができます。
指標は外部パラメータを持た

:::: It is programmed to work on any M5 Chat windows !! Used to determine the Strongest currency pairs and the Weakest pairs also detect the peak of deviation of currencies strength IT CAN BE USED FOR INDICES AND STOCKS TOO !! Strategy one : It can be used in to BUY Strongest pair and SELL Weakest one Strategy two: It can be used on Daily basis to Hedge BUY Strongest pair with high % (ex: +1%) and BUY Weakest one with % lower(ex: -0.7%) the same with SELL Strategy three: on 3days or above ca
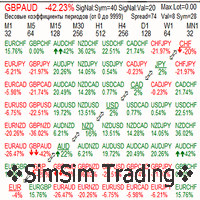
SimSim Tournament Currency Strength Table This is a multi-currency indicator; it shows the relative strength of the currency and 28 major currency pairs. There are many similar indicators on the market, but let there be one more. In this indicator, unlike others, you can specify weighting factors for each timeframe.
Weighting factors. Why are they? Each trader prefers to work with a specific time frame, which is the main one for him, and the signals from him are most important. Examples of

Ultra Arrows Scalper Pro Ultra Arrows Scalper pro indicator for efficient binary options trading ----------- complete lack of redrawing -----------... ....... ... An arrow is formed on the current candle and indicates the direction of the next candle and the possible direction of the trend in the future. Enter the deal is on the next candle. its advantages: signal accuracy. complete lack of redrawing. You can choose absolutely any tool. the indicator will provide many profitable and accurate
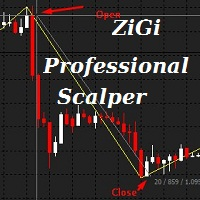
ZiGi Professional Scalper Indicator: Real Wave Analysis Tool This indicator reveals the true waves of the market by identifying alternating highs and lows on the price chart, thus displaying the market's wave structure. The algorithm of this indicator is entirely new, and its association with ZiGi Professional Scalper and Zigzag is purely cosmetic. It is based on eight radically different algorithms and is capable of calculating market volumes in real-time. When using this indicator, manual wave
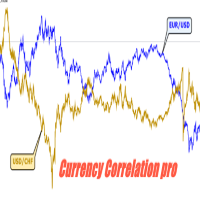
Currency Correlation pro
Currency correlation happens when the price of two or more currency pairs moves in conjunction with one another. There can be both positive correlation, where the price of the currency pairs moves in the same direction and negative correlation, where the price of the currency pairs moves in opposite directions. this indicator put the price of 5 pairs on sub-windows so you see what happens in one chart.
How to use Correlation Indicator?
You can simply choose curren
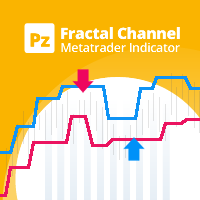
これは、変動するフラクタル期間のブレイクアウトをトレードするための非常にシンプルでありながら効果的な指標です。フラクタルは、奇数のバーの価格形成であり、中央のバーが形成の最高または最低価格ポイントです。これらの価格は短期のサポートとレジスタンスのレベルとして機能し、このインジケーターは価格チャネルを描き、ブレイクアウトを表示するために使用します。 [ インストールガイド | 更新ガイド | トラブルシューティング | よくある質問 | すべての製品 ] 取引が簡単 フラクタルブレイクアウトは長いトレンドを開始することができます フラクタルチャンネルは素晴らしいトレーリングストップメソッドです 再描画および非再描画ではありません あらゆる種類のアラートを実装します カスタマイズ可能な色とサイズ 期間を長くすると、ブレークアウトの信頼性が高まりますが、出現頻度は低くなります。この指標は、より高いタイムフレーム分析で確認する必要があります。一般に、短い時間枠ではフラクタル期間を増やし、長い時間枠ではフラクタル期間を短くします。
入力パラメータ 期間:フラクタルを計算するバーの量。奇数で
Fast Signal Fx This indicator is working very simple. The indicator will detect the swing pattern and find the return point. The main structure was combined with Stochastic Oscillator level for return point and moving average calculation for confirm the direction. The important strategy is making fast signal for scalper trading technique with high frequency trade. Indicator Installation Attach this indicator to the chart window of currency pairs. The recommended currencies are EURUSD, GBPUSD, U

Indicator is used for: defining price probability distributions. This allows for a detailed representation of the channel and its borders and forecast the probability of a price appearing at each segment of its fluctuations; defining the channel change moment. Operation principles and features Indicator analyzes a quote history on lower timeframes and calculates a price probability distribution on higher ones. Forecast algorithms allow the indicator to calculate probability distributions and m
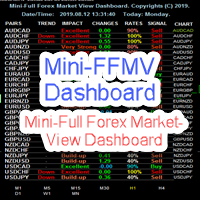
MINI FFMV Dashboard MINI FFMV Dashboard is a MINIATURE custom indicator of FULL FOREX MARKET-VIEW DASHBOARD created to give the Traders a full view of what is going on in the market. It uses a real time data to access the market and display every bit of information needed to make a successful trading. It shows as many as 30 currency pairs or as allowed to display in the Market Watch of your MT4 USAGE: For Solo Trading For Basket Trading (See the screenshot on how) COMPONENTS: Trend: Overall tren

Mini Forex Market-View Dashboard and Mini-CSM Mini Full Forex Market View Dashboard is a miniature creation of FULL FOREX MARKET_VIEW Custom indicator created to give the Traders a full view of what is going on in the market but in a partial matter to make it conscise. It is useful most especially for those who don't like bogus indicators or those who have a PC with limited screen size. It uses a real time data to access the market and display every bit of information needed to make a successful

This indicator calculate the minimum,maximum,average and relative (to points of the bar) spread in the chart applied period. The indicator must be applied to one or more different period on a Pair and analyze the spread for all the Pairs available by the Broker. The csv output for one minute chart is something like this https://gofile.io/?c=K5JtN9 This video will show how to apply the indicator https://youtu.be/2cOE-pFrud8

An Indicator that calculates the Pivot Point line, along with the 2 levels of support and resistance lines, known as S1, S2, R1, R2 respectively.
The formulas for calculation are as follows:
Pivot point (PP) = (High + Low + Close) / 3
First level support and resistance: First resistance (R1) = (2 x PP) – Low First support (S1) = (2 x PP) – High
Second level of support and resistance: Second resistance (R2) = PP + (High – Low) Second support (S2) = PP – (High – Low)
The trader can adj

このシステムは、初心者トレーダー向けに一貫したエントリを作成するように設計されたシンプルなシステムです。同じ方向の2つの連続したバーが見つかり、ADRおよびADXインジケータが確認されると、入力矢印が配置されます。アイデアは、システムの聖杯を探しているのではなく、市場に参入する規律ある方法を持つためにシステムを使用しているということです。代わりに、お金とリスク管理に焦点を当てる必要があります。 ピボットポイントをターゲットラインとして使用して、可能性のあるエントリに利益を生むスペースがあるかどうかを判断し、報酬/リスク比が最小2対1の場合にのみ市場に参入することをお勧めします。そのため、エントリの場所から次のピボットラインまでのスペースは、エントリからストップロスラインまでのスペースの少なくとも2倍の大きさでなければなりません。 リスクはストップロスの金額であり、アカウント値の0.5〜1.0%である必要があります。使用を開始する場合、リスクはさらに少なくなり、0.2%になる可能性があります。利益も非常に少ないため、それは非常に少ないように見えますが、いくつかの損失を連続して取ることを学

Mars 9 is a TREND indicator is a powerful indicator of TREND DIRECCTION for any par and any timeframe. It doesn't requires any additional indicators for the trading setup.The indicator gives clear signals about opening and closing trades.This Indicator is a unique, high quality and affordable trading tool. Can be used in combination with other indicators
Perfect For New Traders And Expert Traders Low risk entries. Never repaints signal. Never backpaints signal. Never recalculates signal.

Insider Scalper Binary This tool is designed to trade binary options.
for short temporary spends. to make a deal is worth the moment of receiving the signal and only 1 candle if it is m1 then only for a minute and so in accordance with the timeframe.
for better results, you need to select well-volatile charts....
recommended currency pairs eur | usd, usd | jpy ....
the indicator is already configured, you just have to add it to the chart and trade .... The indicator signals the next can

インディケータは現在のクオートを作成し、これを過去のものと比較して、これに基づいて価格変動予測を行います。インジケータには、目的の日付にすばやく移動するためのテキスト フィールドがあります。
オプション:
シンボル - インジケーターが表示するシンボルの選択;
SymbolPeriod - 指標がデータを取る期間の選択;
IndicatorColor - インジケータの色;
HorisontalShift - 指定されたバー数だけインディケータによって描画されたクオートのシフト;
Inverse - true は引用符を逆にします。false - 元のビュー。
ChartVerticalShiftStep - チャートを垂直方向にシフトします (キーボードの上下矢印)。
次は日付を入力できるテキストフィールドの設定で、「Enter」を押すとすぐにジャンプできます。
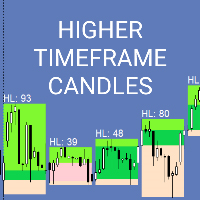
The indicator draws candles of the selected high timeframe on the current chart. It supports both standard timeframes and custom ones set in minutes. Built-in support for displaying the size of the candle, its body, as well as the upper and lower shadows. Alerts when High / Low breaks the previous candlestick of the selected timeframe. Customized types of elements for the simultaneous operation of several indicators on the same chart.

Auto redrawn Pivot support resistance horizontal lines with signal of Buy/Sell possibilities with SL level and with trend support resistance lines too used for all symbols and time frames you can adjust inputs parameters (only 2) and test it on various symbols and time frames input number of bars for calculation and moving average for signal accuracy example : use it on M30 time frame with input 200 for bars count and 100 for MA

Price Predictor is an indicator that shows precise price reversals taking into account a higher time frame and a lower time frame candle patterns calculations it is great for scalping and swing trading . Buy and sell arrows are shown on the chart as for entry signals. BIG Arrows indicates the trend - SMALL Arrows signal a trade (BUY/SELL) - A Green BIG UP Arrow with a support green line indicates a Bull Market : wait for buy signal - A Green SMALL Up Arrow after a BIG green arrow is

works great with the trend, ideal for traders who trade using the scalping system. This is a pointer indicator. how to make deals. when the blue one appears, you need to open a trade to increase by 1 candle if the timeframe is m1 then for 1 minute, etc. if a red dot appears, you should make a deal to reduce it by 1 candle. Indicator signals appear along with a new candle; the working candle is the one on which the signal is located.

The easiest indicator to know to which address the price is MOVED: taking into account other indicators to measure the exact price direction more accurately and with less noise. it is useful to know when to perform a BUY operation one from SELL

レベルスキャナー インジケーターは、すべての サポートレベルとレジスタンスレベル とともに、チャート上の 上位 エリアと 下位 エリアの識別を自動化するように設計された強力なツールです。これには ハル移動平均 の使用が組み込まれており、実際の傾向をより明確かつ滑らかに表現します。このインジケーターは驚くべき速度で動作するため、トレーダーは重要な関心領域を迅速に特定し、より多くの情報に基づいた取引上の意思決定を行うことができます。 レベルスキャナーの際立った機能の 1 つは、その多用途性です。あらゆるシンボルと時間枠に適用できるため、幅広い取引戦略に適しています。このインジケーターは効率的にシグナルを生成し、トレーダーが潜在的な取引設定を迅速に特定できるようにします。さらに、個々の取引戦略や好みに合わせて完全にカスタマイズできるユーザーフレンドリーなパラメーターも提供します。 トレーダーは、独自の期間、CCI、RSI、ストキャスティクス指標を通じてシグナルをフィルター処理することで、シグナルをさらに洗練させることができます。この機能により、トレーダーはインジケーターの出力を特定の要件や市
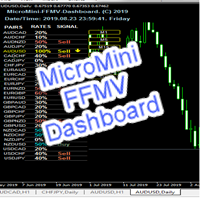
MicroMini FFMV Dashboard This is a custom indicator created to give Traders a full view of what is going on in the market. It uses a real time data to access the market and display every bit of information needed to make successful trading. THIS IS A MicroMini size of the FULL FOREX MARKET VIEW DASHBOARD INDICATOR. This is for those who don't like the Indicator to cover all the charts and for those who don't like BOGU S things. They practically perform the same operation but MicroMini FFMV Dashb
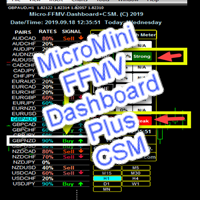
MicroMini FFMV Dashboard+CSM This is a custom indicator created to give Traders a full view of what is going on in the market. It uses a real time data to access the market and display every bit of information needed to make successful trading. To add value to the trading operation, Currency Strength Meter is added to it in order to consolidate the effective work of this indicator.
THIS IS A MicroMini size of the FULL FOREX MARKET VIEW DASHBOARD INDICATOR with CSM added. This is for those who
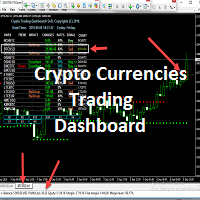
Micro Crypto Trading Dashboard
This is a custom indicator created to give CRYPTO TRADERS a full view of what is going on in the Crypto market. It uses a real time data to access the market and display every bit of information needed to make successful trading. This is a Micro size of the Compact Crypto Market Trading Dashboard Indicator created mainly for trading Crypto Currencies Markets for a living.
They practically perform the same operation but MicroMini FFMV Dashboard has a few feature

+Pips is a simple indicator which was design with FIVE trading confirmations in mind that works on all pairs and time frame. It's great for scalping, as it is a powerful indicator on its own. This indicator can be used by any type of trader(new or experience). The choice of sending notification to your mobile device and sounding alerts is up to the user as this is an optional setting. This is all you need no more cluster to your charts. If high probability and low risk trades, that alerts and se

A simple Approach to Elliot waves patterns Signal generated on trend continuation when breaking the "5" level or on corrective direction after 1-5 waves detected 1-5 labeled points arrows used for signal UP/DOWN direction Chaotic patterns in Blue are drawn all times until a 1-5 Elliot wave pattern detected 1-5 Red pattern in Bull Market : UP arrow in BULL trend continuation OR DOWN arrow as a reversal DOWN direction as pattern correction 1-5 Green pattern in Bear Market :DOWN arrow in BEAR tr

The TRs indicator works by using the waveform function. Thus, all entry points will be the optimal points at which motion changes. Entry points should be used as points of potential market reversal. The indicator settings by default are quite effective most of the time. You can customize them based on your needs. But do not forget that the approach should be comprehensive, the indicator signals require additional information to enter the market.
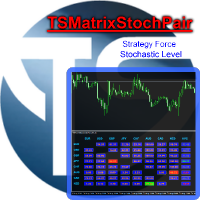
TSMatrixStochasticPair Indicator for currency strength trading, through the Stochastic indicator. Intelligent algorithm for scalper and intraday traders. The benefits you get: Never redesigns, does not retreat, never recalculates. Works on forex, timeframe from M1 to D1. Integrated pop-up, push notification and sound alerts. Easy to use. Parameters: KPeriod: k_ stochastic parameter. DPeriod: D_ stochastic parameter. Slowing: stochastic parameter. MA_Method:
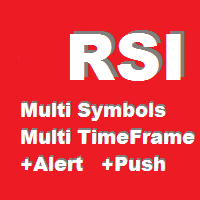
Multicurrency RSI indicator that works on any set of timeframes. The set of symbols is chosen from the Market Watch of the terminal. The table is customizable (color, width, font size, line height, column width) Alerts and sending push-notification on a smartphone.
Adjustable Parameters: Signal_Bar - choose a bar for analysis (current or closed) 6 switches for timeframe sets Indicator_Period - period of the RSI indicator Level_Signal - the level of the indicator value to generate signal (the o

SSA stands for 'Singular Spectrum Analysis'. It combines elements of classical time series decomposition, statistics, multivariate geometry, dynamical systems and signal processing. SSA decomposes time series into a sum of components (ETs), with each component representing a lower smoothing, using several SVD (Singular Value Decompositions).
It is a powerful filtering process used in many fields of research (climatology, biomedical, aerospace, etc), where high quality forecasting and smoothin

SSA stands for ' Singular Spectrum Analysis '. It combines elements of classical time series decomposition, statistics, multivariate geometry, dynamical systems and signal processing. SSA decomposes time series into a sum of components (ETs), with each component representing a lower smoothing, using several SVD ( Singular Value Decompositions ).
It is a powerful filtering process used in many fields of research (climatology, biomedical, aerospace, etc), where high quality forecasting and smoo

The Th3Eng PipFinite indicator is based on a very excellent analysis of the right trend direction with perfect custom algorithms. It show the true direction and the best point to start trading. With StopLoss point and Three Take Profit points. Also it show the right pivot of the price and small points to order to replace the dynamic support and resistance channel, Which surrounds the price. And Finally it draws a very helpful Box on the left side on the chart includes (take profits and Stop loss
MetaTraderマーケットはMetaTraderプラットフォームのためのアプリを購入するための便利で安全な場所を提供します。エキスパートアドバイザーとインディケータをストラテジーテスターの中でテストするためにターミナルから無料のデモバージョンをダウンロードしてください。
パフォーマンスをモニターするためにいろいろなモードでアプリをテストし、MQL5.community支払いシステムを使ってお望みのプロダクトの支払いをしてください。
取引の機会を逃しています。
- 無料取引アプリ
- 8千を超えるシグナルをコピー
- 金融ニュースで金融マーケットを探索
新規登録
ログイン