Смотри обучающее видео по маркету на YouTube
Как купить торгового робота или индикатор
Запусти робота на
виртуальном хостинге
виртуальном хостинге
Протестируй индикатор/робота перед покупкой
Хочешь зарабатывать в Маркете?
Как подать продукт, чтобы его покупали
Технические индикаторы для MetaTrader 4 - 9
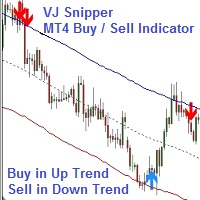
VJ Sniper - это индикатор для совершения покупки/продажи в MT4: покупка осуществляется при восходящем тренде, а продажа - при нисходящем. Предпосылки: Ни один встроенный индикатор MT4, как Stochastic, CCI или DeMarker и т.д., не работает самостоятельно. Но их сочетание с прогнозированием тренда отлично работает и превосходно находит точки входа. Данный индикатор составлен специально для обеспечения оптимальных результатов и максимального снижения количества ложных сигналов. Это не Грааль и не 10

Divergence Divergence refers to when the price of a currency pair moves in one direction while the trend indicator is moving in the opposite direction. With divergence, there can be positive and negative signals. Divergences in Forex trading are quite common signals of technical analysis. These are basic early Forex signals indicating the trend reversal and filter false signals. Application of this indicator It is usually not easy to detect divergences by the trader and it may be time-consuming

Smooth Heikin Ashi provides a more smoothed signal of bull or bearish trends than regular Japanese candlesticks, or even the standard Heikin Ashi candles. Heikin Ashi as an alternative candlestick pattern that has been in use since its invention in Japan back in the 1700s. On normal Japanese candlesticks, there is a lot noise with mixed bearish and bullish candles side by side, even during trends. Heikin Ashi reduces this noise leaving an easier visual representation of trends. This indicator is

- Real price is 60$ - 50% Discount ( It is 30$ now )
Contact me for instruction, any questions! Introduction Triangle chart patterns are used in technical analysis , which is a trading strategy that involves charts and patterns that help traders identify trends in the market to make predictions about future performance.
Triangle Pattern Scanner Indicator It is usually difficult for a trader to recognize classic patterns on a chart, as well as searching for dozens of charts and time f
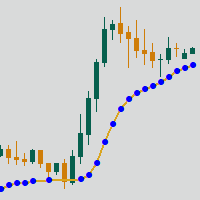
Adaptive Moving Average (AMA) — трендовый индикатор, использующий скользящую среднюю и фильтр рыночного шума. Особенностью индикатора являются точки синего и красного цветов, показывающие силу тренда.
Рекомендации по торговле:
Вспомогательный индикатор Определение тренда Определение силы тренда Определение потенциальной точки разворота Главный индикатор Показывает точки входа свинг-торговли Выступает динамической поддержкой и сопротивлением Рекомендации по использованию: Любой инструмент Любой
FREE

Мультитаймфреймовая панель Parabolic SAR Dashboard позволяет добавлять и отслеживать тренды PSAR. Мультитаймфреймовая панель Parabolic SAR Dashboard позволит вам сэкономить много времени и даст единое представление о рынке при помощи PSAR. Словом, можно просто следить за одним окном и получать обзор до 21 инструмента на вашей платформе MetaTrader 4. Индикатор откроется в дополнительном окне. Ниже показаны особенности индикатора PSAR Dashboard Изменение настроек PSAR: Панель PSAR Dashboard постав

Индикатор создан для торговли на пробое горизонтальных каналов, поиска пробитий экстремумов и определения целей по уровням Фибоначчи. Индикатор позволяет максимально просто и быстро в визуальном режиме построить горизонтальный канал между нужными вам экстремумами. При этом он автоматически оденет (если данная опция включена в настройках) на данные экстремумы уровни Фибоначчи. Помимо этого при пробое одного из экстремумов и/или уровня Фибоначчи - 50%, индикатор подаст звуковое оповещение и выведе

** All Symbols x All Timeframes scan just by pressing scanner button ** - Discount : it is not 49$, it is just 30$. *** Contact me to send you instruction and add you in "Trend Reversal group" for sharing or seeing experiences with other users. Introduction: Trendlines are the most famous technical analysis in trading . Trend lines continually form on the charts of markets across all the different timeframes providing huge opportunities for traders to jump in and profit on the action.

Индикатор Volume Spike - это полезный инструмент для определения направления рынка.
Принцип работы: Индикатор Volume Spike находит пики и рисует по ним прямоугольник, отправляя алерты и всплывающие уведомления, в которых говорится о направлении рынка. Индикатор позволяет выбрать таймфрейм, на котором будет проводиться анализ объема, а также подает цветные визуальные сигналы в виде прямоугольника. Он определяет обоснованные рыночные сигналы, а также находит превосходные точки поддержки и сопроти

CMA dashboard is designed to help traders in identifying trend on multiple timeframes and symbols. It displays a clear state of the overall trend at one place without the need to navigate between different charts and timeframes. This saves time and makes decision making process fast so that potential opportunities are not missed. It is based on Corrected moving averages available here Features
Parameters for signal optimization Inputs for multiple timeframes and symbols Usage Higher timeframe

Индикатор MQLTA Supertrend Multi Timeframe сочетает в себе значения Supertrend, найденные на нескольких таймфреймах, чтобы подтвердить тренд пары. Для работы утилиты необходим бесплатный индикатор MQLTA Supertrend Line - https://www.mql5.com/en/market/product/25951.
Как он работает? Индикатор проверяет состояние Supertrend на всех выбранных таймфреймах и отображает результат в виде легко читаемой таблицы.
Как торговать с помощью индикатора Supertrend Multi Timeframe Покупку следует совершать,
FREE
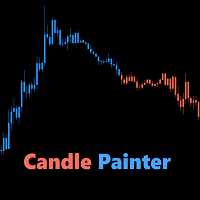
Candle Painter объединяет 13 индикаторов и раскрашивает свечи в соответствии с их показаниями. Вы можете выбирать любые из предусмотренных индикаторов и следовать за трендом либо получать предупреждения об областях перекупленности/перепроданности. Для осцилляторов можно установить уровни восходящего и нисходящего трендов . Осцилляторы с основными и сигнальными линиями, такие как MACD, Stochastic и RVI, также имеют опцию следования за трендом по пересечениям. Уровни перекупленности/перепроданност

BeST_Gann Hi-Lo Strategy is an MT4 indicator that is based on the Gann Hi-Lo Activator the famous trend-following indicator that allow us to to enter a trade quite early while also stay in a trade as longer as we can for taking profit.While it is built of a moving average it helps traders determine the direction of the trends and to produce with-trend trading signals.
This indicator is in fact a simple moving average of the highs and lows of the previous period. It follows the trends in the mark
FREE
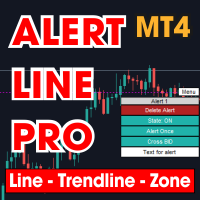
This is MT4 version , MT5 on this link : Alert Line Pro MT5 Alert line pro allows to make alert when price cross these objects: Horizontal lines Trendline Price Zone (Rectangle) Alert when close current bar (have new bar) When the price crosses the alert lines, the software will sound an alarm and send a notification to the MetaTrader 4 mobile application. You need to settings your MetaQuotes ID of MT4 apps to MetaTrader4 software to get notification to the mobile phone. Sound files must be
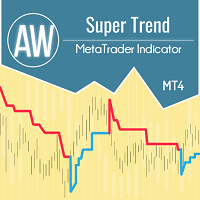
AW Super Trend - Это один из наиболее популярных классических трендовых индикаторов. Имеет простую настройку, позволяет работать не только по тренду, но и отображает уровень стоплосса, который рассчитывается данным индикатором.
Преимущества:
Инструменты: Валютные пары , акции, сырьевые товары, индексы, криптовалюты. Таймфрейм: М15 и выше. Время торговли: Круглосуточно. Показывает направление текущей тенденции. Ведет расчет стоплосса. Может быть использован при работе с трейдингом. Три
FREE
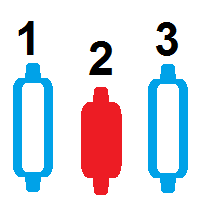
индикатор свечного счетчика этот индикатор считает свечи, которые есть на графике любого таймфрейма бесплатный барный счетчик для загрузки на mt4 счетчик свечей подсчитывает количество свечей на большом графике с помощью этого счетчика свечей вы можете выполнять автоматический подсчет свечей бесплатный индикатор количества свечей для автоматической загрузки и подсчета баров bar counter to count the bars count candle counter indicator mt4 count candle счетчик свечей для MT5 Если вам интересен это
FREE

Pips Hunter PRO разрабатывался в течение нескольких лет и является улучшенной версией своего предшественника. Этот мощный индикатор анализирует рынок и историю цен, чтобы генерировать входы на покупку и продажу. Для расчета этих входов он использует различные индикаторы, которые работают вместе, а также сложный статистический логарифм, который отфильтровывает менее благоприятные входы и устраняет их / MT5 версия .
Особенности Отсутствие перерисовки
Данный индикатор не меняет свои значения при
FREE
Level Box Tool is a powerful and user-friendly custom indicator designed for traders who utilize technical analysis tools like rectangles and trend lines to identify key support, resistance, and price zones. This tool simplifies and speeds up the process of marking chart levels, offering both visual clarity and precision with its fully customizable panel, and now includes price-cross alerts — so you’ll never miss a key level again. MT5 Version - https://www.mql5.com/en/market/
FREE

This indicator is designed to find the difference in RSI price and indicator. This indicator shows the price and indicator difference on the screen. The user is alerted with the alert sending feature. Our Popular Products Super Oscillator HC Cross Signal Super Cross Trend Strong Trend Super Signal
Parameters divergenceDepth - Depth of 2nd ref. point search RSI_Period - Second calculation period indAppliedPrice - Applied price of indicator indMAMethod - MA calculation method findExtInte

Технический индикатор производящий структуризацию графиков и выявляющий циклические движения цены.
Может работать на любых графиках.
Несколько типов оповещений.
Есть дополнительные стрелки на самом графике.
Без перерисовки на истории, работает на закрытии свечи.
Рекомендуемые TF от M5 и выше.
Прост в использовании и настройке параметров.
При использовании 2 индикаторов с разными параметрами можно использовать без других индикаторов.
Имеет 2 входных параметра
Цикличность и Продолжительность сиг

Currency Correlation Plus – более дорогая версия индикатора Currency Correlation. Индикатор снабжен сигналами и имеет больше функций. Он позволяет видеть и анализировать корреляции. Наличие второго графика помогает анализировать и торговать сразу несколькими валютами. Можно разместить несколько пар на графике. Введите нужную пару в настройках и добавьте на график. Более дешевая версия: https://www.mql5.com/ru/market/product/14052 Также рекомендую ознакомиться с продуктом: https://www.mql5.com/ru
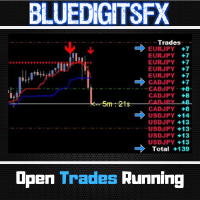
MT5 Version Available Here: https://www.mql5.com/en/market/product/62376
Telegram Channel & Group : https://t.me/bluedigitsfx
V.I.P Group Access: Send Payment Proof of any of our Paid Products to our Inbox
Recommended Broker: https://eb4.app/BDFXOsprey * The Most Sought After Pip Counter for Metatrader ! Features
Will show Currency Symbol in BLUE for Buy positions. Will show Currency Symbol in RED for Sell positions. Will Show pips in BLUE Color for Positive Pips Will Show pips in RED
FREE
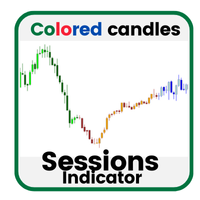
This indicator shows trading sessions using colored candles. It's made for volume profile and supply/demand traders to quickly see when specific candles are formed during different times or trading sessions.
Take a look at the screenshots for an example of usage.
Core Features: Different colors for bullish and bearish candles, making it easy to distinguish between them.
FREE
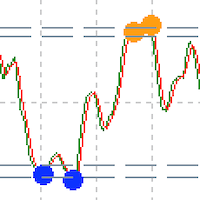
Custom Relative Strength Indicator with multiple timeframe selection About RSI The relative strength index is a technical indicator used in the analysis of financial markets. It is intended to chart the current and historical strength or weakness of a stock or market based on the closing prices of a recent trading period. Features
Indicator gives alert when reached oversold or overbought levels Gives dot indication while reaching levels. Can set indicator bar alert intervals for alerts Can choos
FREE

indicators to facilitate analysis based on Oma Ally's BBMA strategy by displaying CSAK (CSD), CSM and Extreme labels on the chart 1. Displays the Bollinger Band line 2. LWMA 5-10 High and Low 3. EMA 50 4. Fibonacci 5. MHV . area 6. Alert & Show labels BBMA consists of the use of 2 indicators: Moving Averages Bollinger Bands BBMA consists of 3 types of entries: Extreme MHV Re-Entry Moving Average Settings: There are 5 MAs used in the system: 2 High Moving Averages, 2 Low Moving Averages and
FREE

This is a Multi pair and Multi time frame dashboard. The founder of the system is Mr. Oma Ally, which is a system based from Bollinger Band and Moving Average(BBMA). BBMA consists of the use of 2 indicators: Moving Averages Bollinger Bands BBMA consists of 3 types of entries: Extreme MHV Re-Entry Rejection EMA50 This Dashboard Help you to scan current Extreme, Reentry setup, Rejection EMA50 and also MHV How to read signals:
find the same color in 3 different timeframes in succession
For exampl
FREE
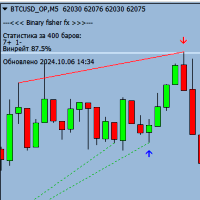
Binary Fisher FX - это мощный индикатор для бинарных опционов, который работает на любом таймфрейме и с любой валютной парой. Этот индикатор предназначен для выявления трендовых движений и указывает на входные точки в виде стрелки перед закрытием текущей свечи. Основные особенности индикатора: Работает на любом таймфрейме (M1, M5, M15, M30, H1, H4, D1) Поддерживает любые валютные пары Экспирация от 1 до 3 свечей (по умолчанию 1 свеча) Указывает на входные точки в виде стрелки перед закрытием тек
FREE

** All Symbols x All Timeframes scan just by pressing scanner button ** - Discount : it is not 40$, it is just 30$. *** Contact me to send you instruction and add you in "M W Scanner group" for sharing or seeing experiences with other users. Introduction: Double Top(M) and Double Bottom(W) is a very repetitive common type of price reversal patterns. Double Top resembles M pattern and indicates bearish reversal whereas Double Bottom resembles W pattern and indicates a bullish reversal

GoldTrend MT4 - is a leading indicator for Gold on MetaTrader 4
- In Update version has been added new ability on USD pairs
( AUDUSD, EURUSD, GBPUSD, NZDUSD, USDCAD, USDCHF, USDJPY )
- very easy to use , even for beginners
- Stoploss and Take Profit provided - no repaint, no redraw and no lagging
When you decide to enter the global market , then there is a technical skill you absolutely must have, - which is all about trends .
Why - GoldTrend is different from others :
Not only uptre

BeST Oscillators Collection is a Composite MT4 Indicator including the Chaikin,Chande and TRIX Oscillators which by default are contained in MT5 but not in MT4 platform. It also provides the option of displaying or not a Mov. Avg. as a Signal Line and the resulting Signals as Arrows in a Normal (all arrows) or in a Reverse Mode (without showing up any resulting successive and of same type arrows). Analytically for each one of the specific Oscillators: The Chaikin Oscillator ( CHO ) is
FREE

Description: This indicator draw ZigZag Line in multiple time frame also search for Harmonic patterns before completion of the pattern.
Features: Five instances of ZigZag indicators can be configured to any desired timeframe and inputs. Draw Harmonic pattern before pattern completion. Display Fibonacci retracement ratios. Configurable Fibonacci retracement ratios. Draw AB=CD based on Fibonacci retracement you define. You can define margin of error allowed in Harmonic or Fibonacci calculations
FREE

Закрытие предыдущего дня и смещение баров для MetaTrader! Индикатор Закрытие предыдущего дня и смещение баров - это инструмент, разработанный для улучшения технического анализа и принятия решений в торговле. С помощью этого индикатора вы получите подробную информацию о уровнях открытия, максимума, минимума и закрытия любого бара, что позволит провести точный и всесторонний анализ движения рынка. Представьте себе возможность поместить один таймфрейм в другой, позволяя детально анализировать кажды
FREE

This Indicator is a affordable trading tool because with the help of Popular Developers & Support of M Q L Platform I have programmed this strategy. I tried to combine logic of Moving Averages, Parabolic Stop And Reverse, Trend Strength, Oversold, Overbought . Furthermore, I have also care about Support Resistance that Trader can easily get in touch with market by selecting one indicator only. What is in for Trader?
Trading Modes: This selection is for activate whole strategy "Power A
FREE

Этот индикатор нарисует вам следующие уровни:
Дневная открытая линия: внизу – медвежий рынок, вверху – бычий. Средний дневной диапазон: максимум и минимум Азиатский рынок: взлеты и падения Вчерашний максимум и минимум Эти уровни являются сильными уровнями поддержки и сопротивления, на которые каждый должен обратить внимание.
Если вы не использовали время, чтобы начать! Вам нужно обратить внимание, когда цена приближается к этим уровням!
Наслаждайтесь торговлей, которая стала проще!
FREE

Или (BD%), который представляет собой индекс волатильности, который измеряет волатильность в процентах, а не в пунктах. Идея BD% состоит в том, чтобы создать индекс, зависящий от классического стандартного отклонения (CSD), который колеблется от 0 до 100 процентов.
Вы можете использовать BD% для сравнения волатильности одной и той же ценной бумаги в разные периоды времени или в разных временных рамках. Кроме того, вы можете использовать BD% для сравнения волатильности между разными ценными бума

Introducing Volume Orderflow Profile , a versatile tool designed to help traders visualize and understand the dynamics of buying and selling pressure within a specified lookback period. Perfect for those looking to gain deeper insights into volume-based market behavior! MT5 Version - https://www.mql5.com/en/market/product/122657 The indicator gathers data on high and low prices, along with buy and sell volumes, over a user-defined period. It calculates the maximum and minimum prices during this

Calculation of Lot Size for many traders is a big challenge.
A case that is very important in money management. What many traders ignore.
Choosing an appropriate Lot Size in trades can improve results and it will ultimately lead to success.
This indicator calculates the authorized Lot Size for your trades.
The indicator uses the following values to get the appropriate Lot Size for positioning:
The distance of Stop Loss.
The Pip Value.
The amount of Risk Allowed For Each Trade.
The amoun
FREE

The VWAP Level indicator is a technical analysis tool that calculates the weighted average price for the traded volumes of a specific asset. The VWAP provides traders and investors with the average price of an asset over a specific time frame.
It is commonly used by investors to compare data on "passive" trading operations, such as pension funds and mutual funds, but also by traders who want to check if an asset has been bought or sold at a good market price.
To calculate the VWAP level we us
FREE
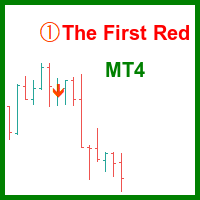
Индикатор "The First Red", основанный на стратегии, созданной Дарьюшем Дарго, предназначен для идентификации и пометки свечей на графике, которые соответствуют условиям стратегии "The First Red" и её расширений, таких как "Second Red", "First Green" и "Second Green". Стратегия сосредоточена на анализе локальных экстремумов и сигналов осциллятора MACD. Первая красная свеча: Свеча отмечается как "First Red", если она достигает локального максимума, а гистограмма MACD меняет направление на нисходящ
SMC OrderBlock Auto MT4 — это продвинутый торговый индикатор, основанный на концепции Smart Money Concepts (SMC), специально разработанный для платформы MetaTrader 4. Этот индикатор помогает трейдерам точно определять точки входа и выхода крупных институциональных участников, распознавая ключевые паттерны ценового движения, такие как Ордерные Блоки (Order Blocks), максимумы и минимумы (ликвидность стопов: BSL, SSL) на различных таймфреймах, что значительно повышает вероятность успеха и потенциал

Apollo Pips - это высокоточный индикатор разворота тренда для торговли на любой валютной паре. Изначально разрабатывался для торговли XAUUSD, но практика показала, что индикатор можно успешно использовать и на других парах. Рекомендуемый тайм фрейм H1. Индикатор делает оповещение только, когда сигнал подтвержден. Поэтому, если вы увидели оповещение, то можете смело пользоваться полученным сигналом. Индикатор НЕ ПЕРЕРИСОВЫВАЕТ свои сигналы! Стрелка может моргать пока сигнал не подтвержден. Когда

Прежде всего стоит подчеркнуть, что эта торговая система является индикатором без перерисовки, без перекрашивания и без задержек, что делает ее идеальной для профессиональной торговли.
Онлайн-курс, руководство пользователя и демонстрация. Торговая система "Умная система торговли на уровнях поддержки и сопротивления" является продвинутым индикатором, созданным для новичков и опытных трейдеров. Он дает трейдерам точность и уверенность на рынке Форекс. Эта всесторонняя система объединяет 7+ стра
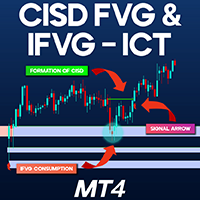
CISD FVG and IFVG ICT Indicator MT4 The CISD – CSD + FVG – IFVG indicator is an advanced ICT-based tool designed to identify CISD levels using Fair Value Gap (FVG) and Inverse Fair Value Gap (IFVG) .
Built for MetaTrader 4 , this liquidity indicator dynamically maps CISD zones with directional arrow signals. These Change in Delivery Price (CISD) levels help traders understand market shifts and trend developments in real time. CISD – CSD + FVG – IFVG Indicator Specifications Below is a summary
FREE

Enjoy a 50% OFF Christmas holiday sale!
Please contact me after purchase to immediately get your PDF strategy + documentation for Trend Pulse ! Introducing Trend Pulse , a unique and robust indicator capable of detecting bullish, bearish, and even ranging trends! Trend Pulse uses a special algorithm to filter out market noise with real precision. If the current symbol is moving sideways, Trend Pulse will send you a ranging signal, letting you know that it's not a good time to enter a tra

We have combined all of our beloved indicators the likes of: Key level order block , Key level supply and demand , Key level liquidity grab and Key level wedge into one single indicator and dashboard.
Whats new Dashboard : There is an easy access dashboard for all your needs. Multi-timeframe button : There is now a multi-timeframe option for Order Blocks and Supply and demand zones, making it easy to see higher timeframe zones easily on the current timeframe by just clicking the desired timefra

После приобретения инструмента напишите мне в личном сообщении,скину инструкцию для качественного отображения диапозонов,и работы индикатора! Graf Mason - инструмент который зделает из вас профессионального аналитика! Метод определения волновых движений при помощи наклонных каналов,качественно передаёт схематику движения любого инструмента,показывая не только возможные развороты на рынке,но и цели дальнейших движений!Разрушает миф о том что рынок живой ,чётко показывая схематику движениями от од

The indicator can be used with any time frame and forex pair. One easy to use parameter in the indicator will allow you to adapt the signals to any forex pair and time frame you want to trade.
The Arrows DO NOT REPAINT !
Information Panel: We've equipped this indicator with a user-friendly Panel. one side of the panel, the time frame is displayed, while on the other side, the currency pair is shown. Below that, the direction of the trend is identified, showing whether it is an uptrend or a d

ZigZag WaveSize - модифицированный стандартный индикатор ZigZag с добавлением информации о длине волны в пунктах.
Особенности:
Оптимизирована логика построения онлайн: метки не перерисовываются с нуля на каждом тике, а работает параллельно основному расчёту, рисуя только последние метки тогда, когда ЗигЗаг рисует новые линии или обновляет их. Добавлены трендовые линии, чтобы выделить любое количество линий ЗигЗага по цвету и толщине, начиная с самой свежей Добавлены 2 режима цветовой отрисовк
FREE
Candlestick Patterns Finder is a great tool to analyze candlestick charts. Indicator contains an advanced search algoritm and friendly graphic interface based on modified EasyAndFastGUI library. Has the ability to recognize 24 candlestick patterns. It was designed with the idea of simple and more efficient use of the indicator. It supports decision-making by automatically identifying candlestick patterns on the chart. The indicator has the ability to run in mode with and without a graphic
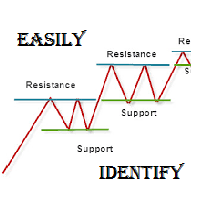
As per name Easily Identify, This Indicator is a affordable trading tool because with the help of Popular Developers & Support of M Q L Platform I have programmed this strategy. I tried to input 4 types and 3 periods of Calculation regarding Support Resistance, Furthermore, I have also care about Trend lines that Trader can easily get in touch with market in another way also. What is in for Trader?
Trading Modes: This selection is for activate whole strategy "Easily Identify" Support_R
FREE

Contact me through this email address to download the FREE strategy PDF for this indicator tharindu999lakmal@gmail.com
Download MT5 version here -- >> https://www.mql5.com/en/market/product/119467
Introduction The "VIP Buy Sell Signals MT" is designed to provide BUY and SELL trade signals based on the current market conditions. A Trading Strategy (Chee sheet) has been provided for this trading indicator. (Read the description). This indicator has time tuned e ntry signals . so

MP Squeeze Momentum is a volatility and momentum indicator derivated of "TTM Squeeze" volatility indicator introduced by John Carter. It capitalizes on the tendency for price to break out strongly after consolidating in a tight range. Introduction: The volatility component of MP Squeeze Momentum measures price compression using Bollinger Bands and Keltner Channels. If the Bollinger Bands are completely enclosed within the Keltner Channels, that indicates a period of very low volatility. This st
FREE
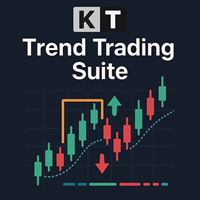
KT Trend Trading Suite — это многофункциональный индикатор, основанный на стратегии следования за трендом в сочетании с несколькими точками пробоя, выступающими в качестве сигналов входа.
После формирования нового тренда индикатор предоставляет несколько возможностей для входа, позволяя успешно следовать за движением. Для исключения малозначительных сигналов используется порог отката.
Версия для MT5 доступна здесь https://www.mql5.com/en/market/product/46270
Особенности
Объединяет нескольк

Индикатор RSI Panel MTF создан для того чтобы иметь возможность наблюдать данные стандартного индикатора RSI с множества таймфреймов и символов - на одном графике, а так же получать своевременные оповещения о торговых возможностях - звуковым сигналом или уведомлением. Индикатор может выводить как сами значения индикаторов, так и только сами сигналы индикатора (подтвержденные и ожидаемые). Реализован удобный функционал открытия окна нужного вам символа - простым кликом по ячейке таблицы сигналов

Модифицированный осциллятор MACD. Классический индикатор, соединяющий в себе трендовый индикатор с осциллятором для обнаружения точек входа. Имеет мультитаймфреймовую панель, а также 3 типа уведомлений
Преимущества:
Работает на всех инструментах и таймсериях Трендовый индикатор с осциллятором для входов Мультипериодная панель на всех таймфреймах Подключаемые стрелки при появлении сигналов Три типа уведомлений: push, email, alert
MT5 версия -> ЗДЕСЬ / Наши новости -> ЗДЕСЬ
Как работать:
FREE

Order Block Void Indicator MT4
Order Blocks represent critical price zones where institutional traders place significant buy and sell orders. These areas often serve as key support and resistance levels on price charts. The Order Block + Void indicator for MetaTrader 4 autonomously marks these order blocks on the chart. One of its notable features is displaying the percentage of the order block that has been utilized, turning the consumed section gray. This tool highlights bullish order blocks
FREE

BREAKOUT-SESSION-BOX ЛОНДОН ЕС США АЗИЯ Открытый
Ожидание волатильного движения выше или ниже диапазона открытия Мы берем максимум диапазона в качестве входа в длинную сделку, а стоп-лосс будет минимумом диапазона. и наоборот, минимум диапазона как вход для короткой сделки и максимум для SL. Размер диапазона - это расстояние до TP (Take Profit) Диапазон часов работы не должен превышать примерно 1/3 среднего дневного диапазона. 4 примера прорыва уже предопределены: Азия, Франкфурт, Лондон, США.
FREE
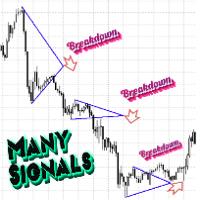
Индикатор уровней треугольник подскажет в какую сторону может двинуться цена при пробитии одной из них.
Если вы сомневаетесь в какую сторону торговать, то этот индикатор вы можете использовать как фильтр на любом инструменте и любом таймфрейме.
Индикатор разработан таким образом , чтобы помочь выявлять направление движения цены.
Стратегия построения прямоугольника работает по авторскому алгоритму нахождения определённых консолидаций.
Цена на индикатор минимальна для первых продаж.
Далее цена 99

НАКОНЕЦ! Стохастический индикатор для MT4, который показывает несколько таймфреймов на одном графике! Посмотрите фактическое положение основной и сигнальной линий в 4 отдельных таймфреймах мгновенно, чтобы помочь вам принять обоснованные торговые решения.
Настоящий стохастический индикатор MTF для трейдеров, которым нужно визуально видеть, что говорит им индикатор на нескольких таймфреймах, нет стрелок, которые просто указывают вверх или вниз, или отображаются цифры. Больше не нужно переключать
FREE

Pivot Point Fibo RSJ - это индикатор, который отслеживает линии поддержки и сопротивления дня с использованием ставок Фибоначчи.
Этот впечатляющий индикатор создает до 7 уровней поддержки и сопротивления через точку разворота с использованием ставок Фибоначчи. Замечательно, как цены уважают каждый уровень этой поддержки и сопротивления, где можно определить возможные точки входа / выхода из операции.
Функции До 7 уровней поддержки и 7 уровней сопротивления Устанавливайте цвета уровней индивид
FREE

US30 Revolt a Technical indicator that is 100% non-repaint and appears on the current candlestick works on all timeframes (recommended M15,M30,H1) The indicator is made for US30 but it can be used on other pairs as well When a blue arrow appears look for buying opportunities When a orange arrow appears look for selling opportunities Please watch the YouTube video on how to properly set up and use the indicator
FREE

Buy with a discount of 75% for the unlimited licence the FOTSI! Offer valid from 01/04/2025 to 10/04/2025! Hurry Up & Rate the indicator!
FOTSI (Forex Overview True Strength Index) for MT4 FOTSI is an indicator that analyzes the relative strength of currencies in major Forex pairs. It aims to anticipate corrections in currency pairs following strong trends by identifying potential entry signals through overbought and oversold target areas. Theoretical Logic of Construction: Calculation of Indi

Heikin Ashi is Japanese for "average bar", and may make it easier for you to identify trends. Our version of this popular indicator adjusts the size of the candles based on the zoom level of your chart, making it appear more naturally just like the traditional candlesticks. The colors are selected based on the color scheme you use on your charts, but can be customized anyway you would like. You may also choose whether to display only the Heikin Ashi candles, or show the other selected chart as w
FREE

This strategy allowed me to leave my IT job 5 years back. This strategy is the one that showed me profits in forex. I used it for 4 years. I had never spend a single week where i was not profitable. As profits allowed me to be part of some hidden traders communities, i found out strategies that are more accurate and have some great profit enhancing techniques. so i guess this is the time where i will share my strategy that i used for 4 years that i had coded a long time ago and to this day stil

Индикатор отображает максимальный горизонтальный объем на выбранном таймфрейме. Основан на индикаторе UPD1 Volume Box . Линии могут быть соединены или разделены. В настройках вы можете включить умное оповещение на касание. Такой индикатор будет полезен тем, кто торгует пользуясь профилем рынка и концепцией Smart Money.
Входные параметры.
Основные настройки. Bars Count - указывает количество баров, на которых будет нарисован TF POC. Data Source - таймфрейм, с которого будут использоваться тики
FREE

Trend arrow Indicator is an arrow Indicator used as an assistant tool for your trading strategy. The indicator analyzes the standard deviation of bar close for a given period and generates a buy or sell signals if the deviation increases. It good to combo with Martingale EA to follow Trend and Sellect Buy Only/Sell Only for EA work Semi-Automatic.
You can use this Indicator with any EAs in my Products.
FREE
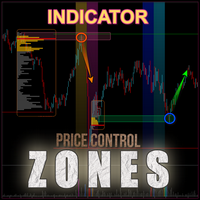
Индикатор Bull and Bear Zones специально разработан для автоматического определения и визуального отображения зон поддержки и сопротивления прямо на графике. Его уникальный алгоритм позволяет отображать не только те зоны, которые рынок уже тестировал, но и выявлять потенциальные целевые зоны,которые еще не были протестированные рынком.Индикатор отслеживает диапазоны, где наблюдается нарушение баланса между спросом и предложением. Основные особенности: Автоматическое определение зон поддержки и
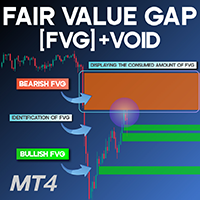
Fair Value Gap Void MT4
The Fair Value Gap and Void (FVG + Void) indicator is a powerful tool designed for ICT and Smart Money traders who aim to detect and analyze price gaps and fair value gaps (FVGs) on the MetaTrader 4 (MT4) platform. This indicator effectively pinpoints bullish imbalances, marking them with green rectangles, while bearish imbalances are displayed using brown rectangles. As price revisits these areas and begins filling the existing orders, the indicator dynamically updates
FREE

Powerful non-repainting tool for intraday or swing tading, part of the Power Lines Trading System, used in real trading on a daily basis with proven solid trading signals. The Power Lines indicator is pretty straightforward and easy to set up and can be used perfectly on every timeframe and with every currency pair or other financial instrument. For intraday trading the using of M5, M15 or M30 timeframes and for swing trading H1, H4 or D are recommended. Avoid M1 and be careful with M5 timeframe
FREE

Smart Level Pro — очень мощный индикатор, основанный на концепции блоков ордеров и настроенных входов с правильными fvg и прорывами, чтобы создать очень хороший уровень для входа, как профессиональный трейдер. Очень простой в использовании интерфейс и удобный для входа по сигналам покупки и продажи. Бонус: При покупке индикатора, Quantum Entry PRO предоставляется бесплатно. Индикатор не перерисовывается и не изменяет свои данные! Лучше всего работает на таймфрейме M5-M15 для золота, биткоина
MetaTrader Маркет - единственный магазин, где можно скачать демоверсию торгового робота и подвергнуть его проверке и даже оптимизации на исторических данных.
Прочитайте описание и отзывы других покупателей на заинтересовавший вас продукт, скачайте его прямо в терминал и узнайте, как протестировать торгового робота перед покупкой. Только у нас вы можете получить представление о программе, не заплатив за неё.
Вы упускаете торговые возможности:
- Бесплатные приложения для трейдинга
- 8 000+ сигналов для копирования
- Экономические новости для анализа финансовых рынков
Регистрация
Вход
Если у вас нет учетной записи, зарегистрируйтесь
Для авторизации и пользования сайтом MQL5.com необходимо разрешить использование файлов Сookie.
Пожалуйста, включите в вашем браузере данную настройку, иначе вы не сможете авторизоваться.