MetaTrader 4용 기술 지표 - 9
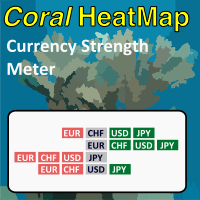
Coral Heatmap is a currency strength meter based on the ATR values for the selected timeframe. There are two main view modes: All Currencies (default) - see the ranked strength of all currencies in a single view Selected Currency - see the relative strength of all other currencies compared to a selected currency You can optionally display the timeframe selection toolbar; timeframe is always synchronized to the current chart timeframe. Use keyboard shortcuts to quickly navigate currencies (up/d

------ GOOD LUCK -----
(Telegram: @MagicBinary) The indicator allows you to trade binary options. T his indicator give high winning ratio with over 20 years of backtesting The recommended time frame is М1 and the expiration time is 3, 5 minutes. The indicator suitable for Auto and Manual trading. A possible signal is specified as a arrows above/under a candle. You can entry current candle /intrabar or can wait until candle close Arrows are not re-painted Trade sessions: Any/ Rec

Welcome to the world of SMC (Smart Money Concepts) Trading, where we empower traders with the tools and knowledge to make smarter trading decisions. Our latest addition to our suite of trading tools is the SMC Trading Pro indicator, version 1.0. Key Features: Major Market Structure Identification with BODY break. Order Block must be in Major Swing ( not Small Swing ). Order Block with Fair Value Gap Detection. Order Block in Discount | Premium zone. Filter for only Bullish, Bearish or All Order
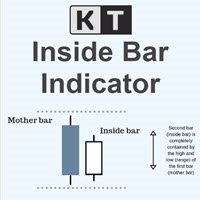
KT Inside Bar plots the famous inside bar pattern in which the bar carries a lower high and higher low compared to the previous bar. The last bar is also known as the mother bar. On smaller time-frames, the inside bar sometimes appears similar to a triangle pattern.
Features
Also plots entry, stop-loss, and take-profit levels with the inside bar pattern. No complex inputs and settings. Erase unwanted levels when the price reaches the entry line in either direction. All Metatrader alerts include

The indicator automatically sets trendlines on the really important points directly on the chart. Timeframe, color and style of the lines can be adjusted. Notification of a breakout above or below the line via a smartphone is possible.
Input Parameters TimeFrame : Choose timeframe AppliedPrice : Choose close , open, high, low, median, typical or weighted price Formation : Choose swing, Shoulder head shoulder or long term formation Alerts : true = alert is on SendEmail : Send message to email ad
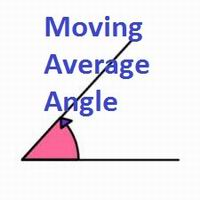
This indicator shows you the angle of the moving average according to your settings in a separate window. It also shows the angle written on the chart, which can also be adjusted. The main features and input variables provided include: MAPeriod: This is the period for your moving average. The default MAPeriod is 5. LookBack: This is a very important variable. It allows you to set the look back bar, from which the angle will be measured. For example, if your LookBack is 5, then indicator will cal
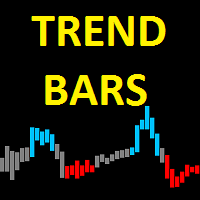
Trend Bars indicator is a trend indicator working with a set of algorithms and a set of indicators. Trend finds trends by using many factors while you are there. This indicator has 4 mode features. Mode 1 represents short-term trends. Mode 2 represents medium to short term trends. Mode 3 represents medium to long term trends. Mode 4 represents long term trends. Easy to use and simple indicator. The user can easily understand the trends. This indicator has 3 trend features. Up trend, down trend a
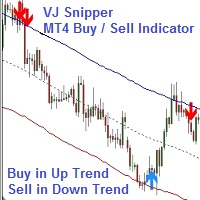
VJ Sniper - MT4 Buy / Sell Indicator: This Indicator is as simple as Buy in Up Trend & Sell in Down Trend. There are 2 Support / Resistance lines for choosing the best Entries. Background: Any in-built indicator of MT4 does not work as stand alone such as Stochastic, CCI or DeMarker etc. But combination of them with trend projection work & give the best results for Trading entries. So this Indicator is blended to give the best results whi
Divergence Divergence refers to when the price of a currency pair moves in one direction while the trend indicator is moving in the opposite direction. With divergence, there can be positive and negative signals. Divergences in Forex trading are quite common signals of technical analysis. These are basic early Forex signals indicating the trend reversal and filter false signals. Application of this indicator It is usually not easy to detect divergences by the trader and it may be time-consuming

Smooth Heikin Ashi provides a more smoothed signal of bull or bearish trends than regular Japanese candlesticks, or even the standard Heikin Ashi candles. Heikin Ashi as an alternative candlestick pattern that has been in use since its invention in Japan back in the 1700s. On normal Japanese candlesticks, there is a lot noise with mixed bearish and bullish candles side by side, even during trends. Heikin Ashi reduces this noise leaving an easier visual representation of trends. This indicator is

- Real price is 60$ - 50% Discount ( It is 30$ now )
Contact me for instruction, any questions! Introduction Triangle chart patterns are used in technical analysis , which is a trading strategy that involves charts and patterns that help traders identify trends in the market to make predictions about future performance.
Triangle Pattern Scanner Indicator It is usually difficult for a trader to recognize classic patterns on a chart, as well as searching for dozens of charts and time f

Multi-timeframe Parabolic SAR dashboard allows you to add and monitor PSAR trends. The multi-timeframe Parabolic SAR dashboard will save you a lot of time and gives you a single view of the markets using PSAR. In short, you can just view one window and get a snapshot of up to 21 instruments on your MT4 platform. The indicator opens in a sub-window. Below are the features of the PSAR Dashboard Indicator Modify PSAR Settings: The PSAR Dashboard comes with default PSAR settings of 0.02 (Step) and 0

The indicator trades during horizontal channel breakthroughs. It searches for prices exceeding extreme points and defines targets using Fibo levels. The indicator allows you to create a horizontal channel between the necessary extreme points in visual mode quickly and easily. It automatically applies Fibo levels to these extreme points (if the appropriate option is enabled in the settings). Besides, when one of the extreme points and/or Fibo levels (50%) is exceeded, the indicator activates a so

** All Symbols x All Timeframes scan just by pressing scanner button ** - Discount : it is not 49$, it is just 30$. *** Contact me to send you instruction and add you in "Trend Reversal group" for sharing or seeing experiences with other users. Introduction: Trendlines are the most famous technical analysis in trading . Trend lines continually form on the charts of markets across all the different timeframes providing huge opportunities for traders to jump in and profit on the action.

The Volume Spike indicator is a useful tool to identify the directional market's intention.
How Does It Work: The Volume Spike indicator identifies the volume peaks and creates a sensitive rectangle equipped with Alert and Warning Pop Up that it suggests the market's direction. This tool has the ability to select the time frame on which to do the analysis of volume and it gives a great visual signal colored into rectangle. The indicator can identify valid market signals but it can also suggest
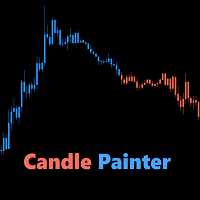
Candle Painter is a 13 in 1 indicator that paints indicators such as all the oscillators, right on top of your chart candles. You can choose from a long list of indicators and follow the trend of the colored candles, or get warned by the overbought/oversold color on the candles. Uptrend and downtrend levels can be set for the oscillators. Oscillators with main and signal lines, such as MACD, Stochastic and RVI, also have the option to follow trend by crossings. Overbought and oversold levels can
AW 슈퍼 트렌드 - 이것은 가장 인기 있는 클래식 트렌드 지표 중 하나입니다. 그것은 간단한 설정을 가지고 있으며 추세로 작업할 수 있을 뿐만 아니라 이 표시기로 계산되는 손절매 수준도 표시합니다. 이익:
악기: 통화 쌍 , 주식, 상품, 지수, 암호 화폐. 기간: М15 이상. 거래 시간: 24시간 내내. 현재 추세의 방향을 보여줍니다. 손절매를 계산합니다. 거래를 할 때 사용할 수 있습니다. 세 가지 유형의 알림: 푸시, 이메일, 경고. MT5 버전 -> 여기 / 뉴스 -> 여기 기능:
- 표시기는 해당 색상으로 현재 추세 방향을 표시합니다.
- 파란색은 현재 기간에 사용된 기호의 상승 추세를 나타냅니다.
- 선의 빨간색은 선택한 기호에서 사용된 기간의 하락 추세를 나타냅니다.
표시기를 사용하여 StopLoss를 설정할 수 있습니다.
표시선은 막대 위에 표시되지 않고 막대를 기준으로 약간 이동하여 표시됩니다. 추세선이 표시되는 이 곳은 트
FREE
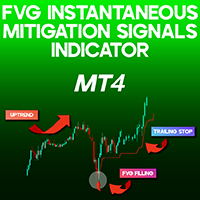
FVG Rapid Mitigation Signals Indicator MT4 The FVG Rapid Mitigation Signals indicator is designed to detect fair value gaps (FVGs) that are swiftly filled, marking them with arrows for easy identification.
Once these gaps are recognized, the indicator on MetaTrader 4 automatically generates a Trailing Stop , aligning with the trend direction for optimal trade management. FVG Rapid Mitigation Signals Indicator Specifications The following table presents the essential specifications of the FVG R
FREE
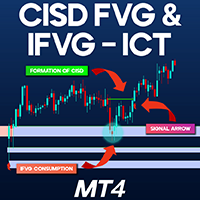
CISD FVG and IFVG ICT Indicator MT4 The CISD – CSD + FVG – IFVG indicator is an advanced ICT-based tool designed to identify CISD levels using Fair Value Gap (FVG) and Inverse Fair Value Gap (IFVG) .
Built for MetaTrader 4 , this liquidity indicator dynamically maps CISD zones with directional arrow signals. These Change in Delivery Price (CISD) levels help traders understand market shifts and trend developments in real time. CISD – CSD + FVG – IFVG Indicator Specifications Below is a summary
FREE

차트를 구조화하고 주기적인 가격 변동을 식별하는 기술 지표입니다.
모든 차트에서 작업할 수 있습니다.
다양한 유형의 알림.
그래프 자체에도 추가 화살표가 있습니다.
역사를 재구성하지 않고, 촛불을 닫는 작업에 임한다.
M5 이상에서 권장되는 TF입니다.
사용 및 구성이 쉬운 매개변수입니다.
매개변수가 다른 2개의 지표를 사용하는 경우, 다른 지표 없이 해당 지표만 사용할 수 있습니다.
2개의 입력 매개변수가 있습니다
주기성과 신호 지속 시간
이 2개의 매개변수는 차트 구조의 처리와 관련이 있습니다.
Cyclicity - 역전 주기가 얼마나 자주 바뀌는지 조절하고 주기를 매끄럽게 합니다. Signal duration - 최소 숫자에서는 가격 움직임의 충격을 감지하고, 최대 숫자에서는 장기적 추세 움직임을 감지합니다.. --------------------------------

Currency Correlation Plus is an expensive version of the indicator. It is equipped with the signal and is more equipped than its cheaper brother. The indicator helps us understand and see a correlation. Second chart makes it easy to analyze and trade multiple currencies. On the chart, you can post multiple pairs. Type in the selected currency pair in the settings and add it to the chart.
Inputs One indicator on chart=True / two or more=False Alert Signal buy and sell for first chart and second

피봇 포인트 Fibo RSJ는 피보나치 비율을 사용하여 당일의 지지선과 저항선을 추적하는 지표입니다.
이 멋진 지표는 피보나치 비율을 사용하여 피벗 포인트를 통해 최대 7단계의 지지와 저항을 생성합니다. 가격이 작업의 가능한 진입/종료 지점을 인식할 수 있는 이 지원 및 저항의 각 수준을 어떻게 존중하는지 환상적입니다.
특징 최대 7단계 지원 및 7단계 저항 레벨의 색상을 개별적으로 설정
입력 피벗 유형 피벗 피보 RSJ1 = 피보 비율 1 계산 피벗 피보 RSJ2 = 피보 비율 2 계산 피벗 Fibo RSJ3 = Fibo 비율 3 계산 피벗 피보 클래식 = 클래식 피벗 계산 최소 피벗 수준 피벗 3 레벨 피벗 4 레벨 피벗 5 레벨 6단계 피벗 피벗 7 레벨
여전히 질문이 있는 경우 다이렉트 메시지로 저에게 연락하십시오: https://www.mql5.com/ko/users/robsjunqueira/
FREE
This is a Multi pair and Multi time frame dashboard. The founder of the system is Mr. Oma Ally, which is a system based from Bollinger Band and Moving Average(BBMA). BBMA consists of the use of 2 indicators: Moving Averages Bollinger Bands BBMA consists of 3 types of entries: Extreme MHV Re-Entry Rejection EMA50 This Dashboard Help you to scan current Extreme, Reentry setup, Rejection EMA50 and also MHV How to read signals:
find the same color in 3 different timeframes in succession
For exampl
FREE
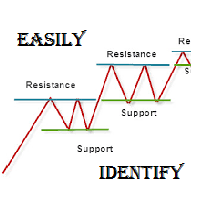
As per name Easily Identify, This Indicator is a affordable trading tool because with the help of Popular Developers & Support of M Q L Platform I have programmed this strategy. I tried to input 4 types and 3 periods of Calculation regarding Support Resistance, Furthermore, I have also care about Trend lines that Trader can easily get in touch with market in another way also. What is in for Trader?
Trading Modes: This selection is for activate whole strategy "Easily Identify" Support_R
FREE

** All Symbols x All Timeframes scan just by pressing scanner button ** - Discount : it is not 40$, it is just 30$. *** Contact me to send you instruction and add you in "M W Scanner group" for sharing or seeing experiences with other users. Introduction: Double Top(M) and Double Bottom(W) is a very repetitive common type of price reversal patterns. Double Top resembles M pattern and indicates bearish reversal whereas Double Bottom resembles W pattern and indicates a bullish reversal

GoldTrend MT4 - is a leading indicator for Gold on MetaTrader 4
- In Update version has been added new ability on USD pairs
( AUDUSD, EURUSD, GBPUSD, NZDUSD, USDCAD, USDCHF, USDJPY )
- very easy to use , even for beginners
- Stoploss and Take Profit provided - no repaint, no redraw and no lagging
When you decide to enter the global market , then there is a technical skill you absolutely must have, - which is all about trends .
Why - GoldTrend is different from others :
Not only uptre

전일 종가 및 바 이동을 위한 MetaTrader 인디케이터! 전일 종가 및 바 이동 인디케이터는 기술적 분석과 거래 결정을 향상시키기 위해 개발된 도구입니다. 이 인디케이터를 사용하면 어떤 바의 개방가, 고가, 저가, 종가에 대한 상세한 정보를 얻어 시장 움직임에 대한 정확하고 포괄적인 분석이 가능합니다. 현재 타임프레임 내에서 다른 타임프레임을 적용할 수 있는 기능을 상상해보세요. 전일 종가 및 바 이동 인디케이터를 사용하면 이 놀라운 기능을 손쉽게 사용할 수 있습니다! 전일 종가가 서포트와 저항으로서의 중요성은 거래자 커뮤니티에서 널리 인정되고 있습니다. 이제 이 도구를 사용하여 이전 종가에서 가격이 멈춘 수준을 명확하고 정확하게 파악하여 매수 및 매도 결정에 유용한 정보를 얻을 수 있습니다. 인디케이터를 차트에 적용하면 시각적으로 매력적으로 강조된 전일 개방가, 고가, 저가, 종가의 중요한 정보에 즉시 액세스할 수 있습니다. 또한 바 이동을 조정하여 MetaTrader의 어떤
FREE

Calculation of Lot Size for many traders is a big challenge.
A case that is very important in money management. What many traders ignore.
Choosing an appropriate Lot Size in trades can improve results and it will ultimately lead to success.
This indicator calculates the authorized Lot Size for your trades.
The indicator uses the following values to get the appropriate Lot Size for positioning:
The distance of Stop Loss.
The Pip Value.
The amount of Risk Allowed For Each Trade.
The amoun
FREE
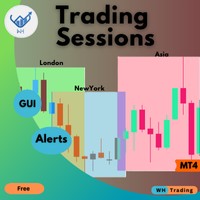
거래 정확도를 높여보세요 WH 트레이딩 세션 MT4 MetaTrader 4를 위한 지표! 이 강력한 도구는 주요 시장 세션을 손쉽게 시각화하고 관리하는 데 도움이 됩니다. 기반 : WH SMC Indicator MT4
MT5 버전 : WH 트레이딩 세션 MT5 주요 특징: 대화형 GUI 패널 – 쉽게 선택하고 전환하세요 아시아, 런던, 뉴욕 거래 세션.
사용자 정의 가능한 알림 및 설정 – 직관적인 인터페이스를 통해 전략에 맞게 지표를 조정하세요. 옵션 탭 .
빠르고 반응성이 좋은 인터페이스 – 매끄러운 경험을 즐겨보세요 이동 가능하고 최소화 가능하며 최대화 가능한 패널입니다 .
자동 GMT 오프셋 처리 – 수동 조정이 필요 없습니다. 세션은 항상 시장 시간에 맞춰 조정됩니다.
Trading Session을 통해 시장 활동을 앞서가고 거래
FREE
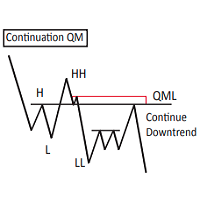
This Custom Mapping Tool is an innovative MT4 indicator that simplifies the process of marking and mapping charts. With this tool, you no longer have to waste time rewriting repetitive words, rectangles, and trendline colors every time. New Feature V5.60:
Draw path - Same as the TV Path drawing mode, which is very useful for naked chart trader. You can draw zigzag, draw your patterns manually. Change style in indicator setting. Crop function disabled by default. Can be enabled and show button c
FREE

StalkeR Arrow는 바 오픈/인트라 바에서 매수 및 매도 신호를 제공하는 화살표 표시기입니다. 이 표시기는 가격 행동 패턴 및 프랙탈을 기반으로 합니다.
이 지표는 각 매수 및 매도 신호에 대해 tp와 sl을 제공하며, tp와 sl은 각 신호 위와 아래에 선 형태로 표시되며 새로운 신호가 형성될 때까지 연장됩니다.
이 표시기에는 기록 신호의 승/패 통계를 제공하는 백테스팅 패널/대시보드가 있으며, 이 표시기는 다시 칠하거나 다시 칠하지 않습니다.
매개변수:
StalkeR 기간: 화살표 기간, 숫자가 높을수록 더 적은 수의 신호가 제공됩니다.
스프레드: 포인트 단위의 스프레드 값을 사용하여 패널에서 승패를 계산합니다.
정지손실 ATR x : atr 곱셈의 SL 값
Takeprofit ATR x : atr 곱셈의 TP 값
ATR 기간 : tp 및 sl을 기반으로 계산하는 데 사용되는 atr 기간
TP/SL 라인 색상 및 너비
화살표 색상 및 너비
패널

Introducing Volume Orderflow Profile , a versatile tool designed to help traders visualize and understand the dynamics of buying and selling pressure within a specified lookback period. Perfect for those looking to gain deeper insights into volume-based market behavior! MT5 Version - https://www.mql5.com/en/market/product/122657 The indicator gathers data on high and low prices, along with buy and sell volumes, over a user-defined period. It calculates the maximum and minimum prices during this

물론입니다. 아래는 제공해주신 텍스트의 한국어 번역입니다: MT4용 천문학 지표 소개: 귀하의 최상급 하늘 트레이딩 동반자 트레이딩 경험을 천체의 높이로 끌어올리기 준비가 되셨나요? MT4용 천문학 지표를 소개합니다. 이 혁신적인 도구는 복잡한 알고리즘의 힘을 활용하여 탁월한 천문학적 통찰과 정밀한 계산을 제공합니다. 정보의 우주를 손에 담다: 천문학적 데이터의 보물함을 드러내는 포괄적인 패널을 살펴보세요. 행성의 지오/헬리오센트릭 좌표, 태양/지구 거리, 크기, 길이, 별자리, 황도 좌표 및 적도 좌표, 심지어 수평 좌표 등 각각이 정밀하게 계산되고 아름답게 제시됩니다. 지표에 의해 생성된 수직선은 시간 값에 해당하여 트레이딩 여정에 우주적인 시각을 부여합니다. 행성 라인과 관계: 수정 가능한 스케일과 각도로 차트를 장식하는 행성 라인의 마법을 경험해보세요. 직관적인 컨트롤 패널을 통해 각 행성의 라인의 가시성을 손쉽게 전환할 수 있습니다. 쥰션이나 섹스타일, 사분각, 삼분각, 트

harmonic patterns Harmonic patterns can be used to spot new trading opportunities and pricing trends – but only if you know exactly what you are looking for. Harmonic patterns are formed by combining geometric shapes and Fibonacci levels. As a result, Fibonacci levels are the key concept of these patterns. Identifying harmonic patterns requires more practice than other market classical patterns. But by learning these patterns, you can recognize the future trend of the price chart. These patter

TradingView에서 Inside Bar를 사용하여 Inside Bars를 쉽게 찾고 편안하게 느끼지만 MQL 시장에서 찾을 수 없다면, 당신의 검색이 여기서 끝납니다. InsideBar Highlight의 특징: ABC만큼 간단: Inside Bars 간단히 만들기. 저희 도구는 어려움 없이 중요한 내용이 보이도록 캔들 본체에 중점을 둡니다. 당신의 스타일, 당신의 선택: 다양한 색상이 좋습니까 아니면 전부 동일한 색이 좋습니까? 당신이 결정합니다. 상승 또는 하락 움직임을 쉽게 확인하세요. 맞춤화가 완벽하게 맞아 떨어집니다: 우리의 강조는 보기 좋을 뿐만 아니라 각 캔들에 완벽하게 맞아 떨어져 차트를 깔끔하고 읽기 쉽게 만듭니다. 도움의 손길: 도구 사용에 어려움이 있거나 질문이 있다면 언제든지 문의하세요. 당신의 메시지는 환영받을 뿐만 아니라 우리는 필요한 모든 것을 도울 준비가 되어 있습니다. InsideBar Highlight 4는 단순한 도구가 아니라 질문과 경험이 중
FREE
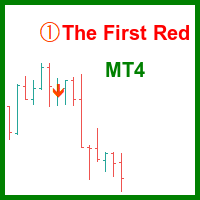
"The First Red" 지표는 Dariusz Dargo가 만든 전략을 기반으로 하며, "The First Red" 전략과 "Second Red," "First Green," "Second Green"과 같은 확장 조건을 충족하는 캔들을 차트에서 식별하고 표시하도록 설계되었습니다. 이 전략은 지역적 극한값과 MACD 오실레이터의 신호를 분석하는 데 중점을 둡니다. 첫 번째 빨간 캔들 (First Red Candle): 캔들이 지역적 최고점을 형성하고 MACD 히스토그램이 하락 방향으로 전환될 때 "First Red"로 표시됩니다. 차트 기호: 캔들 위의 빨간색 아래 화살표. 두 번째 빨간 캔들 (Second Red Candle): "First Red" 이후의 두 번째 하락 캔들로, 방향 전환을 확인합니다. 차트 기호: 캔들 위의 빨간 숫자 "2". 첫 번째 녹색 캔들 (First Green Candle): 캔들이 지역적 최저점을 형성하고 MACD 히스토그램이 상승 방향
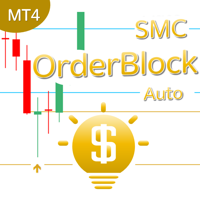
SMC OrderBlock Auto MT4는 Smart Money Concepts (SMC)를 기반으로 한 고급형 거래 지표로, MetaTrader 4 플랫폼을 위해 특별히 설계되었습니다. 이 지표는 대규모 기관 투자자들의 매수 및 매도 진입/청산 지점을 정확하게 식별하도록 도우며, 여러 시간대에서 오더 블록(Order Blocks), 고점/저점(스탑 유동성: BSL, SSL)과 같은 주요 가격 움직임 패턴을 인식하여 거래 성공률과 수익 가능성을 높여줍니다. 주요 기능 오더 블록 자동 표시
오더 블록은 은행, 펀드, 다국적 기업, 스마트 머니(Smart Money)와 같은 기관 투자자들이 매수 또는 매도 활동을 집중시키는 중요한 가격 구역입니다. 이 구역은 종종 시장의 전환점이나 추세 지속성을 나타냅니다. 이 지표는 강세(매수) 및 약세(매도) 오더 블록을 자동으로 감지하여 수평선으로 표시하며, 트레이더가 지지선(Support) 및 저항선(Resistance)을 쉽게 식별할 수 있

Apollo Pips 는 모든 통화 쌍을 거래하기 위한 매우 정확한 추세 반전 지표입니다. 원래 XAUUSD 거래를 위해 개발되었지만 실제로 다른 쌍에서 지표를 성공적으로 사용할 수 있음을 보여주었습니다. 권장 기간 H1. 기술적으로 지표는 모든 거래 수단과 함께 사용할 수 있습니다. 통화, 금속, 석유, 원자재, 주식, 지수를 거래할 수 있습니다. 표시기는 신호가 확인된 경우에만 경고합니다. 따라서 경고를 본 경우 수신된 신호를 안전하게 사용할 수 있습니다. 표시기는 신호를 다시 그리지 않습니다! 신호가 확인될 때까지 화살표가 깜박일 수 있습니다. 신호가 확인되면 화살표의 위치가 더 이상 변경되지 않습니다! 구매 후 반드시 저에게 편지를 보내주세요! 지표 사용에 대한 권장 사항을 알려 드리겠습니다. 당신을 기다리고있는 큰 보너스도 있습니다!

우선적으로 이 거래 시스템은 다시 그리지 않고, 다시 그리지 않으며, 지연되지 않는 것을 강조할 가치가 있습니다. 이는 전문적인 거래에 이상적입니다. 온라인 강좌, 사용자 매뉴얼 및 데모. "스마트 서포트 앤 레지스턴스 트레이딩 시스템"은 새로운 및 경험 많은 트레이더를 위해 개발된 고급 지표입니다. 이 시스템은 외환 시장에서 정밀도와 신뢰감을 제공합니다. 이 포괄적인 시스템은 일일 거래 전략, 스윙 거래 전략, 지원 및 저항 전략, 캔들스틱 패턴 전략, VWAP 전략, 다중 시간대 추세 전략 등을 포함한 7개 이상의 전략, 10개의 지표 및 다양한 거래 방식을 결합합니다. 이 시스템은 화살표 신호, 진입 및 출구 지점, 거래 경보, 높은 시간대 추세 분석, 실시간 거래 모니터링 및 트렌드 및 볼륨 캔들 색상 제공합니다. 자동 지원 및 저항 감지로 다양한 시장 상황에서 신중한 결정을 돕는 다면적 인 지표입니다.
스마트 서포트 앤 레지스턴스 트레이딩 시스템은 프리미엄 및 강력한 지

US30 Revolt a Technical indicator that is 100% non-repaint and appears on the current candlestick works on all timeframes (recommended M15,M30,H1) The indicator is made for US30 but it can be used on other pairs as well When a blue arrow appears look for buying opportunities When a orange arrow appears look for selling opportunities Please watch the YouTube video on how to properly set up and use the indicator
FREE

ZigZag WaveSize - 파장에 대한 정보를 포인트로 추가한 수정된 표준 ZigZag 지표입니다.
특징: 최적화된 온라인 구성 로직: 레이블은 각 틱에서 처음부터 다시 그려지지 않고, 주 계산과 병렬로 작동하며, ZigZag가 새로운 선을 그리거나 업데이트할 때 마지막 레이블만 그립니다. 가장 최근의 것부터 시작하여 색상과 두께에 따라 모든 지그재그 선을 강조 표시하는 추세선이 추가되었습니다. 2가지 색상 렌더링 모드가 추가되었습니다: 1) 표준(상단선 - 한 가지 색상, 하단선 - 다른 색상); 2) 구조적(동시에 상승 또는 하락 극단을 갖는 고전적 추세 - 단일 색상) 알림 모드 2개가 추가되었습니다: 1) 새로운 지그재그 선이 나타납니다. 2) 현재 지그재그 라인에 의한 마지막 극단의 돌파 평균 라인 크기와 중간값에 대한 값을 추가했습니다. 둘 다 선택 사항이며, 계산 및 렌더링을 비활성화할 수 있습니다. 두 표시 모두 그래프를 따라 편리한 위치로 이동할 수 있습니다
FREE

Powerful non-repainting tool for intraday or swing tading, part of the Power Lines Trading System, used in real trading on a daily basis with proven solid trading signals. The Power Lines indicator is pretty straightforward and easy to set up and can be used perfectly on every timeframe and with every currency pair or other financial instrument. For intraday trading the using of M5, M15 or M30 timeframes and for swing trading H1, H4 or D are recommended. Avoid M1 and be careful with M5 timeframe
FREE
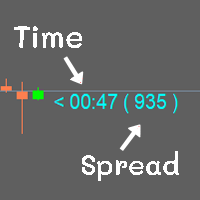
Show the time of candlesticks and spread. All data will be displayed in a rod. Can change color Can fix the size as needed
MT4 : Link https://www.mql5.com/en/market/product/102742 MT5 : Link https://www.mql5.com/en/market/product/102834
Most free code on various websites I didn't write it myself. I only do a little bit.
If you like it, please give 5 stars with it. Thank you.
FREE

We have combined all of our beloved indicators the likes of: Key level order block , Key level supply and demand , Key level liquidity grab and Key level wedge into one single indicator and dashboard.
Whats new Dashboard : There is an easy access dashboard for all your needs. Multi-timeframe button : There is now a multi-timeframe option for Order Blocks and Supply and demand zones, making it easy to see higher timeframe zones easily on the current timeframe by just clicking the desired timefra
The indicator can be used with any time frame and forex pair. One easy to use parameter in the indicator will allow you to adapt the signals to any forex pair and time frame you want to trade.
The Arrows DO NOT REPAINT !
Information Panel: We've equipped this indicator with a user-friendly Panel. one side of the panel, the time frame is displayed, while on the other side, the currency pair is shown. Below that, the direction of the trend is identified, showing whether it is an uptrend or a d

RSI divergence indicator is a multi-timeframe and multi-symbol indicator that help us find divergences between price chart and RSI indicator. Always use the divergence indicators with other technical assets like support resistance zones, candlestick patterns and price action to have a higher possibility to find trend reversals. This indicator will identify the peaks and troughs of both price and the RSI indicator. You can adjust the parameters to adjust the strength and weakness of these peaks a
FREE

The indicator displays price distribution on a horizontal histogram. Horizontal histogram help find out key levels of price so that you can make good decision on setting point of take profit, stop loss... You can improve exist trading strategy or get new trading idea with the histogram of price.
Outstanding features Support multiple time frame : you can choose to work with history data in any time frame you want. It does not depend on current display time frame.
Support weighting by volume and/
FREE
Candlestick Patterns Finder is a great tool to analyze candlestick charts. Indicator contains an advanced search algoritm and friendly graphic interface based on modified EasyAndFastGUI library. Has the ability to recognize 24 candlestick patterns. It was designed with the idea of simple and more efficient use of the indicator. It supports decision-making by automatically identifying candlestick patterns on the chart. The indicator has the ability to run in mode with and without a graphic

Contact me through this email address to download the FREE strategy PDF for this indicator tharindu999lakmal@gmail.com
Download MT5 version here -- >> https://www.mql5.com/en/market/product/119467
Introduction The "VIP Buy Sell Signals MT" is designed to provide BUY and SELL trade signals based on the current market conditions. A Trading Strategy (Chee sheet) has been provided for this trading indicator. (Read the description). This indicator has time tuned e ntry signals . so

The RSI Panel MTF indicator has been created in order to have the ability to monitor the values of the standard RSI indicator from a multitude of timeframes and symbols on a single chart, as well as to receive timely notifications about the trading opportunities using an audio signal or a notification. The indicator can output both the indicator values, and only the indicator signals (confirmed and expected). A user-friendly feature for selecting the required symbol has been implemented - simply
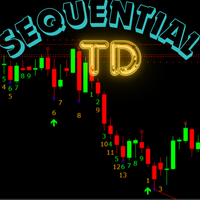
If you are unsure how to use this indicator, please feel free to reach out to me. I will explain it to you and provide reading materials to help you make the most of it. Here’s a brief description of how to use the indicator effectively. How to Use TD Sequential by Tom DeMark The TD Sequential is a technical analysis indicator developed by Tom DeMark, designed to identify potential turning points in market trends. It is widely used by traders to anticipate market reversals and manage trading ris
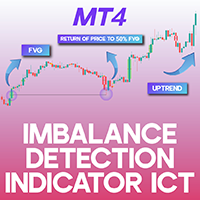
Imbalance Detection Indicator ICT MT4 The Imbalance Detection Indicator ICT MT4 for MetaTrader 4 is designed to identify key market inefficiencies, including Volume Imbalances (VI), Opening Gaps (OG), and Fair Value Gaps (FVG). This tool visually represents bullish imbalances in green and bearish imbalances in red. Market imbalances occur when supply and demand levels are out of sync, often signaling potential price targets. Indicator Specifications Table Category ICT - Liquidity - Supply and
FREE

MT5 version Overview
The Lowess Channel indicator is a smoothed trend-following tool designed to help traders identify the direction of the trend , detect flat or ranging markets , and spot breakouts from consolidation zones. It creates a central smoothed line with upper and lower channel boundaries, adapting to market noise while maintaining clarity. How It Works The indicator builds a channel around a smoothed price line. The central line reflects the current trend. The upper and lower bound
FREE
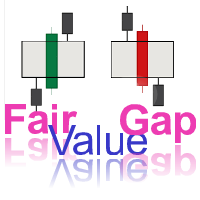
A Fair Value Gap (FVG) in Forex trading is essentially the difference between the current market price of a currency pair and what it's believed to be worth based on economic factors or reversion to the mean idea in technical analysis. Market price deviates significantly from this estimated "fair value," it can signal potential trading opportunities. Several factors can cause an FVG to appear. It often arises from market sentiment, economic news, or geopolitical events that temporarily push a cu

BeST Oscillators Collection is a Composite MT4 Indicator including the Chaikin,Chande and TRIX Oscillators which by default are contained in MT5 but not in MT4 platform. It also provides the option of displaying or not a Mov. Avg. as a Signal Line and the resulting Signals as Arrows in a Normal (all arrows) or in a Reverse Mode (without showing up any resulting successive and of same type arrows). Analytically for each one of the specific Oscillators: The Chaikin Oscillator ( CHO ) is
FREE
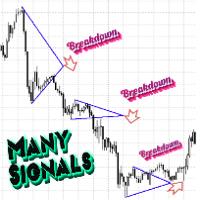
Индикатор уровней треугольник подскажет в какую сторону может двинуться цена при пробитии одной из них.
Если вы сомневаетесь в какую сторону торговать, то этот индикатор вы можете использовать как фильтр на любом инструменте и любом таймфрейме.
Индикатор разработан таким образом , чтобы помочь выявлять направление движения цены.
Стратегия построения прямоугольника работает по авторскому алгоритму нахождения определённых консолидаций.
Цена на индикатор минимальна для первых продаж.
Далее цена 99
Level Box Tool is a powerful and user-friendly custom indicator designed for traders who utilize technical analysis tools like rectangles and trend lines to identify key support, resistance, and price zones. This tool simplifies and speeds up the process of marking chart levels, offering both visual clarity and precision with its fully customizable panel, and now includes price-cross alerts — so you’ll never miss a key level again. MT5 Version - https://www.mql5.com/en/market/
FREE

Buy with a discount of 75% for the unlimited licence the FOTSI! Offer valid from 01/04/2025 to 10/04/2025! Hurry Up & Rate the indicator!
FOTSI (Forex Overview True Strength Index) for MT4 FOTSI is an indicator that analyzes the relative strength of currencies in major Forex pairs. It aims to anticipate corrections in currency pairs following strong trends by identifying potential entry signals through overbought and oversold target areas. Theoretical Logic of Construction: Calculation of Indi

Trend arrow Indicator is an arrow Indicator used as an assistant tool for your trading strategy. The indicator analyzes the standard deviation of bar close for a given period and generates a buy or sell signals if the deviation increases. It good to combo with Martingale EA to follow Trend and Sellect Buy Only/Sell Only for EA work Semi-Automatic.
You can use this Indicator with any EAs in my Products.
FREE

This strategy allowed me to leave my IT job 5 years back. This strategy is the one that showed me profits in forex. I used it for 4 years. I had never spent a single week where i was not profitable. As profits allowed me to be part of some hidden traders communities, i found out strategies that are more accurate and have some great profit enhancing techniques. so i guess this is the time where i will share my old strategy that i used for 4 years that i had coded a long time ago and to this day

Zig Zag 123 tells us when a reversal or continuation is more likely by looking at the shift in supply and demand. When this happens a signature pattern appears known as 123 (also known ABC) will often break out in direction of higher low or lower high.
Stop loss and take profit levels have been added. There is a panel that shows the overall performance of your trades for if you was to use these stop loss and take profit levels.
We get alerted if a pattern 123 appears and also if the price re
FREE

핍스 헌터 프로는 수년에 걸쳐 개발되었으며 이전 버전보다 개선된 버전입니다. 이 강력한 지표는 시장과 가격 이력을 분석하여 매수 및 매도 항목을 생성합니다. 이러한 항목의 계산을 위해 함께 작동하는 다양한 지표와 덜 유리한 항목을 필터링하고 제거하는 복잡한 통계 로그를 사용합니다 / MT5 버전 .
특징 다시 칠하지 않음
이 인디케이터는 새 데이터가 도착해도 값이 변경되지 않습니다
지연 없음 이 표시기는 지연되지 않습니다 거래 쌍
모든 외환 쌍 (가급적 EURGBP)
타임프레임
모든 차트주기
매개변수 ===== 표시 =====
화살표 거리 // 신호(화살표)와 캔들스틱 사이의 거리
===== 알림 =====
팝업 알림 // MT4 터미널용 알림
푸시 알림 알림 // 휴대폰용 알림
이메일 알림 // 이메일 알림
===== 차트 설정 =====
차트에서 캔들 스틱의 색상을 변경하는 옵션
경고 저는 MQL5.com에서만 제품을 판매합니다. 누군가 내
FREE
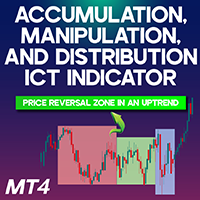
Accumulation, Manipulation, and Distribution ICT indicator MT4 The Accumulation, Manipulation, and Distribution (AMD) indicator for MetaTrader 4 serves as a powerful trend analysis tool. This indicator examines price movements and trading volume across specific sessions, categorizing price action into three phases: Accumulation, Manipulation, and Distribution. Within the indicator, accumulation appears in pink, manipulation is highlighted in green, and distribution is marked in blue. The AMD in
FREE
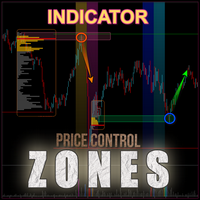
The Bull and Bear Zones indicator is specifically designed for the automatic identification and visual display of support and resistance zones directly on the chart. Its unique algorithm allows it to display not only the zones already tested by the market but also potential target zones that have yet to be tested. The indicator tracks ranges where an imbalance between supply and demand is observed. Key Features: Automatic identification of support and resistance zones : The indicator calculates
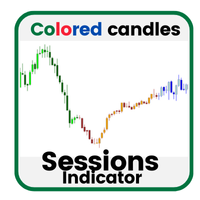
This indicator shows trading sessions using colored candles. It's made for volume profile and supply/demand traders to quickly see when specific candles are formed during different times or trading sessions.
Take a look at the screenshots for an example of usage.
Core Features: Different colors for bullish and bearish candles, making it easy to distinguish between them.
FREE

BREAKOUT-SESSION-BOX LONDON EU US ASIA Open
watch the expectation of a volatile movement above or under the opening range We take the high of the range as Entry for a long trade and SL will be the low of the range and vice versa the low of the range as Entry for a short trade and the high for SL The size of the range is the distance to the TP (Take Profit) The range of the opening hours should not be larger than about 1/3 of the average daily range 4 breakout examples are already predefined: A
FREE

Modified oscillator MACD. A classic indicator that combines a trend indicator with an oscillator to detect entry points. Has a multi-timeframe panel and 3 types of notifications
Benefits:
Works on all instruments and timeseries Trend indicator with oscillator for inputs Multi-period panel on all timeframes Pluggable arrows when signals appear Three types of notifications: push, email, alert
MT5 version -> HERE / Our news -> HERE
How the indicator works:
AW Classic MACD - Indicator of
FREE

Keltner Channel is a well known indicator that not in MT4's indicators default lineup (You can get this from your broker somehow). This indicator helps you to define trend and sometimes overbought/oversold prices during flat trend. Input Description: EMAperiod: Moving Average period used for indicator. Must be higher than 1. ATRperiod: Average True Range period used for indicator. Must be higher than 1. multiplier: Multiplier used for determine channel's wide. Must be higher than 0 but may not b
FREE

The VWAP Level indicator is a technical analysis tool that calculates the weighted average price for the traded volumes of a specific asset. The VWAP provides traders and investors with the average price of an asset over a specific time frame.
It is commonly used by investors to compare data on "passive" trading operations, such as pension funds and mutual funds, but also by traders who want to check if an asset has been bought or sold at a good market price.
To calculate the VWAP level we us
FREE

Smart Level Pro is a very powerful indicator based on the concept of order blocks and set entries with the right fvg and breakouts to create a very good entry level like a professional trader. Very easy to use interface and easy to enter on buy and sell signals. Special offer! Any 2 advisors of your choice for only 99$ Any 2 indicators of your choice for only 49$ -------------------------------------------- The offer is limited in time, don't miss this chance. Write in a private message or in
MetaTrader 마켓은 거래 로봇과 기술 지표들의 독특한 스토어입니다.
MQL5.community 사용자 메모를 읽어보셔서 트레이더들에게 제공하는 고유한 서비스(거래 시그널 복사, 프리랜서가 개발한 맞춤형 애플리케이션, 결제 시스템 및 MQL5 클라우드 네트워크를 통한 자동 결제)에 대해 자세히 알아보십시오.
트레이딩 기회를 놓치고 있어요:
- 무료 트레이딩 앱
- 복사용 8,000 이상의 시그널
- 금융 시장 개척을 위한 경제 뉴스
등록
로그인
계정이 없으시면, 가입하십시오
MQL5.com 웹사이트에 로그인을 하기 위해 쿠키를 허용하십시오.
브라우저에서 필요한 설정을 활성화하시지 않으면, 로그인할 수 없습니다.