YouTubeにあるマーケットチュートリアルビデオをご覧ください
ロボットや指標を購入する
仮想ホスティングで
EAを実行
EAを実行
ロボットや指標を購入前にテストする
マーケットで収入を得る
販売のためにプロダクトをプレゼンテーションする方法
MetaTrader 4のためのテクニカル指標 - 138

This indicator works on MT4 and is very easy to use. When you receive a signal from it, you wait for that candle with the signal to close and you enter your trade at the beginning of the next new candle . A red arrow means sell and a green arrow means buy. All arrows comes with Alert like for easy identification of trade signal. Are you okay with that?
1 minute candle
1 minute expire

Adjustable Consecutive Fractals looks for 2 or more fractals in one direction and sends out a on screen alert, sound alert and push notification, for strong reversal points .
Adjustable Consecutive Fractals, shows the fractals on chart along with a color changing text for buy and sell signals when one or more fractals appear on one side of price.
Adjustable Consecutive Fractals is based Bill Williams Fractals . The standard Bill Williams fractals are set at a non adjustable 5 bars, BUT withe
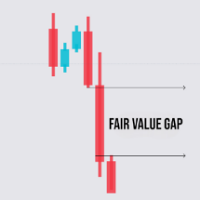
FVG Analyzer は、MetaTrader 4 用にカスタマイズされたインディケーターで、価格チャート上の公正価値ギャップ(Fair Value Gaps、FVG)を検出して強調表示するために設計されています。このツールは、価格のギャップが発生したエリアを検出し、これらのギャップに基づいた潜在的な取引機会を提供します。 主な特徴: FVGの検出 : ブルリッシュFVG : 次のローソク足の最高値が前のローソク足の最低値よりも低い場合に、高値のギャップを検出します。 ベアリッシュFVG : 次のローソク足の最低値が前のローソク足の最高値よりも高い場合に、低値のギャップを検出します。 強調表示 : チャート上に色付きの長方形を描画してFVGを表示します。 FVGが埋まると、事前に設定された色に基づいて長方形の色を変更するオプションがあります。 FVG内に埋め込み用のラインを表示し、ラインの色、太さ、スタイルを調整できます。 設定パラメータ : ローソク足の数 : FVGを検出するために使用するローソク足の数を定義します。 FVGの最小幅 : 検出するためのギャップの最小幅(ポイント

This indicator/dashboard , is place on a single symbol. It shows the percentage of movement withing all time frames from M1 to W1.The text will change green if all % are in the positive for a buy signal.The text will change red if all % are below zero and in negative for a sell signal. There are audible notifications, as well as on screen notifications along with push notifications that can be turned on and ON/OFF in the settings.
This is a sure way to Find trends quickly and efficiently, with
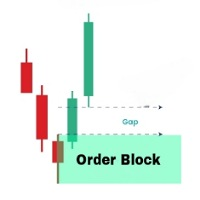
OrderBlock Analyzer は、MetaTrader 4 (MT4) 用にカスタマイズされたインジケーターで、価格チャート上のオーダーブロック(Order Blocks)を検出し、ハイライトします。このインジケーターは、市場の主要な構造を特定するのに役立ち、反転や継続の可能性のある領域を示します。OrderBlock Analyzer は、マーケットの動きに基づいて、自動的にオーダーブロックを描画し、上昇と下降のブロックを異なる色で区別します。 主な機能: 上昇および下降オーダーブロックの検出とマーキング。 グラフ上でリアルタイムにオーダーブロックを更新し、トレーディングのチャンスを迅速に特定します。 オーダーブロックの色、ボーダーライン、ラインスタイルのカスタマイズが可能です。 ボーダーラインの色と厚さの柔軟な設定。 このインジケーターは、トレンドや反転に基づいたトレーディング戦略を使用するすべてのタイプのトレーダーに最適です。
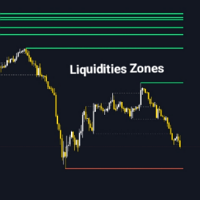
Liquidity Zone Detectorは、ZigZagインジケーターを使用して市場の重要な流動性ゾーンを特定し、強調するために設計された高度なテクニカルインジケーターです。このツールは、ZigZagによって検出された高値と安値にトレンドラインを描画することで、重要な流動性が存在する可能性のある価格レベルを特定します。Liquidity Zone Detectorは、流動性の蓄積や放出に基づいて、トレンドの反転や継続の可能性があるエリアを特定するのに役立ちます。 主な機能: 自動流動性ゾーン識別 : ZigZagインジケーターによって特定された高値と安値にトレンドラインを描画します。 高度なカスタマイズ : 流動性ラインの色、厚さ、スタイルを調整可能です。 動的な色変更 : 流動性レベルが突破された時にラインの色を変更するオプションがあります。 調整可能なZigZagパラメータ : より正確な検出のために、ZigZagの深さ、偏差、バックステップを調整できます。 Liquidity Zone Detectorは、市場の構造を分析し、重要な価格変動が発生する可能性のあるゾーンを特定
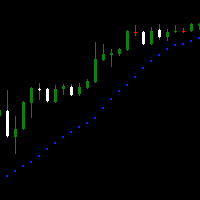
Доброго времени суток.
Вашему вниманию простой, но крайне удобный продукт для любителей индикатора Parabolic SAR . Он представляет собой окно осциллятора, на который выводится несколько тайм-фреймов в режими реального времени вместе с индикатором.
Настройки интуитивно понятные, что бы включать и отключать количество выбранных таймов - необходимо применять PERIOD_CURRENT, в таком случае дополнительный тайм не откроется.
Пишите в комментариях к продукту, что бы вы хотели увидеть в новых вер
「リアルタイム・マルチインジケーター」とは何ですか? 「リアルタイム・マルチインジケーター」は、テクニカル分析を簡素化し、最適化するために設計された高度なトレーディングツールです。この革新的なインジケーターは、複数のタイムフレームやテクニカル指標からのシグナルを収集し、それらを単一の、わかりやすく読みやすいテーブルに表示します。チャートを頻繁に切り替えたり、各インジケーターを手動で分析したりすることなく、マーケットの全体像を把握したい方には、「リアルタイム・マルチインジケーター」が最適なソリューションです。 「リアルタイム・マルチインジケーター」を選ぶ理由は? マルチタイムフレーム分析: 「リアルタイム・マルチインジケーター」は、異なるタイムフレームで市場を同時に監視することができます。M15からH4まで、このインジケーターは各タイムフレームでトレンドが上昇か下降かを明確に示し、市場の全体像に基づいた情報に基づいた意思決定をサポートします。 複数の指標の統合: このツールは、パラボリックSAR、MACD、SMA、ADX、およびCCIなど、いくつかの重要なテクニカル指標のシグナルを組み合

he "Super Trampoline" is an innovative trading indicator designed to simplify decision-making in financial markets. It analyzes chart data and provides clear and timely signals on when to buy or sell an asset, based on a proven strategy of candlestick pattern analysis. Product Advantages: Intuitive Interface : "Super Trampoline" integrates directly into your trading terminal, displaying signals as simple arrows on the chart. This means you don't need deep technical analysis knowledge to start us

Introducing "Super Transplant with Filter" — a game-changing tool for traders who value precision, reliability, and simplicity. This indicator combines advanced trend analysis techniques with intelligent signal filtering, allowing you to make decisions based on the most relevant data. Benefits of "Super Transplant with Filter": Accuracy in Every Trade : The indicator meticulously analyzes market data, identifying key trends while filtering out false signals. This enables you to make more informe
9月1日(日)まで、77.90ドルから37.90ドルに割引 「Forex Scanner」とは何ですか? 「Forex Scanner」は、外国為替市場をリアルタイムで包括的に把握するために設計された強力な取引ツールです。この高度なインジケーターは、複数のテクニカルインジケーターや時間枠から重要なデータを収集し、取引の機会を迅速に特定できるようにします。複数の資産やパラメーターを監視しつつ、チャートを切り替えることなく取引したい場合、「Forex Scanner」は最適なソリューションです。 「Forex Scanner」を選ぶ理由 マルチタイムフレームスキャン: 「Forex Scanner」は、数分から数時間のさまざまな時間枠で市場を監視することができます。このツールは、複数の時間レベルでトレンドや取引シグナルを即座に識別するのに役立ち、完全で詳細な市場のビューに基づいて行動することを可能にします。 複数インジケーターの統合: このインジケーターは、ATR、RSI、ストキャスティクス、ADX、ピボット、MAなど、幅広いテクニカルツールを統合しており、各資産の市場状況を明確かつ正確に

Trend detection is one of the basic challenges of every trader. Finding a way to tell when to enter a trade is very important, timing is a game changer, not too early and not too late. Sometimes, due to not knowing the market conditions, the trader closes his positions with a small profit or allows the losses to grow, these are the mistakes that novice traders make. Indicator Trend Whipper is a complete trading strategy and can improve the trader's trading process. The trend detection algorithm
Scalping Strategy BUY SELL
Having a strategy in the market is one of the main conditions for trading. The presence of various and complicated indicators and tools sometimes makes trading difficult, and the user gets confused after trying various methods and gets stuck in a loss cycle, the result of which is usually clear. This indicator is a simple strategy based on the detection of pivots and short-term trends, which helps you to easily trade in trends. Sometimes a simple but efficient st

TitanVision indicator is a versatile technical analysis tool that helps traders identify market trends and potential entry and exit points. It features a dynamic Trend Catcher Strategy, adapting to market conditions for a clear visual representation of trend direction and various trend reversal points. Traders can customize the parameters according to their preferences. The indicator helps in identifying trends, signals possible reversals, acts as a trailing stop mechanism and provides real-tim
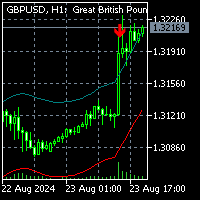
To get access to MT5 version click here . This is the exact conversion from "Nadaraya-Watson Envelope" by " LuxAlgo ". (with non-repaint input option) This is not a light-load processing indicator if repaint input is set to true . All input options are available. Buffers are available for processing in EAs. I changed default input setup to non-repaint mode for better performance required for mql market validation procedure . Here is the source code of a simple Expert Advisor operating
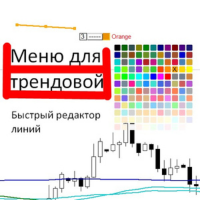
Выпадающее меню для трендовых линий и прямоугольника. Позволяет редактировать цвет, стиль и толщину. При выделении линии появляется меню, каждая функция разделена. Можно сразу нажать и поменять на нужное. Толщина меняется по другому, нужно нажать на цифру, она станет в синем цвете, нажать нужную цифру от 1 до 4, в зависимости от нужной толщины, нажать интер.

WaPreviousCandleLevels MT4 shows the previous candle levels, it shows the previous candle Open High Low Close levels (OHLC Levels) in different time frame. It's designed to help the trader to analyse the market and pay attention to the previous candle levels in different time frame. We all know that the OHLC Levels in Monthly, Weekly and Daily are really strong and must of the time, the price strongly reacts at those levels. In the technical analysis, the user can use them as a support and res
Enhanced RSI: より深いテクニカル分析のためのハイブリッドインジケーター Enhanced RSIは、トレーダーにより包括的で正確な市場分析を提供するために設計された、多用途でカスタマイズ可能なテクニカルインジケーターです。移動平均、RSI、MACDの最良の特徴を組み合わせることで、このインジケーターはモメンタムとトレンドの強さの多次元的な視点を提供します。 主な特徴: 完璧なハイブリッド: Enhanced RSIは、移動平均、RSI、MACDの機能を融合させ、価格動向のより完全な把握を提供します。 最大の柔軟性: カスタマイズ可能な期間により、このインジケーターはどんなトレードスタイルや時間枠にも適応します。 汎用性: 外為市場から仮想通貨、株式、指数まで、あらゆる金融資産で機能します。 分析サポート: Enhanced RSIは自動取引システムではなく、あなたのテクニカル分析を強化するための有用なシグナルと確認を提供するツールです。 動作原理: Enhanced RSIは、RSIの指数移動平均を計算し、それをMACDからのシグナルと組み合わせます。その結果、買われ過ぎ

Super Reversal Pattern Indicator
Unlock the power of advanced pattern recognition with our Super Reversal Pattern Indicator. Designed for traders seeking precision and reliability, this indicator identifies one of the most effective reversal patterns in technical analysis, offering a significant edge in your trading strategy. Key Features: Non-Repainting Accuracy: Enjoy the confidence of non-repainting technology. Once a Super Reversal Pattern is detected, it remains static, providing consis
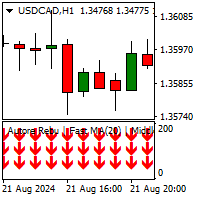
The MovingAverageTrends Indicator is a technical analysis tool designed to identify the overall market direction and provide buy or sell signals. The indicator uses three moving averages, where different periods can be set. How It Works Bullish Conditions: The indicator shows three green upward arrows when all three moving averages are trending upwards. This signal suggests that the market is in a bullish phase, and it could be a good time to enter a long position. Bearish Conditions: The indica

Volume PRO is an innovative and modernized indicator for analyzing trading volumes, which is an advanced version of traditional analysis tools. This high-tech indicator allows traders to effectively monitor trading activity without the need for complex calculations. It displays ticks for the selected time interval corresponding to the selected time frame in the form of a dynamic cumulative histogram, which is updated in real time as new trades are received. Key features: Innovative volume analys
The indicator system plots key levels automatically for multiple forex pairs.
It also provides candle color to help with direction
Best on GBPUSD and EURUSD - H1
JPY pairs on 15m
To deactivate a level, just select color none.
Best to use with my indicator Arrow X - See second screenshot
The color, line style and thickness can be adjusted as preferred.
Symbol: Most forex pairs Timeframe: Depends on pair chosen
Enjoy! ------------------------------------------
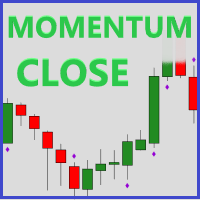
Momentum Close is a useful tool to identify volume based on the strength of a candle close. A strong candle close is when there is a small wick in comparison to the candle body and is a sign that the market will continue in that direction. *This is a NON-repainting indicator*
How this can help you? Identify trend strength Trend confirmation Seeing potential reversals (strong rejection candle) Developing entry and exit strategies Strong confluence to add to your strategy Volume analysis
Feat

The Multi MA Trend Change MT4 indicator is designed to help traders identify and capitalize on trend shifts with precision. By monitoring multiple moving averages, it highlights areas where trends are either gaining strength or beginning to reverse. This makes it an excellent tool for spotting early trend changes and anticipating market movements before they become apparent. The indicator excels in identifying potential retracement entries, ensuring that traders can catch pullbacks during establ

Advanced ATR Trailing Stop with EMA Filter Indicator Introducing the ATR Trailing Stop with EMA Filter Indicator , a powerful tool designed to enhance your trading strategy with advanced signal filtering. This indicator combines the precision of ATR (Average True Range) trailing stop calculations with the flexibility of an EMA (Exponential Moving Average) filter, ensuring you capture the best opportunities in the market. Key Features: Dual Signal Arrows: The indicator provides two types of arrow

Zenマーケットフロー - MTFスーパートレンド
MTFスーパートレンドは、任意のタイムフレームで使用できるシステムです。このマルチタイムフレームインジケーターは、1つから3つのタイムフレームのシグナルを同時に表示し、それらの整合性を示します。
スーパートレンドインジケーターを気に入っている方は、このバージョンもきっと気に入るでしょう。
インジケーターのシグナルと描画をバックテストでテストすることもでき、マルチタイムフレームのシグナルを表示することができます。
すべてのタイムフレームが同じ方向を示しているときに、インジケーターはシグナルを提供し、スクリーンショットを撮り、アラートウィンドウをポップアップし、メールやプッシュ通知をスマートフォンに送信します。
高いタイムフレームの場合、クローズしたローソク足に基づいて値を表示するか、ローソク足ごとにインジケーターの値がどのように変化したかを確認するオプションがあります。
バックテストを行いたい場合も問題ありません。インジケーターは現在のタイムフレームのローソク足に基づいて、より高いタイムフレームのローソク足をシ

This is a comprehensive multi-timeframe , multi-indicator dashboard designed to simplify and enhance your trading experience. The dashboard provides real-time insights across multiple currency pairs and timeframes, helping traders quickly assess market conditions and make informed decisions. With a user-friendly interface, customizable settings, and a robust selection of indicators, this tool is an essential addition to any trader's arsenal.
Key Features: Multi-Timeframe Analysis: Monitor key

The indicator is a double Rsi based histogram.
The coloring can repaint one bar backwards because of smoothing but still gives early signals
Check out my indicator - Pullback Arrows - https://www.mql5.com/en/market/product/123506
The values and colors can be changed as preferred.
Green bullish and red bearish
Symbol: Any Timeframe: Any
Enjoy! -----------
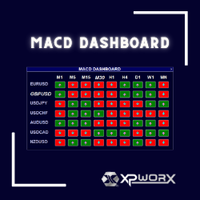
Simplify Your Trading with the MACD Dashboard
Are you tired of juggling multiple MetaTrader charts to monitor MACD across different timeframes and symbols? The MACD Dashboard is the solution you've been waiting for. This innovative MetaTrader indicator provides a centralized view of MACD signals on multiple charts, making it easier than ever to identify trading opportunities and manage your risk.
Key Features: Multi-Timeframe Monitoring: Track MACD signals on multiple timeframes simultaneou
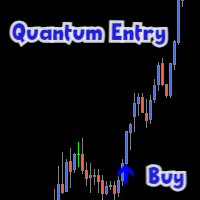
Top Quantum Entry MT4 indicator that gives signals to enter trades.
Perfect entry points for currencies, cryptocurrency, metals, stocks and indices.
The indicator 100% does not repaint!!!
If a signal appears, it does not disappear anymore! Unlike indicators with redrawing, which lead to loss of deposit, because they can show a signal, and then remove it.
Trading with this indicator is very easy.
Wait for a signal from the indicator and enter the deal, according to the arrow
(
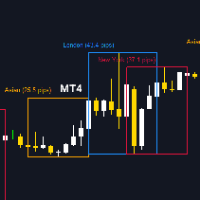
このインジケーターの機能に入る前に、この商品に評価を付け、経験を共有するためにコメントを残し、最新の更新や新しいツールについての通知を受け取るために私のページに登録してください。あなたのサポートは非常に貴重で、私の創作を常に改善するのに役立ちます! 説明: TradingSessionPipsVisualizer は、MetaTrader 4 用に設計された強力なインジケーターで、チャート上に主要な取引セッションを視覚的に表示します。このツールは、アジア、ロンドン、ニューヨーク、シドニー、フランクフルトなど、さまざまな取引セッションを簡単に区別できるようにし、これらの重要な期間における市場の動きをよりよく理解するのに役立ちます。 主な機能: 取引セッションの可視化: アジア、ロンドン、ニューヨーク、シドニー、フランクフルトの取引セッションを、チャート上で色分けされた矩形で明確に表示します。 カスタマイズ可能なパラメーター: 各セッションの矩形の色、線の幅、および塗りつぶしオプションを好みに応じて調整できます。 動的表示: インジケーターは、表示する日数に基づいて自動的に適応

An imbalance bar or candle, also called a fair value gap (FVG) or inefficiency, shows strong buying or selling in the market or weak buying or selling that causes prices to move quickly with high momentum. This is why it's an important part of price action analysis. Our indicator offers three main benefits: Clear Design: The imbalance bar is built into the candle with a simple, clean look that makes it easy for traders to spot while keeping the chart tidy. Easy to Use: A hotkey lets traders quic
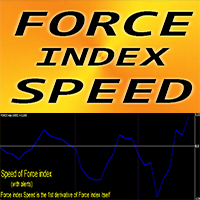
MT4 用 Forex インジケーター「Force index Speed」
このインジケーターの計算は、物理学の方程式に基づいています。Force index Speed は、Force index 自体の 1 次導関数です。 Force index は、価格とボリュームのデータを 1 つの値に組み合わせるトップ インジケーターの 1 つです。 Force index Speed は、メイン トレンドの方向にスキャルピング エントリするのに適しています。適切なトレンド インジケーターと組み合わせて使用します。 Force index Speed インジケーターは、Force index 自体が方向を変える速度を示します。非常に敏感です。 Force index Speed インジケーターの値が < 0 の場合: 速度は負です。Force index インジケーターの値が > 0 の場合: 速度は正です。 インジケーターには、モバイルおよび PC アラートが組み込まれています。
// より優れたエキスパート アドバイザーとインジケーターは、こちらで入手できます: http
The Stochastic Multicurrency Scanner Dashboard MT4 is a powerful tool for monitoring multiple currency pairs and timeframes using the Stochastic oscillator. It organizes signals in a grid format, displaying each symbol’s status across timeframes from M1 to MN1. Traders can enable or disable specific timeframes to suit their strategies. You can find the MT5 version here Stochastic Oscillator Multicurrenty Scanner MT4 For detailed documentation click here Stochastic Oscillator Integration: Th

The indicator is a simple bar oscillator with green and red bars
The calculation of the bars are Rsi based
The values of the bars does not recalculate after bar has closed
Higher green bars shows possible bullish momentum and vice versa
The indicator has no settings or alerts
The colors can be adjusted as preferred but the bar width should remain on default
Suitable for any timeframe or instrument
Test in demo before purchase
Enjoy ----------------------------------------------
This indicator managge all kind of ICT FVG include: FVG, SIBI, BISI, Inverse FVG. The advantage point of this indicator is mangage FVG on all timeframe. FVG - Fair value gap ICT Fair value gap is found in a “three candles formation” in such a way that the middle candle is a big candlestick with most body range and the candles above & below that candle are short and don’t completely overlap the body of middle candle. * This indicator allow filter FVG by ATR. So you can just show valid FVG which

The Real Cloud indicator for MT4 is a popular and useful Forex indicator. This indicator provides traders with an easy way to identify potential trading opportunities in the Forex market. The Real Cloud indicator uses a unique algorithm to analyze price action and generate signals. It is designed to identify strong trends and provide traders with an edge in their trading. The Real Cloud indicator is easy to use and requires no additional setup. Simply attach the indicator to your chart and it wi
Индикатор Order blocks Mtf строит уровни на основе smart mony(умные деньги) Строит уровни как сразу получил излом тренда, индикатор очень удобен и практичен для использование на форекс и на бинарных опционов В него в шита система поиска сигналов на касании старших уровней таким же уровней излома тренда и ретеста к среднему значению При касании уровня очень хорошо отрабатывает на бинарных опционах,
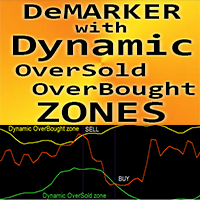
MT4 用 Forex インジケーター「ダイナミックな売られ過ぎ/買われ過ぎゾーンを備えた DeMarker」。
DeMarker オシレーター カーブは、インジケーターの計算期間中の以前の高値と安値に対する現在の価格位置を示します。 ダイナミックな買われ過ぎゾーンから売りエントリーを取り、ダイナミックな売られ過ぎゾーンから買いエントリーを取るのに最適です。 このインジケーターは、プライス アクション エントリーと組み合わせるのにも最適です。 ダイナミックな買われ過ぎゾーン - 黄色の線より上 ダイナミックな売られ過ぎゾーン - 緑の線より下 DeMarker 自体は、他のオシレーターの中で最も効率的な定期的なダイバージェンス シグナルを提供します。
// より優れたエキスパート アドバイザーとインジケーターは、こちらで入手できます: https://www.mql5.com/en/users/def1380/seller これは、この MQL5 Web サイトでのみ提供されるオリジナル製品です。
Ephraim Umpan Gold Coins Magnet Indicator is an Indicator that helps traders do the decisions. With this Indicator, Every trader will now have an edge in trading and will be more profitable in their trades. Accordingly, this indicator can help increased the winning capability of every trader. Would you like to try of this indicator? Now is your chance to do so.

To access the TD sequential Scanner for MT5, please check https://www.mql5.com/en/market/product/123369?source=Site +Market+My+Products+Page. One of the MT5 versions includes additional timeframes such as M1, M2, M3,H2,H6,H8 and so on.( https://www.mql5.com/en/market/product/123367?source=Site +Market+My+Products+Page) TD Sequential Scanner: An Overview The TD Sequential scanner is a powerful technical analysis tool designed to identify potential price exhaustion points and trend reversals in fi

The Great Oracle is a powerful trend-following indicator designed for traders who seek precision in their entries and exits. Whether you’re navigating trending markets or spotting opportunities in ranging conditions, The Great Oracle provides you with accurate signals and a second chance to join strong market trends. It’s the ultimate tool for traders who want to maximize profits while keeping risks manageable. Key Features: • Can be used for any asset: Metal (Gold), Cryptocurrency (Bitcoin), Cu
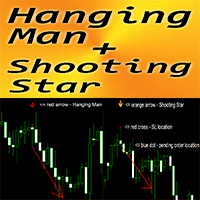
MT4 用 Forex インジケーター「ハンギングマンとシューティングスターパターン」
インジケーター「ハンギングマンとシューティングスターパターン」は、プライスアクション取引に非常に強力なインジケーターです。再描画なし、遅延なし。 インジケーターは、チャート上の弱気なハンギングマンとシューティングスターパターンを検出します。 弱気なハンギングマン - チャート上の赤い矢印信号 (画像を参照) 弱気なシューティングスター - チャート上のオレンジ色の矢印信号 (画像を参照) PC、モバイル、および電子メールアラートが含まれています インジケーター「ハンギングマンとシューティングスター」は、サポート/レジスタンスレベルと組み合わせるのに最適です
// より優れたエキスパートアドバイザーとインジケーターは、こちらで入手できます: https://www.mql5.com/en/users/def1380/seller これは、この MQL5 ウェブサイトでのみ提供されるオリジナル製品です。
Customisable Timelines Indicator for MT4
Transform your technical analysis with our Customisable Timelines Indicator for MT4! This powerful indicator allows you to mark specific moments on the chart by plotting vertical lines at times set by you. Ideal for highlighting market openings, important economic events, or any other crucial moment for your trading strategies.
Main features:
Flexible Configuration: Adjust the schedules of the vertical lines as per your need. Clear Viewing: Coloure

Filter out small price movements and focus on the larger trend . Renko chart indicator will help you to filter out a minor price movements so that you can focus on the overall trend. The price must move a specified amount to create a Renko brick. This makes it easy to spot the current trend direction in which the price is moving. My #1 Utility : includes 65+ features | Contact me if you have any questions | MT5 version In the settings of the indicator, you can configure: Calculation Se

Detailed blog post with extras downloads: https://www.mql5.com/en/blogs/post/759154
About: Price ranges most of the time in forex… Like 70-80% of the time. And then it breaks out of the range to continue in a trend. Even in a trend, price makes smaller ranges all the time. Range Breaker Scalper is a tool to find the times when price breaks out of a range. A sudden break means that price will continue on for next few bars towards the breakout. So, these areas are best for scalping. Especially i
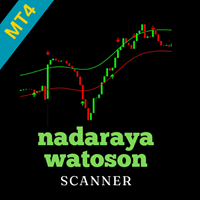
Nadaraya Watson Envelop Scanner for MetaTrader 4 Overview
The Nadaraya Watson Envelop Scanner for MT4 is a powerful multi-symbol and multi-timeframe tool that extends the functionality of the Nadaraya Watson Envelop indicator. By scanning across multiple symbols and timeframes, this scanner allows traders to detect key signals and trend reversals efficiently within the MT4 environment. Key Features Multi-Symbol & Multi-Timeframe Scanning : Automatically scans various symbols and timeframes to
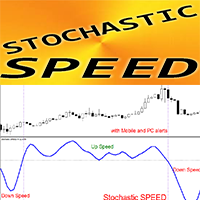
MT4 用 Forex インジケーター「Stochastic Speed」 - 優れた予測ツール!
このインジケーターの計算は、物理学の方程式に基づいています。 Stochastic Speed は、Stochastic 自体の 1 次導関数です。 Stochastic Speed は、Stochastic が売られ過ぎ/買われ過ぎゾーンにあり、Speed がリバウンド フックを作成しているときに、スキャルピング エントリに最適です (画像を参照)。 モメンタム トレーディング戦略には、Stochastic Speed インジケーターの使用をお勧めします。 Stochastic Speed が 0 を超える場合 - これは正の速度です: 価格のモメンタムが上昇します。 Stochastic Speed が 0 を下回る場合 - これは負の速度です: 価格のモメンタムが下降します。 Stochastic Speed インジケーターは、Stochastic 自体が方向を変える速度を示します - 非常に敏感です。 インジケーターには、モバイルおよび PC アラートが組み込まれています。
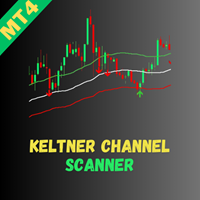
Welcome to the Keltner Channel Multicurrency Scanner , an advanced tool designed to enhance your trading by detecting Keltner Channel breakouts and real-time insights. This MT4 indicator is built to scan multiple currency pairs simultaneously, helping you capitalize on market trends more effectively. Key Features: Effortless Multicurrency Scanning
Monitor multiple currency pairs in real-time and receive instant alerts when key Keltner Channel breakout signals are detected. This allows you to r

Statistical Trend Indicator is an advanced custom indicator designed to analyze market movements and provide traders with calculated probabilities of upward or downward trends. By analyzing historical price data over a specified lookback period, this indicator computes the likelihood of the market continuing in either direction, offering traders a statistical edge in decision-making.
Key Features: Probability Display: It calculates and displays the percentage probabilities of an upward or dow
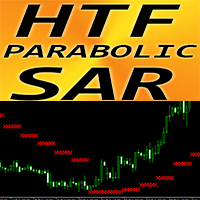
MT4 用外国為替インジケーター パラボリック SAR 高時間枠
MT4 用の優れた補助 HTF PSAR インジケーターで取引方法をアップグレードします。HTF は高時間枠を意味します PSAR は、価格変動のトレンド方向と潜在的な反転を判断するために使用されます。 このインジケーターは、トレーリング ストップに使用するのに最適です PSAR が価格より上にある場合 - 下降トレンド PSAR が価格より下にある場合 - 上昇トレンド このインジケーターは、メイン トレンドの方向への価格アクション エントリと組み合わせるのに最適です
// より優れたエキスパート アドバイザーとインジケーターは、こちらで入手できます: https://www.mql5.com/en/users/def1380/seller これは、この MQL5 Web サイトでのみ提供されるオリジナル製品です
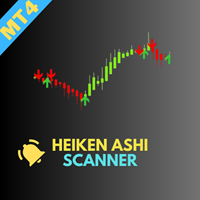
Welcome to the Heiken Ashi Multicurrency Scanner , an advanced tool designed to help traders efficiently monitor market trends using the Heiken Ashi indicator. This MT4 scanner allows you to scan multiple currency pairs simultaneously, enabling quick identification of market trends and reversal opportunities. Key Features: Effortless Multicurrency Scanning
Track numerous currency pairs in real-time and receive instant alerts when significant Heiken Ashi signals are detected. Stay ahead of mark
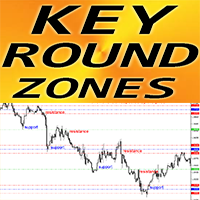
MT4 用 Forex インジケーター「キー ラウンド ゾーン」
インジケーター「キー ラウンド ゾーン」は、サポート/レジスタンスを考慮するトレーダーにとって必須の補助インジケーターです 1000 ラウンド レベルと 500 ラウンド レベルは価格によって尊重され、価格がそこから頻繁に反発します 主要な 1000 レベルには、その周囲に強力なサポート/レジスタンス ゾーン (両側に 100 ポイント) もあります また、1000 ラウンド レベルと 500 ラウンド レベルは、テイク プロフィット (ラウンド レベルの前) と SL (ラウンド レベルの後ろ) を配置するのに適しています これらのレベルは、特に市場で価格が横ばいまたはフラットなときに特に強力です
// より優れたエキスパート アドバイザーとインジケーターは、こちらで入手できます: https://www.mql5.com/en/users/def1380/seller これは、この MQL5 Web サイトでのみ提供されるオリジナル製品です。
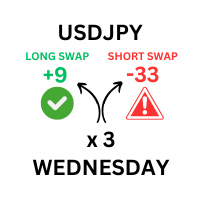
このツールは、取引プラットフォームで利用可能なすべての通貨ペアの詳細なスワップレートを表示するように設計されています。 これにより、トレーダーは視覚的に強化された別個のウィンドウでロングとショートの両方のスワップ値をすばやく確認できます。 このツールは、ロット サイズのユーザー定義の入力を提供し、現在のスワップ レートと取引量に基づいて正確な計算を保証します。 さらに、標準レートと週末調整レートの両方を考慮して、スワップ手数料が適用される時期も提供されます。 注: スワップ情報は取引プラットフォームに応じて毎日変わります。 ------------------------------------------------------------------------------------------------------------------------------------------------------------- このツールは、取引プラットフォームで利用可能なすべての通貨ペアの詳細なスワップレートを表示するように設計されています。 これにより、トレーダーは視覚的

Trend StarteR は、上昇トレンドと下降トレンドのシグナルを矢印の形で提供するマルチ RSI ベースのインジケーターです。このインジケーターは、起こり得るトレンドを予測し、トレーダーがそれらのトレンドの取引に参加できるようにするために作成されました。 このインジケーターは鉱石のバックペイントを再描画しません。このインジケーター信号は遅延しません。 ================= 推奨事項 : 低スプレッドのブローカー、時間枠は問いませんが、スプレッドに勝つには M5 以上に固執することをお勧めします。 ================================= パラメータ: 第 1、第 2、および第 3 RSI 期間 クロスが発生したときに信号が出力される上下のレベル 通知設定: モバイルアラート、サウンドアラート、MT4メッセージ ================================================= ================
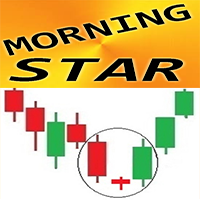
MT4 用 Forex インジケーター「モーニング スター パターン」
インジケーター「モーニング スター パターン」は、プライス アクション トレーディングに非常に強力なインジケーターです。再描画なし、遅延なし。 インジケーターはチャート上で強気のモーニング スター パターンを検出します。チャート上の青い矢印信号 (画像を参照) PC、モバイル、および電子メール アラートが含まれています また、その兄弟である弱気の「イブニング スター パターン」インジケーターも利用できます (以下のリンクに従ってください) インジケーター「モーニング スター パターン」は、サポート/レジスタンス レベルと組み合わせるのに最適です
// より優れたエキスパート アドバイザーとインジケーターは、こちらで入手できます: https://www.mql5.com/en/users/def1380/seller これは、この MQL5 Web サイトでのみ提供されるオリジナル製品です。
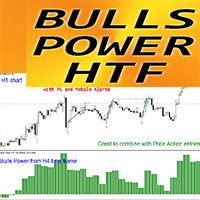
MT4 用 Forex インジケーター Bulls Power HTF
Bulls Power HTF オシレーターは、「買い」エントリーに最適なフィルターです。HTF は Higher Time Frame を意味します Bulls Power インジケーターと Bears Power インジケーターは、トレーディングで対応するトレンドの強さを測定するために使用されます Bulls Power は、買い手のポジションの強さを測定します。 Bulls Power HTF インジケーターは、プライス アクション エントリーを使用するか、他のインジケーターと組み合わせて使用するマルチタイム フレーム トレーディング システムに最適です。 このインジケーターを使用すると、Higher Time Frame の Bulls Power を現在のチャートに添付できます。 インジケーターには、0 レベル クロスのモバイルおよび PC アラートが組み込まれています
// より優れたエキスパート アドバイザーとインジケーターは、こちらで入手できます: https://www.mql5.c
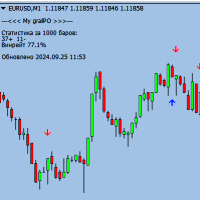
Attention, for the indicator to work correctly, you need to put the "MQL5" folder in your terminal folder, you can download it from the link below: https://disk.yandex.ru/d/DPyo0ntaevi_2A
Binary Scalper 7 is a powerful tool designed to identify and predict the next candle, allowing traders to make informed decisions when trading binary options. This indicator works on any time frame and with any expiration, making it a versatile and reliable tool for traders of all levels.
How it works:

MT4 用 Forex インジケーター「イブニング スター パターン」
インジケーター「イブニング スター パターン」は、プライス アクション トレーディングに非常に強力なインジケーターです。再描画なし、遅延なし。 インジケーターはチャート上で弱気のイブニング スター パターンを検出します。チャート上の赤い矢印信号 (画像を参照) PC、モバイル、および電子メール アラートが含まれています また、その兄弟である強気の「モーニング スター パターン」インジケーターも利用できます (以下のリンクに従ってください) インジケーター「イブニング スター パターン」は、サポート/レジスタンス レベルと組み合わせるのに最適です
// より優れたエキスパート アドバイザーとインジケーターは、こちらで入手できます: https://www.mql5.com/en/users/def1380/seller これは、この MQL5 Web サイトでのみ提供されるオリジナル製品です。
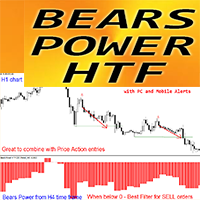
MT4 用 Forex インジケーター Bears Power HTF
Bears Power HTF オシレーターは、「売り」エントリーに最適なフィルターです。HTF は Higher Time Frame を意味します Bulls および Bears Power インジケーターは、トレーディングで対応するトレンドの強さを測定するために使用されます Bears Power は、売り手のポジションの強さを測定します Bears Power HTF インジケーターは、プライス アクション エントリーを使用するか、他のインジケーターと組み合わせて使用するマルチタイム フレーム トレーディング システムに最適です。 このインジケーターを使用すると、Higher Time Frame の Bears Power を現在のチャートに添付できます。 インジケーターには、0 レベル クロスのモバイルおよび PC アラートが組み込まれています
// より優れたエキスパート アドバイザーとインジケーターは、こちらで入手できます: https://www.mql5.com/en/users/

Forex Scalper Indicator – 金融市場で利益を得るための精密ツール
MT4用のForex Scalper Indicatorは、市場で最大の精度でスキャルピングを行いたいすべてのトレーダーにとって完璧な味方です。正確なデータに基づいた分析により、このインジケーターは迅速な決定を下すのに理想的な、タイムリーで正確なシグナルを提供します。
オーダーメイドの精度 チャートに表示される各矢印は綿密な計算に基づいており、最適なエントリーとエグジットの機会を提供します。これらはランダムなシグナルではなく、リアルタイムで市場を分析する正確な指示です。
反転ポイントの正確な検出 このインジケーターは、価格の潜在的な反転ポイントを高精度で識別し、取引において不可欠なツールとなります。信頼できるデータに基づいて生成されたシグナルにより、市場が最も不安定な局面でも利益を最大化できます。
クリーンで読みやすいインターフェース スクリーンショットで見られるように、Forex Scalper Indicatorはチャート上にわかりやすい矢印を表示し、シグナルの読み取りと解釈を
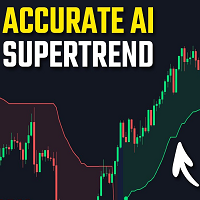
Machine Learning Adaptive SuperTrend - Take Your Trading to the Next Level!
Introducing the Machine Learning Adaptive SuperTrend , an advanced trading indicator designed to adapt to market volatility dynamically using machine learning techniques. This indicator employs k-means clustering to categorize market volatility into high, medium, and low levels, enhancing the traditional SuperTrend strategy. Perfect for traders who want an edge in identifying trend shifts and market condit

Vondereich MTF Strength Indicator Description: Overview: The Vondereich MTF Strength Indicator is a powerful yet user-friendly multi-timeframe analysis tool designed to simplify market insights for traders of all experience levels. By evaluating currency pairs across various timeframes using a combination of technical indicators such as the Stochastic Oscillator, Relative Strength Index (RSI), Exponential Moving Average (EMA), and Average True Range (ATR), this indicator delivers clear buy, sell

Scopri l'Indicatore Avanzato di Zone di Offerta e Domanda Sei pronto a portare il tuo trading al livello successivo? L'indicatore "Advanced Supply and Demand Zone" è lo strumento definitivo per identificare con precisione le zone chiave di supporto e resistenza sul mercato, permettendoti di prendere decisioni informate e tempestive. Come Funziona Questo indicatore innovativo analizza il mercato utilizzando frattali veloci e lenti per individuare i punti di inversione del prezzo. Si basa sui prin

Description : In the world of trading, candlestick patterns are a popular technical analysis tool used by many traders. There are numerous candlestick patterns, ranging from reversal patterns to continuation patterns. However, remembering all these patterns can be challenging, especially for novice traders. This often leads to traders having to manually memorize and identify candlestick patterns, which can be time-consuming and prone to errors. Candle Pattern Pro is a powerful indicator design
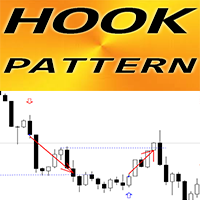
MT4 用 Forex インジケーター「フック パターン」
インジケーター「フック パターン」は、プライス アクション トレーディングに非常に強力なインジケーターです。再描画なし、遅延なし。 インジケーターは、チャート上の強気および弱気のフック パターンを検出します。 強気フック - チャート上の青い矢印信号 (画像を参照) 弱気フック - チャート上の赤い矢印信号 (画像を参照) PC、モバイル、および電子メール アラートが含まれています インジケーター「フック パターン」は、サポート/レジスタンス レベルと組み合わせるのに適しています
// より優れたエキスパート アドバイザーとインジケーターは、こちらで入手できます: https://www.mql5.com/en/users/def1380/seller これは、この MQL5 Web サイトでのみ提供されるオリジナル製品です。
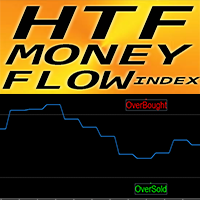
MT4 用 Forex インジケーター HTF MFI オシレーター
マネーフローインデックス (MFI) は、価格とボリュームデータを使用して売られすぎと買われすぎのゾーンを識別するテクニカルオシレーターです HTF は、Higher Time Frame を意味します。MFI が 80 を超えると買われすぎ、20 を下回ると売られすぎになります MFI は価格アクションと組み合わせるのに最適です。強気と弱気の価格モメンタムに関する情報を提供します このインジケーターは、他のインジケーターと組み合わせてマルチタイムフレーム取引システムに最適です。 HTF MFI インジケーターを使用すると、Higher Time Frame の MFI を現在のチャートに添付できます インジケーターにはモバイルと PC のアラートが組み込まれています
// より優れたエキスパートアドバイザーとインジケーターは、こちらで入手できます: https://www.mql5.com/en/users/def1380/seller これは、この MQL5 ウェブサイトでのみ提供されるオリジナル製品で

Unlock the Power of Multi-Market Insights with Our Cutting-Edge Dashboard Indicator
Are you tired of juggling multiple charts and indicators just to stay on top of the markets? Introducing the "RSI & EMA Cross Dashboard" - a revolutionary trading tool that consolidates critical signals across your favorite currency pairs and timeframes into a single, easy-to-read display.
Meticulously coded by our team of seasoned developers, this indicator harnesses the power of RSI and EMA crossover analy

This dashboard shows you the 3MA Cross Overs current status for Multi-currency multi-timeframes. Works for Metatrader 4 (MT4) platform. Detailed Post:
https://www.mql5.com/en/blogs/post/759238
How it Works:
MA Cross Signals It will show “S” Green/Red Strong Signals and “M” or “W” Green/Red Medium or Weak signals. We have 3 types of MA: Faster, Medium and Slower MA. A strong signal is when FasterMA and MediumMA are both above/below SlowerMA. A medium signal is when only FasterMA is above/be

Advancing in NASDAQ 100 Trading with the Smart "Candle Color" Indicator The indicator we offer is one of the good tools for trading in the NASDAQ 100 market, especially in the 1-minute and 5-minute timeframes. This indicator is designed with precision and scientific rigor and can also be used in other timeframes. All you need to do is activate it and leverage its power. Unique Features: Optimized Performance in 1-Minute and 5-Minute Timeframes: This indicator is specifically designed for these
MetaTraderマーケットは、他に類のない自動売買ロボットやテクニカル指標の販売場所です。
MQL5.community ユーザーメモを読んで、取引シグナルのコピー、フリーランサーによるカスタムアプリの開発、支払いシステムを経由した自動支払い、MQL5Cloud Networkなど、当社がトレーダーに対して提供するユニークなサービスについて詳しくご覧ください。
取引の機会を逃しています。
- 無料取引アプリ
- 8千を超えるシグナルをコピー
- 金融ニュースで金融マーケットを探索
新規登録
ログイン