Conheça o Mercado MQL5 no YouTube, assista aos vídeos tutoriais
Como comprar um robô de negociação ou indicador?
Execute seu EA na
hospedagem virtual
hospedagem virtual
Teste indicadores/robôs de negociação antes de comprá-los
Quer ganhar dinheiro no Mercado?
Como apresentar um produto para o consumidor final?
Indicadores Técnicos para MetaTrader 4 - 138
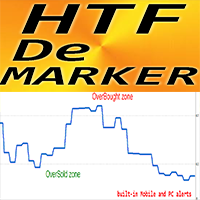
Indicador Crypto_Forex HTF DeMarker para MT4.
- Este indicador é uma ferramenta útil utilizada pelos traders técnicos para encontrar pontos de entrada e saída. HTF significa - Prazo Superior. - A linha do oscilador DeMarker indica a posição atual do preço em relação aos máximos e mínimos anteriores. - O DeMarker fornece os sinais de divergência regular mais eficientes entre outros osciladores. - Zona OverBought é quando o DeMarker está acima de 0,7 e OverSold - quando está abaixo de 0,3. - O i

Pipwise Indicators Multiple MAs The Pipwise Indicators Moving Averages indicator is a powerful tool for technical analysis in MetaTrader 4 (MT4). It allows traders to visualize and analyze moving averages from multiple periods on a single chart. Here are the key features:
Customizable Moving Averages: Traders can choose the number of moving averages to plot (up to 9 MAs). Each Moving Average is customiseable.
Method Selection: The indicator supports various moving average methods, including

Installation MetaTrader 4 Download: Download the provided file PrecisionStopDemo.ex4. Copy the File: Open MetaTrader 4. From the top menu, click on File > Open Data Folder. Navigate to MQL4 > Indicators. Copy the file PrecisionStopDemo.ex4 into this folder. Restart MetaTrader: Close and reopen MetaTrader 4. Add Indicator to Chart: In the Navigator (Ctrl+N), expand the Indicators folder. Find the indicator PrecisionStopDemo and drag it onto the desired chart.
Configuration After adding the ind
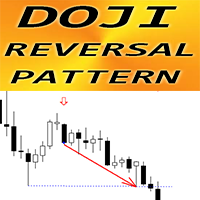
Indicador Crypto_Forex "Padrão de reversão Doji" para MT4.
- Indicador "Padrão de reversão Doji" é pura negociação de ação de preço: sem repintura, sem atraso; - O indicador deteta o padrão de reversão Doji no gráfico em que a vela Doji está no meio do padrão e a última vela é a de rutura: - Padrão de reversão Doji de alta - Sinal de seta azul no gráfico (ver fotos). - Padrão de reversão Doji de baixa - Sinal de seta vermelha no gráfico (ver fotos). - Com alertas de PC, telemóvel e e-mail. - I
Presentation of the "Color Range Indicator" The "Color Range Indicator" is a powerful technical analysis tool designed for the MT4 platform, perfect for traders who want a clear and immediate view of market trends. This indicator draws a colored line based on the current trend, making it easier to interpret price movements. Indicator Description: Green line : Indicates an uptrend. Use this signal to consider buying opportunities. Red line : Indicates a downtrend. Use this signal to consider sell
Trend Analyser Pro is a versatile trend analysis tool designed for traders who want to capitalize on market trends across multiple timeframes. This indicator combines advanced trend detection, dynamic signals, and higher timeframe analysis to provide you with a comprehensive view of market movements, empowering you to make well-informed trading decisions. 50% DISCOUNT - ENDING SOON ! BONUS - Trend Analyser Pro TradingView Indicator - After you purchase or rent this product, please send m
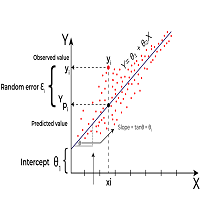
Linear Regression is a statistical method used to model the relationship between two or more variables. The primary goal of Linear Regression is to predict the value of one variable (called the dependent variable or outcome variable) based on the value of one or more other variables (called independent variables or explanatory variables) Linear Regression can be applied to technical analysis, and it is indeed one of the tools used by traders and analysts to make predictions and identify trends i
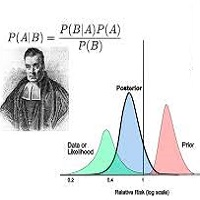
Bayesian methods can be effectively applied to predict price trends in financial markets, including Forex, stocks, and commodities. Here’s how Bayesian techniques can be used for trend prediction: 1. Bayesian Linear Regression Bayesian linear regression can be used to model the relationship between time and price. This method allows for the incorporation of prior beliefs about the trend and updates the trend as new data comes in. Example: Suppose you want to predict the price trend of a curren

It is an indicator which notifies via push notification when an order is closed by Take Profit/Stop Loss It indicates via pc alert and or mobile alert Psychologically you can hold order for long time If stop loss hunting happens you can re-enter with same direction If real break out happens you can reverse the position Overall it Alerts when position reach stop - loss or take-profit level

Advance Currency Meter is a currency meter that detects strong market trends. This indicator is good for scalping, intraday trading and swing trading. The indicator will detect short term to long term market trends. This will give you good insight which currencies are best to trade as of the moment.
Note : Kindly contact me before you make any purchases. This won't work on your account without my permission. Note : Works well with my MACD Currency Strength Meter
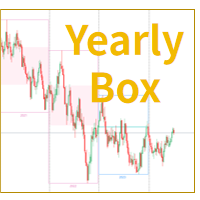
Indicador de Caixa de Velas Anuais do MT4
O indicador "Caixa de Velas Anuais" na plataforma MetaTrader 4 é uma ferramenta de análise de gráficos que visualiza os movimentos de preços de um ano dentro de uma caixa retangular. Este indicador destaca os preços de abertura e fechamento anuais ao delimitar o intervalo de preços e colorir o fundo. Os traders podem identificar e analisar facilmente as flutuações de preços anuais num piscar de olhos, utilizando o indicador de Caixa de Velas Anuais par

Our new indicator is an important part of the Smart Money Concepts (SMC) system
It uses a modern market vision and fast calculation methods. As a result, the trader has a complete picture of the trade at every moment in time, which makes the process of obtaining results easier and faster.
Our new indicator displays the following important patterns:
Order Blocks. Imbalance – Fair Value Gap (FVG). Break Of Structures (BoS). Change of character (CHoCH). Equal highs & lows. Premium , Equilibrium
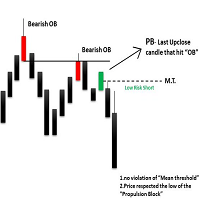
The ICT Propulsion Block indicator is meant to detect and highlight propulsion blocks, which are specific price structures introduced by the Inner Circle Trader (ICT).
Propulsion Blocks are essentially blocks located where prices interact with preceding order blocks. Traders often utilize them when analyzing price movements to identify potential turning points and market behavior or areas of interest in the market. Note: Multiple Timeframe version avaiable at here
USAGE (fingure
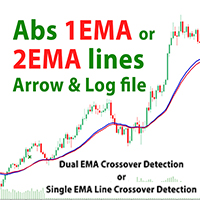
Product: 1 or 2 EMA Lines Crossover Indicator The 2 EMA Lines Crossover Indicator is a powerful and versatile tool designed for MetaTrader 4 (MT4) that helps traders identify potential buy and sell signals based on the crossover of two Exponential Moving Averages (EMAs). This indicator provides visual arrows on the chart to highlight trading opportunities, and it can also log these signals for further analysis. Whether you're a beginner or an experienced trader, this indicator can enhance your t

Este indicador é baseado no Cboe EuroCurrency Volatility Index, também conhecido como Euro VIX, ou EVZ . Basicamente mede a volatilidade da taxa de câmbio Eur/USD , mas pode ser usado para rastrear a volatilidade geral no mercado Forex. O seu melhor uso é adicioná-lo ao seu sistema como uma ferramenta obrigatória, quando o valor estiver acima de 7, você pode esperar algum movimento no mercado, então poderá negociar com risco total, quando o valor estiver abaixo de 7, você negocia com menos
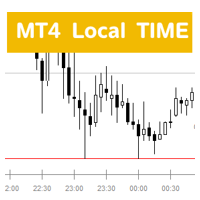
Descrição do Indicador de Hora Local ( MT4 Local Time H4box ) Visão Geral O Indicador de Hora Local é um indicador personalizado projetado para a plataforma MetaTrader 4 (MT4), com o objetivo de fornecer aos usuários a hora local atual de suas respectivas regiões. Este indicador é adequado para traders em todo o mundo, permitindo que visualizem rapidamente a hora local durante as operações de forex, ajudando-os a entender melhor a dinâmica do mercado e as oportunidades de trading. O indica

Moving Pivot Average The pivot indicator compares the selected period with its counterpart from the previous period. The indicator uses very flexible algorithm for pivot value calculating. It allows you to allocate in days a certain time intervals (custom bars) and calculate the average pivot value based on High, Low and Close prices of these bars. How many custom bars will be taken into account is determined by the "Days" setting. The pivot line can be considered an average trend line and us

Determining the current trend is one of the most important tasks of a trader, regardless of the trading style. The Creative Trend indicator will help you do this with a fairly high probability. Creative Trend is a trend recognition indicator that uses the author's calculation algorithm. The indicator readings do not change under any conditions. The indicator is suitable for any currency pair, any timeframe, as long as there is enough historical data for calculations. Indicator Parameters
Main Se

- Real price is 60$ - 50% Discount ( It is 30$ now )
Contact me for instruction, any questions! Introduction Triangle chart patterns are used in technical analysis , which is a trading strategy that involves charts and patterns that help traders identify trends in the market to make predictions about future performance.
Triangle Pattern Scanner Indicator It is usually difficult for a trader to recognize classic patterns on a chart, as well as searching for dozens of charts and time f

Contact me for instruction, any questions! Introduction Chart patterns are an essential tool traders and investors use to analyze the future price movements of securities. One such pattern is the triple bottom or the triple top pattern, which can provide valuable insights into potential price reversals. This pattern forms when a security reaches a low price level three times before reversing upward or reaches a high price level three times before reversing downward.
Triple Top Bottom P
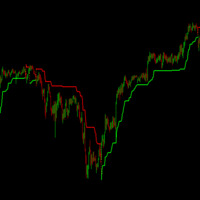
The classic SuperTrend indicator. The best indicator to define trends and small-scale trend changes in any pair and time frame. It is set up in exactly the same way as the TradinView indicator, and can be adjusted and complemented with other indicators to create profitable strategies or expert advisors, or used individually to profit from the market. Based on the average volatility of the last candles and the price movement, it draws a green line below the price if an bullish microtrend is ident
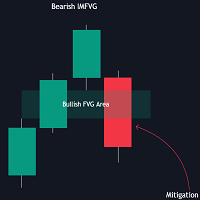
The FVG Instantaneous Mitigation Signals indicator detects and highlights "instantaneously" mitigated fair value gaps (FVG), that is FVGs that get mitigated one bar after their creation, returning signals upon mitigation.
Take profit/stop loss areas, as well as a trailing stop loss are also included to complement the signals.
USAGE Figure 1 Instantaneous Fair Value Gap mitigation is a new concept introduced in this script and refers to the event of price mitigating a fair value gap one

The One and Only!, simply the best!, amazing! entry indicator Golden Move. Try it yourself as it proves its quality with its results.
Settings: AlertConfirmation: turns on and off alerts CalculatedBars: how many bars will be calculated Distance : arrow distance
Buffers: Buffer0 (Arrow Buy) Buffer1 (Arrow Sell) Buffer2 (Buy value == 1) Buffer3 (Sell value == 1)

Moving pivot Average Fibonacci
The indicator compares the selected period with its counterpart from the previous period. The indicator determines the moving Fibonacci levels for the day or any time interval to assess the price movement range from the time average. The indicator helps predict the expected high or low for the day based on historical time data. The pivot line can be considered an average trend line and use it in a variety of trading strategies.
If you have any question about the

Dynamic Range Indicator for MQL4 Introducing our cutting-edge Dynamic Range Indicator , specifically designed for 5-minute charts, featuring a proven back-testing record to ensure reliable performance. Key Features: Blue and Red Lines: The indicator uses two dynamic lines to represent market volatility. Calculation Method: The lines are constructed using the last 14 days' average absolute movement of 5-minute closing prices, multiplied by today's session open price. Indicator Formula: Today's op
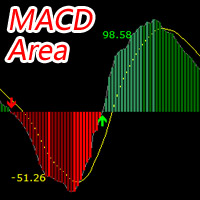
The MACD Area indicator is developed based on the system's built-in MACD indicator to enhance its functionality. The main enhancement is: average algorithm+four-color column+area value. By default, the Exponential Average Algorithm (EMA) is used, and any of the four algorithms can be selected. Algorithm 1: Fundamentals of Simple (SMA arithmetic moving average) SMA, The abbreviation for arithmetic moving average is calculated by adding the closing prices of the last N days, dividing by N, and as

First and foremost, the Insight Flow Indicator stands out as a Non-Repainting, Non-Redrawing, and Non-Lagging tool. This makes it a prime choice for both manual and algorithmic trading, ensuring reliable and consistent signals. User Manual: Settings, Inputs, and Strategy The Insight Flow Indicator leverages price action, strength, and momentum to provide a clear edge in the market. Equipped with advanced filters, it eliminates noise and false signals, enhancing trading potential. By using multip

Based on commonly used ZigZag indicators, in-depth mining was conducted on the indicators, with two main improvements: 1、 Annotate each ZZ price point; Annotate the distance points between adjacent ZZ points for a more convenient and intuitive view of price fluctuations. 2、 Draw a Fibonacci line for the current price direction of ZZ. The Fibonacci line includes two types: the Fibonacci retracement level and the Fibonacci expansion level. When the last four ZZ points comply with Dow's 123 rule,
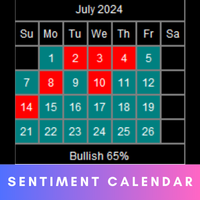
The Market Sentiment calendar provides a visual representation of market sentiment for each day or month. It will display daily and monthly BIAS . The calendar also highlights the percentage of bullish days or months within a given month or year. MT5 version - https://www.mql5.com/en/market/product/120768/ Inputs Frequency: Choose between "Daily" and "Monthly" calendar views. Sentiment Method: Select the method to determine daily or monthly sentiment: " L inear Regression ", " Accumulated Delta

Trend Divergence Indicator: Your Essential Tool for Market Analysis The Trend Divergence Indicator is a powerful tool designed to assist traders in identifying market trends and pinpointing entry points with precision. By leveraging price divergence, this indicator enhances your trading strategy, offering reliable insights and filtering unnecessary signals. Key Features and Benefits of the Trend Divergence Indicator Accurate Trend Analysis: The Trend Divergence Indicator uses price divergence t

This product is based on the methodologies of Gann, his follower Don E. Hall. The Indicator builds a working view grid, which is used to analyze graphics. The Pyrapoint tool, developed by Don Hall, is a grid based on the Pythagorean cube. In his calculations he uses the Gann Square 9 methodology and the relationship between Price and Time. This tool is used to predict changes in trend and overall market actions.
More information about the method HERE
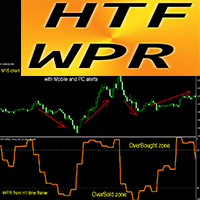
Potente indicador Crypto_Forex Oscilador HTF WPR para MT4.
- Atualize os seus métodos de negociação com o oscilador HTF WPR profissional para MT4. HTF significa - Prazo Superior. - O WPR é um dos principais osciladores para scalping. - Este indicador é excelente para sistemas de negociação Multi-Time Frame com entradas de Price Action das áreas OverSold/Bought. - O indicador HTF WPR permite-lhe anexar o WPR de um período de tempo superior ao seu gráfico atual -> esta é uma abordagem de negocia

The best indicator out there, try it yourself! Please leave your positive comments and reviews!
Settings: AlertConfirmation: truns on and off alerts CalculatedBars: how many bars will be calculated Distance : arrow distance
Buffers: Buffer0 (Arrow Buy) Buffer1 (Arrow Sell) Buffer2 (Empty) Buffer3 (Empty) Buffer4(Buy value == 1) Buffer5(Sell value ==1)

The ICT Immediate Rebalance Toolkit is a comprehensive suite of tools crafted to aid traders in pinpointing crucial trading zones and patterns within the market.
The ICT Immediate Rebalance, although frequently overlooked, emerges as one of ICT's most influential concepts, particularly when considered within a specific context. The toolkit integrates commonly used price action tools to be utilized in conjunction with the Immediate Rebalance patterns, enriching the capacity to discern conte

This is a dashboard indicator that can display daily volatility, making it convenient for traders to quickly view.
The following information can be displayed: Yesterday's high, low, and closing prices. Today's high point, low point, opening price. Dynamically display the number of points up and down from today's opening to the current level. Calculate and display the daily rise and fall points for today, yesterday, 5 days, 10 days, 20 days, 30 days, and 90 days. Current real-time spread. Curren

The Zigzag indicator can help traders identify and confirm the main trends and reversal points in price movements. By connecting significant high and low points, the Zigzag indicator can clearly display the overall trend of the market, helping traders make wiser decisions when analyzing price behavior. Supports any time period. I have added a quick control panel in the bottom left corner for it. When multiple different Bank series indicators are enabled at the same time, the control panel can qu

PinBar is a common candlestick chart form, often used as a reversal signal.
This indicator will be marked with an arrow at the PinBar position after its formation. Supports any time period. At present, this indicator is only calculated and judged based on the upper and lower shadows of the K-line and the values of the entity. In the future, intelligent judgment based on other factors of the market will be added.
I have added a quick control panel in the bottom left corner for it. When multiple

EngulfingPattern is a common candlestick chart form, often used as a reversal signal.
This indicator will be marked with double arrow at the EngulfingPattern position after its formation. Supports any time period. At present, this indicator is only calculated and judged based on the upper and lower shadows of the K-line and the values of the entity. In the future, intelligent judgment based on other factors of the market will be added.
I have added a quick control panel in the bottom left corn

The only indicator i use with MA. Best indicator for me it shows everything you need to know for trading. Many updates will be in the future. If you have any idea what to add to it then comment or write me or if you have any issues please comment or write me , but i didnt found any error in it , everything works perfectly fine. --------------------------------------------------------------------------------------------------------------------------------------------------------------------------
A simple indicator for plotting a tick chart.
This indicator will allow you to track the spread dynamics and the price behavior in general.
In the settings, you can select the price to display on the chart - Bid, Ask or both prices at the same time.
Tick Chart Indicator will definitely be useful when using scalping strategies. The MT5 version is available here . Good luck to everyone and successful trading!

El indicador "MR BEAST ALERTAS DE LIQUIDEZ" es una herramienta avanzada diseñada para proporcionar señales y alertas sobre la liquidez del mercado basándose en una serie de indicadores técnicos y análisis de tendencias. Ideal para traders que buscan oportunidades de trading en función de la dinámica de precios y los niveles de volatilidad, este indicador ofrece una visualización clara y detallada en la ventana del gráfico de MetaTrader. Características Principales: Canal ATR Adaptativo: Calcula

Simple but great indicator to improve your trading. ----------------------------------------------------- Test it as it proves its value with its results.
Settings: AlertConfirmation: turns on and off alerts CalculatedBars: how many bars will be calculated Distance : arrow distance
Buffers: Buffer0 (Arrow Buy) Buffer1 (Arrow Sell) Buffer2 (Buy value 1) Buffer3 (Sell value 1)
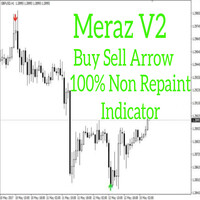
Hello
Alright. This indicator works on MT4 and is very easy to use. When you receive a signal from it, you wait for that candle with the signal to close and you enter your trade at the beginning of the next new candle. A red arrow means sell and a green arrow means buy. All arrows comes with a long dotted like for easy identification of trade signal. Are you okay with that? 100% non repaint Work All Major currency Pair, 1 minute time frame 1 minute expire, 5 minute timeframe 5 minute expire
Supply and Demand Professional is a powerful tool suited for advanced traders! Easily see levels of supply and demand (or support and resistance) as they develop. *This is a NON-repainting indicator* How this can help you?
Levels can be used for stop loss and take profit targets Automatically identifying key levels in the market Spotting market imbalances Better entry levels and timing of trades Volume analysis Understanding market sentiment Predicting price movements Risk management Trend co
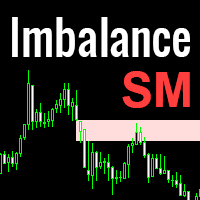
Imbalance is one of the important zones on the chart, to which the price will always strive to cover it. It is from the imbalance zone that the market most often makes significant reversals, rollbacks and gives entry points that you can successfully trade. In the Smart Money concept, the imbalance zone is used to find an entry point, as well as a place for take profit at the level of imbalance overlap by the price. Until the imbalance is overlapped, it is the closest target for the price. Ho
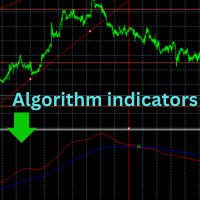
Welcome, thank you for choosing us Read carefully before starting When you turn on the indicator, leave it for about an hour or two. It will automatically collect the data, and then its shape will be complete and it will start balancing the new data. We offer you the latest indicators that will help you make decisions after creating your own technical analysis
You will see the entry point that you will use to get a good deal
At each intersection there is an opportunity for a deal that the ind
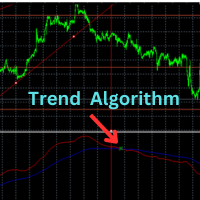
Welcome, thank you for choosing us
Read carefully before starting
If you want to trade on a demo account, put the indicator there. If you want to trade on a real account, put the indicator there and wait about two hours for the data to be collected again. The data differs between the demo and real accounts in several factors. We offer you the latest indicators that will help you make decisions after creating your own technical analysis
You will see the entry point that you will use to get a

This indicator is collection of important dynamic support and resistance giving a trader crystal clear idea , where to sell and where to buy. it completely complements trend lines, support, resistance, and sideways market and allow a trader to make sustainable profits. The thickness of lines suggests its strengths, the thicker the dynamic line, the stronger is rejection or pullback allowing a trader to make multi-fold profit, as they can clearly see them.
Introducing Your Ultimate Trading Edge:

This powerful and insightful indicator is based on a leading version of the EURUSD proxy trade, such that the day's underlying direction can be inferred through the intraday volatility and market noise.
Predicting the day's overall trend.
Market price action is deceptive, misleading, no one has ever profitted consistently by just following latest price action. This also fools single market and momentum based indicators, since the main data used is market price.
Intermarket analysis on the ot

This indicator works on MT4 and is very easy to use. When you receive a signal from it, you wait for that candle with the signal to close and you enter your trade at the beginning of the next new candle . A red arrow means sell and a green arrow means buy. All arrows comes with Alert like for easy identification of trade signal. Are you okay with that?
1 minute candle
1 minute expire
O indicador Follow Line é uma ferramenta essencial para traders que desejam identificar e seguir as tendências do mercado com precisão. Este indicador adapta-se dinamicamente às variações de preço, desenhando uma linha que acompanha o movimento dos preços de forma fluida e contínua. Graças à sua simplicidade visual e à eficácia em sinalizar mudanças de tendência, o Follow Line é uma excelente adição à estratégia de qualquer trader. Principais Características: Rastreamento de Tendências: O Follow
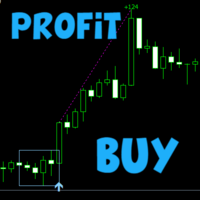
Scalper Box MT4
Fully ready strategy for trading on all markets (Stocks, Futures, Forex and Cryptocurrencies).
Indicator signals are not repaint!!!
How to trade?
Wait for a signal from the indicator Scalper Box MT4 (blue arrow - buy, red arrow - sell).
After the signal we immediately enter the market, SL set behind the formed box.
Using trend filter indicator and template
Recommended timeframe:
M5 - Ideal for Scalping.
M15 - Suitable for Daytrading.
H1 - Suitable for Swing Trading.
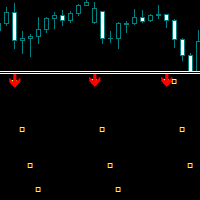
Um indicador técnico concebido especificamente para o scalping que pode identificar impulsos de volatilidade e mostrar a sua duração.
Possui parâmetros flexíveis para configurações manuais, permitindo aplicar a funcionalidade do indicador a qualquer instrumento de negociação.
Os prazos recomendados para utilização são M5, M15, M30, H1 e H4.
Existem vários tipos de alertas.
Todos os sinais nunca mudam ou mudam de cor no fecho da vela.
O indicador é configurado por parâmetros de cima para baixo.

Trend Cutter é um indicador de tendência que pode ser usado em qualquer período de tempo, incluindo períodos mais baixos, como M1 e M5. O indicador é ideal para traders que preferem negociações intradiárias e também será útil para aqueles que preferem negociações de longo prazo. Você pode usar este indicador como base para o seu sistema de negociação ou como uma solução de negociação independente. O indicador fornece todos os tipos de alertas, incluindo notificações PUSH. O indicador é muito fác

O indicador "Candle Info" para MetaTrader 4 (MT4) ajuda os traders a analisar e visualizar formações de velas diretamente no gráfico. Ao detectar formações como Máxima mais Alta (HH), Mínima mais Baixa (LL), Mínima mais Alta (HL) e Máxima mais Baixa (LH), ele oferece insights sobre tendências de mercado e possíveis movimentos de preços.
Funções principais:
- **Formações de Velas:** Identifica e rotula HH, LL, HL, LH e combinações como HH & HL (tendência de alta) e LL & LH (tendência de ba

Adjustable Consecutive Fractals looks for 2 or more fractals in one direction and sends out a on screen alert, sound alert and push notification, for strong reversal points .
Adjustable Consecutive Fractals, shows the fractals on chart along with a color changing text for buy and sell signals when one or more fractals appear on one side of price.
Adjustable Consecutive Fractals is based Bill Williams Fractals . The standard Bill Williams fractals are set at a non adjustable 5 bars, BUT withe th

The Binary Profit Maker,
This indicator works on MT4 and is very easy to use. When you receive a signal from it, you wait for that candle with the signal to close and you enter your trade at the beginning of the next new candle . A Up Purple arrow means Buy and a Down Purple arrow means Sell. All arrows comes with Alert like for easy identification of trade signal. Are you okay with that?
How To Enter Trade?
1 minute candle
1 minute expire
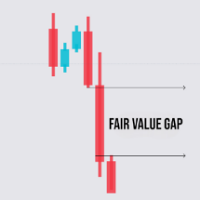
FVG Analyzer é um indicador personalizado para o MetaTrader 4, projetado para identificar e destacar lacunas de valor justo (Fair Value Gaps, FVG) nos gráficos de preços. Esta ferramenta ajuda os traders a detectar áreas onde ocorreram lacunas de preço, oferecendo suporte para potenciais oportunidades de negociação baseadas nesses gaps. Principais Características: Detecção de FVG : FVG Bullish : Identifica lacunas de alta onde o preço máximo da vela seguinte é inferior ao preço mínimo da vela an

This indicator/dashboard , is place on a single symbol. It shows the percentage of movement withing all time frames from M1 to W1.The text will change green if all % are in the positive for a buy signal.The text will change red if all % are below zero and in negative for a sell signal. There are audible notifications, as well as on screen notifications along with push notifications that can be turned on and ON/OFF in the settings.
This is a sure way to Find trends quickly and efficiently, with
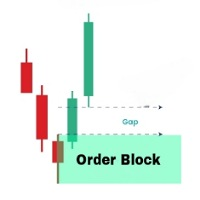
OrderBlock Analyzer é um indicador personalizado para MetaTrader 4 (MT4) projetado para detectar e destacar Blocos de Ordens (Order Blocks) nos gráficos de preços. Este indicador auxilia os traders na identificação de estruturas-chave do mercado, sinalizando possíveis áreas de reversão ou continuação. Baseado no comportamento do mercado, o OrderBlock Analyzer desenha automaticamente os blocos de ordens e distingue blocos de alta e baixa com cores diferentes. Principais características: Detecção
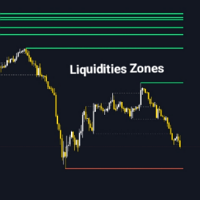
O Liquidity Zone Detector é um indicador técnico avançado projetado para identificar e destacar zonas chave de liquidez no mercado utilizando o indicador ZigZag. Esta ferramenta localiza níveis de preços onde é provável que haja liquidez significativa, traçando linhas de tendência nos altos e baixos detectados pelo ZigZag. O Liquidity Zone Detector ajuda os traders a identificar áreas potenciais de reversão ou continuação de tendência com base na acumulação ou liberação de liquidez. Principais c
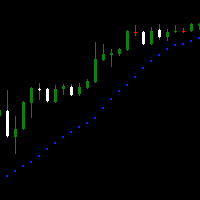
Доброго времени суток.
Вашему вниманию простой, но крайне удобный продукт для любителей индикатора Parabolic SAR . Он представляет собой окно осциллятора, на который выводится несколько тайм-фреймов в режими реального времени вместе с индикатором.
Настройки интуитивно понятные, что бы включать и отключать количество выбранных таймов - необходимо применять PERIOD_CURRENT, в таком случае дополнительный тайм не откроется.
Пишите в комментариях к продукту, что бы вы хотели увидеть в новых версия
O que é "Real Time MultiIndicator"? "Real Time MultiIndicator" é uma ferramenta de negociação avançada projetada para simplificar e otimizar sua análise técnica. Este indicador revolucionário reúne sinais de múltiplos timeframes e indicadores técnicos, exibindo-os em uma única tabela clara e fácil de ler. Se você deseja uma visão completa e detalhada do mercado sem precisar mudar constantemente de gráfico ou analisar manualmente cada indicador, "Real Time MultiIndicator" é a solução perfeita par
MACD Indicator The Moving Average Convergence and Divergence (MACD) is a trend following momentum indicator which shows the relationship between two moving averages that we chose and configure them on the indicator. The MACD is calculated by subtracting the 26-period exponential moving average and the 12 period D.A.M. These are the default parameters when you put the MACD indicator on the charts, and the period is usually 9 which means the last 9 candles. DT-Oscillator This is Robert C. Miner's

he "Super Trampoline" is an innovative trading indicator designed to simplify decision-making in financial markets. It analyzes chart data and provides clear and timely signals on when to buy or sell an asset, based on a proven strategy of candlestick pattern analysis. Product Advantages: Intuitive Interface : "Super Trampoline" integrates directly into your trading terminal, displaying signals as simple arrows on the chart. This means you don't need deep technical analysis knowledge to start us

Introducing "Super Transplant with Filter" — a game-changing tool for traders who value precision, reliability, and simplicity. This indicator combines advanced trend analysis techniques with intelligent signal filtering, allowing you to make decisions based on the most relevant data. Benefits of "Super Transplant with Filter": Accuracy in Every Trade : The indicator meticulously analyzes market data, identifying key trends while filtering out false signals. This enables you to make more informe
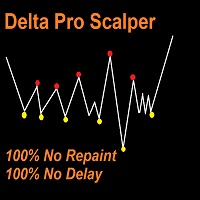
Delta Pro Scalper - Your Ultimate Trend Trading Solution, Delta Pro Scalper is a TREND indicator that automatically analyzes the market and provides information about the trend without redrawing or delay.
The indicator uses candlestick OHLC data and analyzing them to determine up trend or down trend, You MUST wait till closing candle, once the dot appear the next open candle you can open buy or sell position.
Red Dot = Bearish Trend (Open SELL)
Yellow Dot = Bullish Trend (Open BUY)
Here's the f
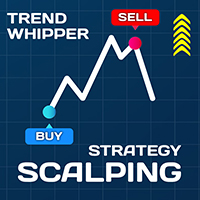
Trend detection is one of the basic challenges of every trader. Finding a way to tell when to enter a trade is very important, timing is a game changer, not too early and not too late. Sometimes, due to not knowing the market conditions, the trader closes his positions with a small profit or allows the losses to grow, these are the mistakes that novice traders make. Indicator Trend Whipper is a complete trading strategy and can improve the trader's trading process. The trend detection algorithm
Scalping Strategy BUY SELL
Having a strategy in the market is one of the main conditions for trading. The presence of various and complicated indicators and tools sometimes makes trading difficult, and the user gets confused after trying various methods and gets stuck in a loss cycle, the result of which is usually clear. This indicator is a simple strategy based on the detection of pivots and short-term trends, which helps you to easily trade in trends. Sometimes a simple but efficient str

TitanVision indicator is a versatile technical analysis tool that helps traders identify market trends and potential entry and exit points. It features a dynamic Trend Catcher Strategy, adapting to market conditions for a clear visual representation of trend direction and various trend reversal points. Traders can customize the parameters according to their preferences. The indicator helps in identifying trends, signals possible reversals, acts as a trailing stop mechanism and provides real-tim
O Mercado MetaTrader é o melhor lugar para vender robôs de negociação e indicadores técnicos.
Você apenas precisa desenvolver um aplicativo para a plataforma MetaTrader com um design atraente e uma boa descrição. Nós vamos explicar como publicar o seu produto no Mercado e oferecer a milhões de usuários MetaTrader.
Você está perdendo oportunidades de negociação:
- Aplicativos de negociação gratuitos
- 8 000+ sinais para cópia
- Notícias econômicas para análise dos mercados financeiros
Registro
Login
Se você não tem uma conta, por favor registre-se
Para login e uso do site MQL5.com, você deve ativar o uso de cookies.
Ative esta opção no seu navegador, caso contrário você não poderá fazer login.