Regardez les tutoriels vidéo de Market sur YouTube
Comment acheter un robot de trading ou un indicateur
Exécutez votre EA sur
hébergement virtuel
hébergement virtuel
Test un indicateur/robot de trading avant d'acheter
Vous voulez gagner de l'argent sur Market ?
Comment présenter un produit pour qu'il se vende bien
Indicateurs techniques pour MetaTrader 4 - 138
This scanner is for showing Cross of various TDI elements: PriceLine, Trade Signal Line and Market Base Line And for getting alerts, so you can be prepared for finding good trade setups before they happen. It also shows TDI signals, trend, volatility and different timeframe alignment.
Detailed blog post:
https://www.mql5.com/en/blogs/post/759050
Features: Show TDI Signal and Trend Show Volatility & Overbought/Oversold Show cross between: PriceLine & TSL PriceLine & MBL MBL & TSL PriceLine
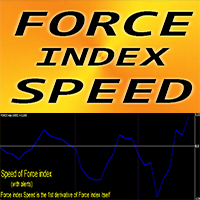
Forex Indicator " Force index Speed" for MT4 The calculation of this indicator is based on equations from physics. Force index Speed is the 1st derivative of Force index itself F orce index is one of the top indicators that combines price and volume data into a single value Force index Speed is good for scalping entries into the direction of main trend: u se it in combination with any suitable trend indicator Force index Speed indicator shows how fast Force index itself changes its d
Welcome to the Stochastic Multicurrency Scanner, your gateway to smarter and more efficient trading. This advanced MT4 indicator is designed to scan multiple currencies effortlessly and provide real-time insights to enhance your trading experience. Key Features: Effortless Multicurrency Scanning
Monitor multiple currency pairs simultaneously with ease. Receive instant alerts when key stochastic conditions are met, allowing you to capitalize on emerging trading opportunities.
Comprehensive Da

The indicator is a simple bar oscillator with green and red bars
The calculation of the bars are Rsi based
The values of the bars does not recalculate after bar has closed
Higher green bars shows possible bullish momentum and vice versa
The indicator has no settings or alerts
The colors can be adjusted as preferred but the bar width should remain on default
Suitable for any timeframe or instrument
Test in demo before purchase
Enjoy ----------------------------------------------
This indicator managge all kind of ICT FVG include: FVG, SIBI, BISI, Inverse FVG. The advantage point of this indicator is mangage FVG on all timeframe. FVG - Fair value gap ICT Fair value gap is found in a “three candles formation” in such a way that the middle candle is a big candlestick with most body range and the candles above & below that candle are short and don’t completely overlap the body of middle candle. * This indicator allow filter FVG by ATR. So you can just show valid FVG which

The Real Cloud indicator for MT4 is a popular and useful Forex indicator. This indicator provides traders with an easy way to identify potential trading opportunities in the Forex market. The Real Cloud indicator uses a unique algorithm to analyze price action and generate signals. It is designed to identify strong trends and provide traders with an edge in their trading. The Real Cloud indicator is easy to use and requires no additional setup. Simply attach the indicator to your chart and it wi
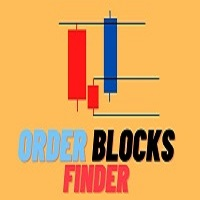
Индикатор Order blocks Mtf строит уровни на основе smart mony(умные деньги) Строит уровни как сразу получил излом тренда, индикатор очень удобен и практичен для использование на форекс и на бинарных опционов В него в шита система поиска сигналов на касании старших уровней таким же уровней излома тренда и ретеста к среднему значению При касании уровня очень хорошо отрабатывает на бинарных опционах,
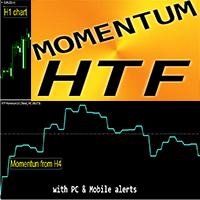
Forex Indicator "HTF Momentum" for MT4 HTF Momentum is one of the leading indicators that measure the rate of price change . H TF means - H igher Time Frame This indicator shows the trend direction and measures the pace of the price change via comparing current and past values HTF Momentum indicator is excellent for Multi-Time Frame trading systems with Scalping entries or in combination with other indicators. This Indicator allows you to attach Momentum from Higher time fr
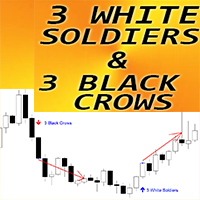
Forex Indicator " 3 White Soldiers & 3 Black Crows patterns" for MT4 Indicator "3 White Soldiers & 3 Black Crows" is very powerful for Price Action trading: No repaint, No delays; Indicator detects 3 White Soldiers and 3 Black Crows patterns on chart: Bullish 3 White Soldiers pattern - Blue arrow signal on chart (see pictures) Bearish 3 Black Crows pattern - Red arrow signal on chart (see pictures) P C, Mobile & Email alerts are included Indicator " 3 White Soldiers & 3 Black Crow
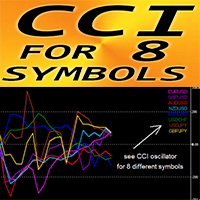
Forex Indicator "CCI for 8 Symbols" for MT4. CCI is one of the most popular oscillators for trading Commodity Channel Index (CCI) measures the difference between the current price and the historical average price. Important levels: +/-200; It is great to take Sell entries from above +200 zone and Buy entries from below -200 "CCI for 8 Symbols" gives opportunity to control CCI values of up to 8 different symbols just on 1 chart
This indicator is excellent to combine with Price Action entri
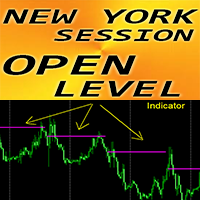
Forex Indicator "New York Session Open Level" for MT4 Indicator "New York Session Open Level" is very useful auxiliary indicator for intraday trading Session open price level is so important because very often price returns back to that area during the day. Indicator shows you NY session open price level daily for each day Also indicator shows week open level on Mondays It is useful for intraday traders to set up targets or use as support/resistance area. // More great Expert Advisors and In
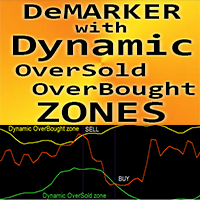
Forex Indicator "DeMarker with Dynamic OverSold/OverBought zones" for MT4. DeMarker oscillator curve indicates the current price position relative to previous highs and lows during the indicator calculation period It is great to take Sell entries from dynamic OverBought zone and Buy entries from dynamic OverSold zone T his indicator is excellent to combine with Price Action entries as well . . D ynamic OverBought zone - above yellow line
Dynamic OverSold zone - below green l
Ephraim Umpan Gold Coins Magnet Indicator is an Indicator that helps traders do the decisions. With this Indicator, Every trader will now have an edge in trading and will be more profitable in their trades. Accordingly, this indicator can help increased the winning capability of every trader. Would you like to try of this indicator? Now is your chance to do so.
L'indicateur Ephraim Umpan est un excellent indicateur pour les traders Forex qui souhaitent faire du trading manuel. Avec cet indicateur, chaque trader bénéficiera d'un avantage sur son trading et obtiendra des résultats excellents et stables. Cet indicateur ne témoigne pas seulement de la façon dont nous pouvons apprendre du marché. De plus, cet indicateur est un excellent outil. Utilisons cet outil afin de générer d'importants revenus sur le marché Forex.

To access the TD sequential Scanner for MT5, please check https://www.mql5.com/en/market/product/123369?source=Site +Market+My+Products+Page. One of the MT5 versions includes additional timeframes such as M1, M2, M3,H2,H6,H8 and so on.( https://www.mql5.com/en/market/product/123367?source=Site +Market+My+Products+Page) TD Sequential Scanner: An Overview The TD Sequential scanner is a powerful technical analysis tool designed to identify potential price exhaustion points and trend reversals in fi
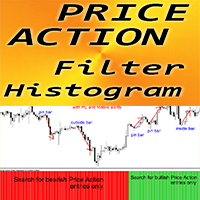
Price Action Filter Histogram - is an efficient auxiliary trading tool for Price Action trading! This indicator suggests to trader the direction of entries. Then trader just need to search for Price Action signals in that direction. Price Action Filter Histogram should be combined with Price Action patterns and support/resistance levels Green color histogram - Look for Bullish entries Red color histogram - Look for Bearish entries There are plenty of opportunities to upgrade eve

The Great Oracle is a powerful trend-following indicator designed for traders who seek precision in their entries and exits. Whether you’re navigating trending markets or spotting opportunities in ranging conditions, The Great Oracle provides you with accurate signals and a second chance to join strong market trends. It’s the ultimate tool for traders who want to maximize profits while keeping risks manageable. Key Features: • Can be used for any asset: Metal (Gold), Cryptocurrency (Bitcoin), Cu
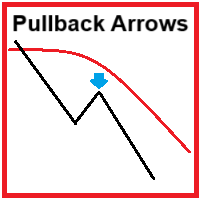
The indicator provides buy and sell arrows with a moving average
The arrows are based on a reversal algorithm - Different than my other indicator MA with Arrows that is continuation based
Only buy arrows are shown above the moving average and only sell arrows are shown below the moving average - Where the candle closes
The arrows are non repaint
Alerts can be activated as preferred
Suitable to any timeframe or instrument of choice
Please test in demo before purchase
Available to
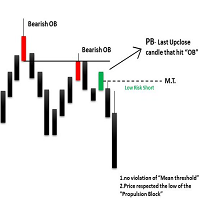
The ICT Propulsion Block indicator is meant to detect and highlight propulsion blocks, which are specific price structures introduced by the Inner Circle Trader (ICT). Note: THIS IS MTF version. Single Timeframe version avaiable at here
Propulsion Blocks are essentially blocks located where prices interact with preceding order blocks. Traders often utilize them when analyzing price movements to identify potential turning points and market behavior or areas of interest in the market.
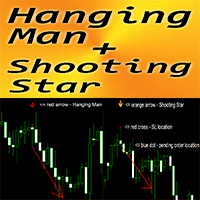
Forex Indicator " Hanging Man and Shooting Star pattern" for MT4 Indicator " Hanging Man and Shooting Star pattern " is very powerful indicator for Price Action trading: No repaint, No delays; Indicator detects bearish Hanging Man and Shooting Star patterns on chart: Bearish Hanging Man - Red arrow signal on chart (see pictures) Bearish Shooting Star - Orange arrow signal on chart (see pictures) P C, Mobile & Email alerts are included Indicator " Hanging Man and Shooting Star" is
Customisable Timelines Indicator for MT4
Transform your technical analysis with our Customisable Timelines Indicator for MT4! This powerful indicator allows you to mark specific moments on the chart by plotting vertical lines at times set by you. Ideal for highlighting market openings, important economic events, or any other crucial moment for your trading strategies.
Main features:
Flexible Configuration: Adjust the schedules of the vertical lines as per your need. Clear Viewing: Coloure

Features:
Sharkfin Alerts Multi-timeframe Multi-currency SM TDI: To show TDI lines with sharkfin levels Zigzag MTF: To see Higher Timeframe trend Detailed blog post and extras: https://www.mql5.com/en/blogs/post/759138
Arrows works on a single timeframe and single currency. But it’s visually helps see that sharkfins. You can also get the simple arrows from mql5 site product: https://www.mql5.com/en/market/product/42405
About Scanner: It is an easy to use simplified scanner. It will show w

Filter out small price movements and focus on the larger trend . Renko chart indicator will help you to filter out a minor price movements so that you can focus on the overall trend. The price must move a specified amount to create a Renko brick. This makes it easy to spot the current trend direction in which the price is moving. My #1 Utility : includes 65+ features | Contact me if you have any questions | MT5 version In the settings of the indicator, you can configure: Calculation Se
** NOTE: This indicator uses realtime data. Thus DO NOT download Demo version. If you still need demo version, please refer to free version .
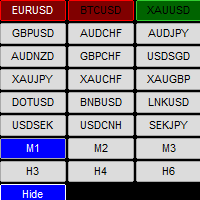
Symbol Chart Changer is an indicator/utility that offers you the option to switch between symbols and timeframes.
You can choose any symbol and timeframe on the same chart with just a few clicks. In addition, this indicator also shows the profit of the symbol through the color of the buttons.
Features: Click buttons on the chart to monito

Detailed blog post with extras downloads: https://www.mql5.com/en/blogs/post/759154
About: Price ranges most of the time in forex… Like 70-80% of the time. And then it breaks out of the range to continue in a trend. Even in a trend, price makes smaller ranges all the time. Range Breaker Scalper is a tool to find the times when price breaks out of a range. A sudden break means that price will continue on for next few bars towards the breakout. So, these areas are best for scalping. Especially i
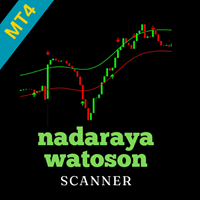
Nadaraya Watson Envelop Scanner for MetaTrader 4 Overview
The Nadaraya Watson Envelop Scanner for MT4 is a powerful multi-symbol and multi-timeframe tool that extends the functionality of the Nadaraya Watson Envelop indicator. By scanning across multiple symbols and timeframes, this scanner allows traders to detect key signals and trend reversals efficiently within the MT4 environment. Key Features Multi-Symbol & Multi-Timeframe Scanning : Automatically scans various symbols and timeframes to
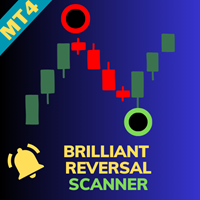
Welcome to the Brilliant Reversal Multicurrency Scanner , an advanced tool designed to enhance your trading with precise reversal detection and real-time insights. This MT4 indicator is built to scan multiple currency pairs simultaneously, helping you capture market reversals more efficiently. Key Features: Effortless Multicurrency Scanning
Monitor numerous currency pairs in real-time and receive instant alerts when key reversal signals are detected. This allows you to act swiftly on emerging
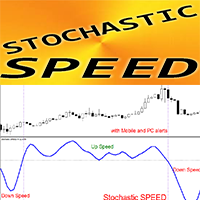
Forex Indicator "Stochastic Speed" for MT4 - great predictive tool! The calculation of this indicator is based on equations from physics . Stochastic Speed is the 1st derivative of Stochastic itself Stochastic Speed is great for scalping entries when stochastic is in Oversold/Overbought zone and Speed is making rebound hook (see pictures) It is recommended to use S tochastic Speed indicator for momentum trading strategies:
If S tochastic Speed is above 0 - this is positive sp
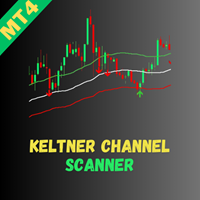
Welcome to the Keltner Channel Multicurrency Scanner , an advanced tool designed to enhance your trading by detecting Keltner Channel breakouts and real-time insights. This MT4 indicator is built to scan multiple currency pairs simultaneously, helping you capitalize on market trends more effectively. Key Features: Effortless Multicurrency Scanning
Monitor multiple currency pairs in real-time and receive instant alerts when key Keltner Channel breakout signals are detected. This allows you to r

Statistical Trend Indicator is an advanced custom indicator designed to analyze market movements and provide traders with calculated probabilities of upward or downward trends. By analyzing historical price data over a specified lookback period, this indicator computes the likelihood of the market continuing in either direction, offering traders a statistical edge in decision-making.
Key Features: Probability Display: It calculates and displays the percentage probabilities of an upward or dow
A fair assessment, reviews and comments are the best gratitude to the author of this product for the work done. I would be glad to receive any constructive suggestions and comments.
The presented indicator is the author's implementation of the classic Fractals indicator.
Fractals are a technical indicator developed by Bill Williams , allowing you to determine a trough or a peak on the chart of the financial instrument in question. A fractal consists of candles, the middle of which is either
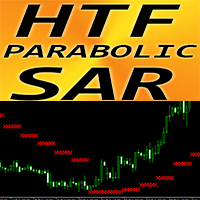
Forex Indicator Parabolic SAR Higher Time Frame for MT4 Upgrade your trading methods with great auxiliary HTF PSAR indicator for MT4. H TF means - H igher Time Frame PSAR is used to determine trend direction and potential reversals in price movement. This indicator is great to use for Trailing Stop purpose If PSAR is located above the price - it is downward trend If PSAR is located below the price - it is upward trend This indicator is excellent to combine with price action entrie
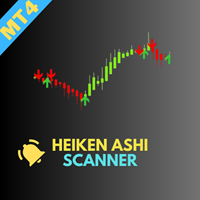
Welcome to the Heiken Ashi Multicurrency Scanner , an advanced tool designed to help traders efficiently monitor market trends using the Heiken Ashi indicator. This MT4 scanner allows you to scan multiple currency pairs simultaneously, enabling quick identification of market trends and reversal opportunities. Key Features: Effortless Multicurrency Scanning
Track numerous currency pairs in real-time and receive instant alerts when significant Heiken Ashi signals are detected. Stay ahead of mark

Attention, for the indicator to work correctly, you need to put the "MQL5" folder in your terminal folder, you can download it from the link below: https://disk.yandex.ru/d/DPyo0ntaevi_2A
One of the best arrow indicators for Binary Options, which can also be used in the Forex market. Any time frame from M1 to MN, any currency pair, can also be used on stocks - the indicator is universal. Expiration from 1 to 5 candles. Displays traffic statistics on a graph. The indicator gives signals along t
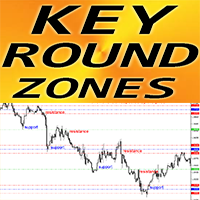
Forex Indicator "Key Round Zones" for MT4 Indicator "Key Round Zones" is must have auxiliary indicator for traders who take support/resistance into consideration 1000 and 500 round levels are respected by the price - price rebounds from them very often Major 1000 levels also have strong Support/Resistance zones (100 points in each side) around it Also 1 000 and 500 round levels are good to place Take Profits (in front of round level) and SL (behind the round level) These levels are part

STOP LOOKING! Here's Your Chance at Trading Mastery! I've been EXACTLY where you are - spending thousands on trading indicators that promised the world but delivered nothing but headaches. Every single one was a total dud. Frustrated and desperate, I took matters into my own hands and developed the ultimate trading indicator that's CRAZY EASY to use and HIGHLY RELIABLE! So, let me introduce you to your new best trading tool! Here's how it works: GREEN means BUY, RED means SELL.
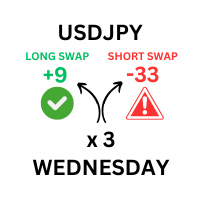
Cet outil est conçu pour afficher les taux de swap détaillés pour toutes les paires de devises disponibles sur votre plateforme de trading.
Il permet aux traders de visualiser rapidement les valeurs des swaps longs et courts dans une fenêtre distincte et visuellement améliorée.
Cet outil propose des entrées définies par l'utilisateur pour la taille du lot, garantissant des calculs précis basés sur les taux de swap et le volume des transactions actuels.
De plus, il indique le moment où les

Dynamic Cycle Indicator pour MetaTrader 5 – Votre Avantage dans le Trading Cyclique ! Le Dynamic Cycle Indicator est l’outil ultime pour identifier avec précision les cycles de marché et optimiser vos stratégies de trading sur MetaTrader 5 . Basé sur des algorithmes avancés d'analyse cyclique, cet indicateur vous offre un avantage incomparable pour détecter les points d'inversion et prévoir les mouvements futurs des prix. Qu'est-ce qui rend le Dynamic Cycle Indicator unique ? Identification Par

Trend StarteR est un indicateur multi-basé sur RSI qui donne des signaux de tendance haussière et baissière sous forme de flèches. L'indicateur a été conçu pour prédire une tendance possible et aider les traders à participer au trading de ces tendances. Cet indicateur ne repeint pas la peinture du minerai, ce signal indicateur ne tarde pas. ================= Recommandations : courtier à faible spread, sur n'importe quelle période, mais mieux vaut s'en tenir à M5 et au-dessus pour battre le spre

Unlock the Secrets of Successful Trading with AI TREND SENTIMENT! Welcome to the world of smarter trading! Discover the AI TREND SENTIMENT Indicator, a tool that has been a game-changer in my trading journey and could be for you too! The Histograms of this Indicator are SUPER IMPORTANT in trading, and here's why you'll LOVE them: Instant Insight: Understand price cycles like a pro! WHOA! It's that simple. Decision Time: Cross points show EXACTLY where you need to make a move – N
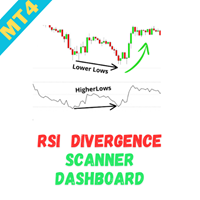
Welcome to the RSI Divergence Multicurrency Scanner Dashboard , an advanced tool designed to help traders efficiently detect RSI divergence patterns across multiple currency pairs. This scanner enables quick identification of potential reversal opportunities, giving you an edge in your trading strategy. Key Features: Effortless Multicurrency Scanning
Monitor multiple currency pairs in real-time and receive instant alerts when significant RSI divergence patterns are detected. This allows you to
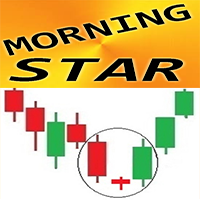
Forex Indicator " Morning Star pattern" for MT4 Indicator "Morning Star pattern" is a very powerful indicator for Price Action trading: No repaint, No delays; Indicator detects bullish Morning Star patterns on chart: Blue arrow signal on chart (see pictures) P C, Mobile & Email alerts are included Also its brother - bearish " Evening Star pattern" indicator is available (follow the links below) Indicator " Morning Star pattern" is excellent to combine with Support/Resistance Leve
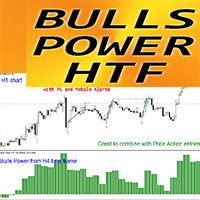
Forex Indicator Bulls Power HTF for MT4 Bulls Power HTF oscillator is perfect filter for "buy" entries . H TF means - H igher Time Frame Bulls and Bears Power indicators are used in trading to measure the strength of corresponding trends in trading Bulls Power measures the strength of buyers' position.
Bulls Power HTF indicator is excellent for Multi-Time Frame trading systems with Price Action entries or in combination with other indicators. This Indicator allows you to
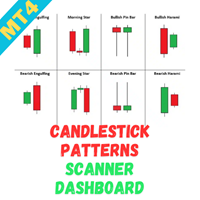
Welcome to the Candlestick Pattern Multicurrency Scanner Dashboard , a powerful tool designed to help traders identify key candlestick reversal patterns across multiple currency pairs. This scanner is equipped to detect a wide variety of candlestick formations, allowing for timely identification of market turning points and enhancing your trading strategy. Key Features: Effortless Multicurrency Scanning
Monitor numerous currency pairs in real-time and receive instant alerts when significant ca
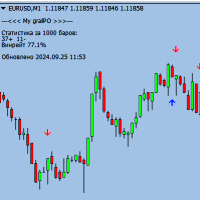
Attention, for the indicator to work correctly, you need to put the "MQL5" folder in your terminal folder, you can download it from the link below: https://disk.yandex.ru/d/DPyo0ntaevi_2A
Binary Scalper 7 is a powerful tool designed to identify and predict the next candle, allowing traders to make informed decisions when trading binary options. This indicator works on any time frame and with any expiration, making it a versatile and reliable tool for traders of all levels.
How it works:

Forex Indicator " Evening Star pattern" for MT4 Indicator "Evening Star pattern" is very powerful indicator for Price Action trading: No repaint, No delays; Indicator detects bearish Evening Star patterns on chart: Red arrow signal on chart (see pictures) P C, Mobile & Email alerts are included Also its brother - bullish " Morning Star pattern" indicator is available (follow the links below) Indicator " Evening Star pattern" is excellent to combine with Support/Resistan
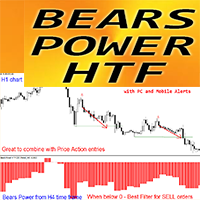
Forex Indicator Bears Power HTF for MT4 Bears Power HTF oscillator is perfect filter for "sell" entries . H TF means - H igher Time Frame Bulls and Bears Power indicators are used in trading to measure the strength of corresponding trends in trading Bears Power measures the strength of sellers' position Bears Power HTF indicator is excellent for Multi-Time Frame trading systems with Price Action entries or in combination with other indicators. This Indicator allows you to

Indicateur Forex Scalper – Votre Outil de Précision pour Gagner sur les Marchés Financiers
L'Indicateur Forex Scalper pour MT4 est l'allié parfait pour tous les traders souhaitant scalper les marchés avec une précision maximale. Grâce à son analyse basée sur des données précises, cet indicateur vous offre des signaux opportuns et précis, idéaux pour prendre des décisions rapides dans vos trades.
Précision Sur Mesure Chaque flèche affichée sur les graphiques est basée sur des calculs méticule
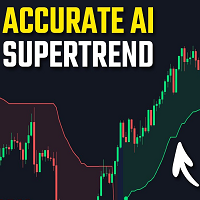
Machine Learning Adaptive SuperTrend - Take Your Trading to the Next Level!
Introducing the Machine Learning Adaptive SuperTrend , an advanced trading indicator designed to adapt to market volatility dynamically using machine learning techniques. This indicator employs k-means clustering to categorize market volatility into high, medium, and low levels, enhancing the traditional SuperTrend strategy. Perfect for traders who want an edge in identifying trend shifts and market condit

Vondereich MTF Strength Indicator Description: Overview: The Vondereich MTF Strength Indicator is a powerful yet user-friendly multi-timeframe analysis tool designed to simplify market insights for traders of all experience levels. By evaluating currency pairs across various timeframes using a combination of technical indicators such as the Stochastic Oscillator, Relative Strength Index (RSI), Exponential Moving Average (EMA), and Average True Range (ATR), this indicator delivers clear buy, sell

Scopri l'Indicatore Avanzato di Zone di Offerta e Domanda Sei pronto a portare il tuo trading al livello successivo? L'indicatore "Advanced Supply and Demand Zone" è lo strumento definitivo per identificare con precisione le zone chiave di supporto e resistenza sul mercato, permettendoti di prendere decisioni informate e tempestive. Come Funziona Questo indicatore innovativo analizza il mercato utilizzando frattali veloci e lenti per individuare i punti di inversione del prezzo. Si basa sui prin

Trend Oscillator - is an advanced custom indicator, efficient trading tool! Advanced new calculation method is used - 20 options for parameter "Price for calculation" Smoothest oscillator ever developed Green color for upward trends, Red color for downward trends Oversold values: below 5 ; O verbought values: over 95 There are plenty of opportunities to upgrade even standard strategies with this indicator with PC and Mobile alerts // More great Expert Advisors and Indicators are available
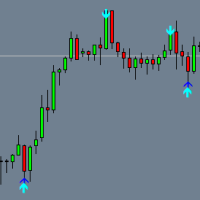
Binary DUNKS - binary options indicator Attention, for the indicator to work correctly, you need to put the "MQL5" folder in your terminal folder, you can download it from the link below: https://disk.yandex.ru/d/DPyo0ntaevi_2A
-Displays the direction of the next candle on the chart in the form of buffer arrows
-Expiration 1 candle
-The indicator works great on any timeframe and currency pair, it also shows itself well on stocks and metals
-The signal appears before the closing of the p
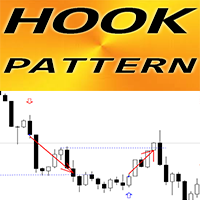
Forex Indicator " Hook pattern" for MT4 Indicator " Hook pattern " is very powerful indicator for Price Action trading : No repaint, No delays; Indicator detects bullish and bearish Hook patterns on chart: Bullish Hook - Blue arrow signal on chart (see pictures) Bearish Hook - Red arrow signal on chart (see pictures) P C, Mobile & Email alerts are included Indicator " Hook pattern" is good to combine with Support/Resistance Levels // More great Expert Advisors and Ind
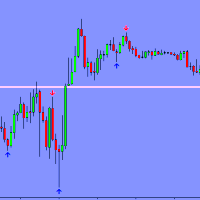
Le cratère binaire est un indicateur puissant et polyvalent pour MetaTrader 4, conçu spécifiquement pour le trading d'options binaires. Il fonctionne efficacement sur n'importe quelle période et avec n'importe quelle paire de devises, ce qui en fait un outil extrêmement flexible pour les traders.
Principales caractéristiques :
Analyse des tendances : l'indicateur détermine automatiquement la tendance actuelle du marché, ce qui aide les traders à effectuer des transactions dans le sens de la
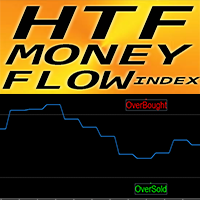
Forex Indicator HTF MFI Oscillator for MT4 Money Flow Index (MFI) is a technical oscillator which uses price and volume data for identifying oversold and o verbought zones HTF means - H igher Time Frame. Overbought when the MFI is above 80 and oversold when it is below 2 0 MFI is great to combine with price Action. It provides information regarding bullish and bearish price momentum
This indicator is excellent for Multi-Time Frame trading systems in combination wi

Unlock the Power of Multi-Market Insights with Our Cutting-Edge Dashboard Indicator
Are you tired of juggling multiple charts and indicators just to stay on top of the markets? Introducing the "RSI & EMA Cross Dashboard" - a revolutionary trading tool that consolidates critical signals across your favorite currency pairs and timeframes into a single, easy-to-read display.
Meticulously coded by our team of seasoned developers, this indicator harnesses the power of RSI and EMA crossover analy

This dashboard shows you the 3MA Cross Overs current status for Multi-currency multi-timeframes. Works for Metatrader 4 (MT4) platform. Detailed Post:
https://www.mql5.com/en/blogs/post/759238
How it Works:
MA Cross Signals It will show “S” Green/Red Strong Signals and “M” or “W” Green/Red Medium or Weak signals. We have 3 types of MA: Faster, Medium and Slower MA. A strong signal is when FasterMA and MediumMA are both above/below SlowerMA. A medium signal is when only FasterMA is above/be
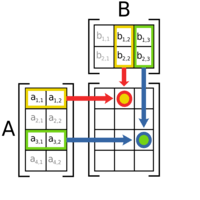
MT5 Version: https://www.mql5.com/en/market/product/124107 A Day in the Life of a Trader: Discovering the Forex Matrix Dashboard In the fast-paced world of forex trading, keeping track of multiple currency pairs can feel overwhelming. That’s where the Forex Matrix Dashboard comes in, making the life of a trader much easier. Imagine opening the dashboard and instantly seeing all your favorite currency pairs, like EUR/USD, GBP/USD, and USD/JPY, displayed clearly with their latest prices. No mo
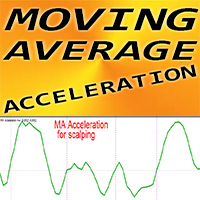
Forex Indicator MA Acceleration for MT4, No Repaint. MA Acceleration - is scalping indicator, designed as auxiliary tool for "MA Speed" indicator The calculation of this indicator is based on equations from physics. It will show you the acceleration of moving average line. There are plenty of opportunities to upgrade even standard strategies with MA Acceleration. It is possible to use for SMA, EMA and LWMA. Indicator set up is very easy. MA Acceleration indicator shows how fast MA Speed indi

MT5 Version: https://www.mql5.com/en/market/product/124150 You’re sitting in your trading room, sipping coffee as the markets start their day. The screen in front of you is alive with numbers, price movements, and endless charts. Each one demands your attention. But you don’t have time to dive into every single detail. You need a quick, reliable way to read the market’s mood. That’s when you glance at your Sentiment Dashboard—a custom-built tool designed to simplify your trading decisions. This
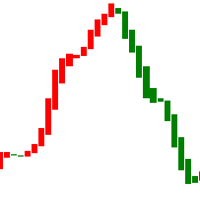
This is an indicator that tracks price trends and can alert traders when the market exhibits abnormalities. The indicator chart is marked with red and green colors. The background color of the chart is white and cannot be modified to other background colors. When the indicator color changes from red to green, it means that the market price has paused or even reversed. This is a reminder to traders of the possibility of short orders. When the indicator color changes from green to red, it means t

The indicator provides a color changing moving average with color changing candles
The candles color change is based of rsi and t3
The moving average changes depend on value
The values can be changed as preferred
Suitable to any timeframe or instrument of choice
Test in demo before purchase
Enjoy -----------------------------------------------------------------------
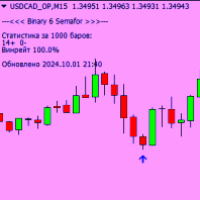
Binary 6 Semafor est un indicateur d'options binaires universel pour MetaTrader 4.
-Fonctionne sur n'importe quelle période et paire de devises
-Détection précise du point d'entrée
-Le signal apparaît sur le graphique avant la fermeture de la bougie actuelle
-Expiration 1 bougie
-Flèches tampon pour l'entrée
-Afficher les statistiques pour l'actif actuel
Résultats des tests :
L'indicateur a passé des tests avec des rendements impressionnants, démontrant son efficacité dans dive

Discover the Game-Changer: Inception - The Market Reversal Architect Welcome to the Future of Trading Hey there, savvy trader! Tired of feeling like you're riding a rollercoaster in the trading world? We’ve all been there, staring at the charts like we're trying to decode the Matrix. The endless ups and downs, the unpredictable markets—it can be a wild ride. But guess what? It doesn’t have to be. Say hello to your new best friend: Inception - The Market Reversal Architect .
Meet Your Trading S
The Big Short: Your Edge in Market Chaos Unlock the Power of Precision Reversal Trades Welcome to the Next Level of Reversal Trading Hey, busy professional! Have you ever found yourself staring at the market charts, second-guessing if you're making the right call? The endless market swings can make anyone feel unsure. But guess what? As someone juggling a 9-5 job and trading on the side, I found my solution in The Big Short – Your Edge in Market Chaos . Drawing inspiration from the sharp insig
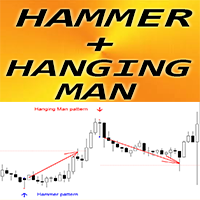
Forex Indicator " Hammer and Hanging Man patterns" for MT4 Indicator " Hammer and Hanging Man" is very powerful indicator for Price Action trading: No repaint, No delays; Indicator detects bullish Hammer and bearish Hanging Man patterns on chart: Bullish Hammer - Blue arrow signal on chart (see pictures) Bearish Hanging Man - Red arrow signal on chart (see pictures) with P C, Mobile & Email alerts Indicator " Hammer and Hanging Man " is excellent to combine with Support/Resist
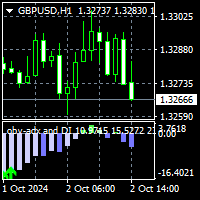
To get access to MT5 version please click here . This is the exact conversion from TradingView: "OBV ADX and DI" by " kocurekc ". This is a light-load processing and non-repaint indicator. All input options are available. Buffers are available for processing in EAs. You can message in private chat for further changes you need. I removed the background coloring option to best fit into MT platform graphics.
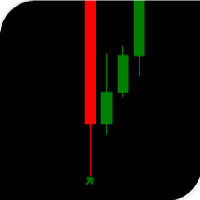
The arrow indicator without redrawing shows potential entry points into the market in the form of arrows of the appropriate color: the up arrows (usually green) suggest opening a purchase, the red down arrows suggest selling. The appearance of arrows may be accompanied by beeps. It is usually assumed to enter at the next bar after the pointer, but there may be non-standard recommendations. Arrow indicators visually "unload" the price chart and save time for analysis: no signal – no deal, if ther
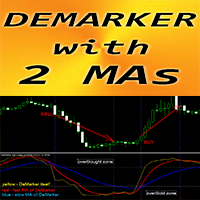
Forex Indicator " DeMarker and 2 Moving Averages" for MT4 DeMarker oscillator curve indicates the current price position relative to previous highs and lows during the indicator calculation period "DeMarker and 2 Moving Averages" Indicator allows you to see Fast and Slow Moving Averages of DeMarker oscillator I t is great to take Sell entries from OverBought zone (above 0.7) and Buy entries from OverSold zone (below 0.3) I ndicator is very easy to set up via parame
Savez-vous pourquoi MetaTrader Market est le meilleur endroit pour vendre des stratégies de trading et des indicateurs techniques ? Pas besoin de publicité ou de protection logicielle, pas de problèmes de paiement. Tout est fourni dans le MetaTrader Market.
Vous manquez des opportunités de trading :
- Applications de trading gratuites
- Plus de 8 000 signaux à copier
- Actualités économiques pour explorer les marchés financiers
Inscription
Se connecter
Si vous n'avez pas de compte, veuillez vous inscrire
Autorisez l'utilisation de cookies pour vous connecter au site Web MQL5.com.
Veuillez activer les paramètres nécessaires dans votre navigateur, sinon vous ne pourrez pas vous connecter.