YouTubeにあるマーケットチュートリアルビデオをご覧ください
ロボットや指標を購入する
仮想ホスティングで
EAを実行
EAを実行
ロボットや指標を購入前にテストする
マーケットで収入を得る
販売のためにプロダクトをプレゼンテーションする方法
MetaTrader 4のためのテクニカル指標 - 142
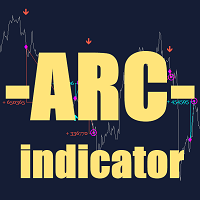
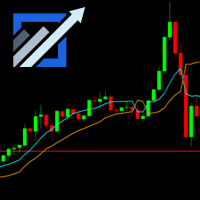
ARC Indicator — これは、最適なエントリーポイントを決定する分析アルゴリズムと、取引の出口用のアルゴリズムに基づく指標です。この指標は、買いと売りの両方に同時に対応し、外国為替市場に適しています。取引の出口は、専門的なアルゴリズムのおかげで最適なタイミングで行われます。**ストップロス(Stop Loss)**レベルは自動的に計算され、2つのモードが利用可能です: " ミニマル(Minimal) "モードはスキャルピングに適しています。 " ノーマル(Normal) "モードはリスクを高めますが、成功する取引の数と総利益も増加させます。
設定: インジケーターのカラーテーマ(Indicator Color Theme) - スクリーンショットに示されているようにカラーテーマを設定します; ストップロスサイズ(Stop Loss Size) - 前述のように**ストップロス(Stop Loss)**のサイズを定義します; ステップ(Step) - エントリーアルゴリズムを計算するためのステップ; パーセント 1(Percent 1) - 分析アルゴリズム
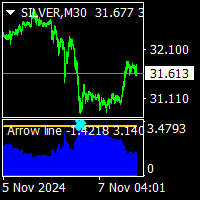
Arrow line indicator is no repaint trend indicator. it works on all time frame and all pairs. it is a pi number ( π) trigger based trend indicator. suitable for experienced traders and beginners. easy to understand. there is a trigger line and 2 histograms. red histogram is ower trigger that is top signal.. blue histogram is over trigger that is bottom signal. minimum bar number is 500. processed value must be setled between 500-3000. max value is depend to chart you are using.
Binary SF インジケーターは、バイナリーオプション取引のためにMetaTrader 4プラットフォーム向けに設計されており、再描画しないシグナルを提供するため、トレーダーにとって信頼できるツールです。M1から日足までのあらゆるタイムフレームに対応しており、主にトレンド取引に使用され、短期および中期取引のエントリーポイントを見つける手助けをします。 動作原理とシグナル このインジケーターは市場を分析し、現在のローソク足の終値でチャートに矢印(買いは上向き、売りは下向き)としてシグナルを表示します。これにより、ローソク足形成中に発生する可能性のある偽シグナルを防ぐことができます。矢印のシグナルはバッファを介して生成されるため、EAや自動取引に統合するのに便利です。シグナルは次のローソク足で機能するように設計されており、取引の有効期間は取引戦略や選択したタイムフレームに応じて1〜3本のローソク足です。 特徴 再描画なし: エントリーポイントを示す矢印は表示後に変わらず、偽シグナルのリスクを排除し、トレーダーが正確に取引ルールに従うのを助けます。 バッファベースのシグナル: このインジ

Last 50 Pips インジケーターは、最近の価格動向に基づいて買いと売りのチャンスを素早く特定するために設計されています。直近のローソク足の価格変動を測定し、価格が方向を変える可能性がある瞬間を黄色で強調表示します。
買いシグナル: インジケーターが 赤 から 黄色 に変わったとき、 買い ポジションを開く必要があります。これは、下降トレンドから上昇トレンドへの転換を示唆します。簡単さを確認するために画像をご覧ください。
売りシグナル: インジケーターが 緑 から 黄色 に変わったとき、 売り ポジションを開く必要があります。これは、上昇トレンドから下降トレンドへの転換を示唆します。
アラート: インジケーターはまた、音声、メール、またはプッシュ通知を通じてリアルタイムアラートを受け取るオプションを含んでおり、ユーザーがどのデバイスからでも迅速にチャートの新しいシグナルに反応できるようにします。
ご質問があれば、お気軽にご連絡ください :)
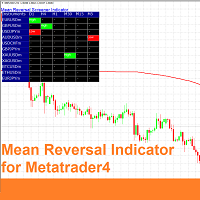
The Mean Reversal Indicator for MetaTrader 4 is a custom technical tool that identifies when the market reaches an n-period high or low, signaling potential mean reversion opportunities. Acting as a versatile screener, this indicator enables traders to detect n-period highs/lows across any selected timeframe and market offered by the broker, making it highly adaptable for multi-market or multi-timeframe analysis. Additionally, the Mean Reversal Indicator offers optional signal filters, including
TW Volume Signal Pro MT4 は、先進的なAI技術と独自のスマートアルゴリズムを活用し、金市場でより自信を持って取引できるようにし、ユニークで比類のない取引体験を提供します。金市場で高い精度と卓越した取引信号をお探しですか?TW Volume Signal Pro MT4を使用すれば、プロのトレーダーとなり、金市場で大きな成功を収めることができます。それでは、今すぐ無料でお試しください!
TW Volume Signal Pro MT4の主な特徴:
正確で信頼できる信号: 信号、テイクプロフィット(TP)、およびストップロス(SL)はまったく変わらず、完全に信頼することができます。
正確なトレンド検出: TW Volume Signal Pro MT4は取引量を分析し、市場のトレンドの変化を正確に特定し、最適なタイミングで取引に入る手助けをします。
スマートアラート: 入場、テイクプロフィット、およびストップ

Arbitrage Indicators is a professional and easy-to-use Forex trading indicator that uses the best trading principles of the latest AI arbitrage models. This indicator provides accurate buy and sell signals. Applies to currency pairs only. It has six different metrics options, MACD, KDJ, RSI, CCI, RVI, DEMARK. It can be freely switched by users, and intuitively shows the direction and reversal signal of the currency pair. When the two lines cross colors, the currency has a high probability of rev
AI Fibonacci Indicators (Non-Redraw) is a professional and easy-to-use AI fully automated Fibonacci generator Forex trading indicator that uses the latest AI technology to automatically identify accurate Fibonacci positions on charts and automatically plot them on charts. This indicator provides accurate Fibonacci important price positions. Applicable to any currency pair and other products. It has seven function switches, There are five different Fibonacci types (" Fibonacci retracement line "

The SYMBOL MANAGER symbol change indicator is an effective tool designed to enhance trading convenience and significantly simplify the trader's experience.
This indicator allows users to switch seamlessly between currency pairs and timeframes within a single open window of the trading terminal. Importantly, when switching, the associated template, including indicators and current chart settings, is automatically duplicated, ensuring a consistent trading environment.
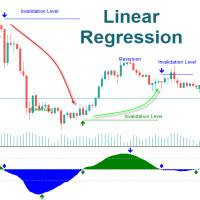
The Linear Regression Oscillator (LRO) is a technical indicator based on linear regression analysis, commonly used in financial markets to assess the momentum and direction of price trends. It measures the distance between the current price and the value predicted by a linear regression line, which is essentially the best-fit line over a specified period. Here’s a breakdown of how it works and its components: Key Components of the Linear Regression Oscillator Linear Regression Line (Best-Fit
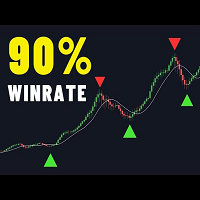
There are many linear regression indicators out there, most of them draw lines or channels, but this one actually draws a chart. This indicator also alow user show MA line on chart. So buy signal is when red candle and crossdown with MA line and vice versal. Following MA type is supported: SMA EMA RMA WMA This simple mineset but powerfull KISS - Keep it simple, stupid :D
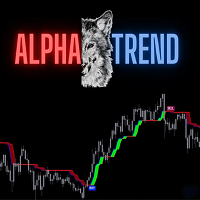
AlphaTrend is a brand new indicator which inspired by Trend Magic. In Magic Trend we had some problems, Alpha Trend tries to solve those problems such as:
1-To minimize stop losses and overcome sideways market conditions.
2-To have more accurate BUY/SELL signals during trending market conditions.
3- To have significant support and resistance levels.
4- To bring together indicators from different categories that are compatible with each other and make a meaningful combination regarding momen

Morning Star PRT インジケーターは、朝のフラットブレイクアウト原理を使用します。インジケーターは朝のフラットレベルを表示し、可能なターゲットを示します。 インジケーターには追加のフィボナッチレベルが追加され、設定で指定された両方のターゲットレベルと夜間のフラットレベルの交差点に関するサウンドアラートも追加されました。
Morning Star PRT インジケーターは、夜の終わりに夜間のフラットチャネルと、上下の 2 つのフィボナッチ価格レベルを構築します。これらのレベルは、ターゲットレベルと反転レベルの両方と見なすことができます。
Morning Star PRT インジケーターはすべての時間枠で機能しますが、M15 間隔で使用するのが最も効果的です。
The Morning Star PRT indicator uses the morning flat breakout principle. The indicator displays morning flat levels and shows possible targets.
An additiona
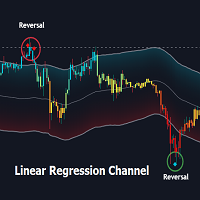
Overview:
The Linear Regression Channel Indicator is a versatile tool designed for Metatrader to help traders visualize price trends and potential reversal points. By calculating and plotting linear regression channels, bands, and future projections, this indicator provides comprehensive insights into market dynamics. It can highlight overbought and oversold conditions, identify trend direction, and offer visual cues for future price movements.
Key Features:
Linear Regression Bands: ( fig

インジケーター サプライ & デマンド ゾーン PRT – は、チャートのサプライ ゾーンとデマンド ゾーンのマーキングを実行するために使用されるカスタム ツールです。インジケーターは、抵抗/サポート レベルとサプライ/デマンド ゾーンを強調する線と長方形をチャート上に描画します。便宜上、線と数字は両方とも異なる色で塗られており、シグナルを互いに簡単に区別できます。インジケーターは、まだ使用されていない、価格がまだ突破していない新しいレベルのみを描画します。初心者と経験豊富なトレーダーの両方に最適です。
インジケーターは、スキャルピング、トレンド、カウンタートレンド、その他のトレーディング システムで使用されます。これは、あらゆる戦略の一部に簡単に組み込むことができる汎用アルゴリズムです。すべての時間枠とインストルメントで適切に表示され、オシレーターとうまく組み合わせることができます。 Indicator Supply & Demand zones PRT– is a custom tool that is used to perform supply and demand zon

このインジケーターは、チャートパターンを特定したいトレーダーにとって強力なツールであり、トレーディング戦略に組み込むことのメリットは数多くあります。このツールは、金融市場の潜在的なトレンドと反転を効果的に特定して通知し、トレーディングの収益性を高めます。高度なアルゴリズムのおかげで、インジケーターは市場データを正確に分析し、トレーダーに情報に基づいた決定を下すのに役立つ貴重な情報を提供します。このインジケーターを使用すると、チャートパターンを高精度で自動的に特定するため、より包括的な市場分析が可能になります。これらのパターンは、多くの場合、特定の方向への潜在的な価格変動を示します。したがって、この情報にアクセスできると、トレーダーは、これらのパターンを認識できないか、その意味を理解できない可能性のある他の市場参加者よりも有利になります。
このインジケーターは、強気と弱気のパターン認識機能を幅広く備えています(チャート上の略称は括弧内に表示されます)。
- Rising Star(SS)
- Evening Star(E_Star)
- Evening Doji Star(E_

Deep Insight Candles is an indicator that brings an entirely new perspective to the price chart. It focuses on revealing hidden structures in market movements, uncovering buyer and seller pressure, thus helping traders to better identify key levels, dynamics, and potential reversals. The indicator conveys deeper market insights, allowing traders to make decisions based on a more accurate perception of market sentiment and pressure at specific price levels. This innovative approach transforms the

Entry indicator for: - Strong moves - Tops Bottoms
Try it as yourself and it proves its value with its results. - - - - - - - - - - - - - - - - - - - - - - - - - - - - - - - - - - - - - - Info: BarRange = how many bars are detected; AlertConfirmation = Alerts on and off; CalculatedBars = Indicator Calculated Bars; Buffer0[] = Arrow Up; Buffer1[] = Arrow Down; Buffer4[] = 1 or 0 Buy Signal Buffer5[] = 1 or 0 Sell Signal
毎日、市場の開始時に、 Flashpoints Breakout は前日のデータ(高値、安値、終値)を使用してピボット、サポート、レジスタンスレベルを確認し、2つのブレイクアウトレベル(強気と弱気)を計算します。 このようにして、朝一番に新しいエントリーレベルが準備され、Take Profit (TP) と Stop Loss (SL) の値も提供されるため、追加の計算なしで買いのストップ注文や売りのストップ注文を設定できます。 Flashpoints Breakout を使用すると、毎日1または2の買いのストップ注文と1または2の売りのストップ注文を設定し、期待されるブレイクアウトレベルに基づいて機会を逃さないようにできます。 上部のデータパネルを確認し、注文を設定します — 買い注文が1または2、売り注文が1または2です。パネルには、正確なエントリー値、SL、TPが表示され、チャートにはこれらの値に対応する線も表示されます(画像を参照してください)。
1. 買い操作 (BUY): エントリー 1 "BUY" ==> BUYエリア内: 注文 1: BUYエリア内でBUY STOP。
BUYSELLMAGIC is a non-repainting signal-type trading indicator designed to precisely detect entry points in the market.
Features Reliable and permanent signals : BUYSELLMAGIC signals are final once the candle closes, ensuring they will not be modified or removed from the chart. This gives you the confidence of working with an indicator that keeps its signals stable and trustworthy. Comprehensive alerts : In addition to signals on the chart, you’ll receive notifications via email, pop-up alerts

The SniperPro(XAU-USD) trading indicator has performed well for 15 days on XAU USD.....When trading on this indicator, the order sometimes goes into a drawdown.....The indicator does not redraw!!!!!! The indicator works on time intervals M1-D1....He performed well during the release of economic news… We attach the indicator to the XAU – USD M5 chart with standard settings without changing anything.....

Automatic Fibonacci Pivots automatically calculates pivot levels and support/resistance based on Fibonacci, clearly showing key reference points that indicate potential reversal or trend continuation zones, as well as buy and sell areas . Designed for traders seeking clarity on charts without having to recalculate and manually place Fibonacci levels each time. Once set up on your computer, it will send an alert to your phone when a potential buy/sell signal is issued, allowing you to trade direc
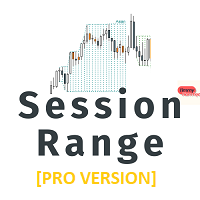
Liquidity is one of the most crucial aspects of the forex market. We can say that liquidity exists at every level of price, but there are certain areas where liquidity tends to be higher. The session high/low is one such area, which is why we developed this indicator. Why Session Range? Helps traders identify session liquidity : The session high/low represents a key liquidity pool, especially during the Asian session. Provides insight into your session position : This indicator allows you to pi
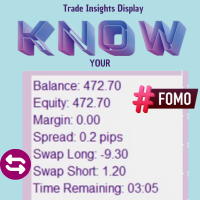
Trade Insights Display is the ideal companion for traders who want to operate with clarity and precision. This indicator provides real-time access to critical account data, such as: Balance Equity Margin Spread Swap Remaining time for the current candle . These data points are essential, regardless of the strategy or other indicators you use. Having this indicator always visible allows you to quickly assess your account status, the swap for each pair (helping you avoid high-cost trades), and the

In the fifth update , the indicator now aims to predict the direction of the next candle, issuing a buy or sell arrow precisely when the conditions are met.
Since its first version, which showed support and resistance levels on the chart, up to the current version 5, many improvements have been made. One of the key changes is the removal of visual support and resistance levels to prevent memory overload. This is no longer necessary, as arrows are now issued when the price is near or touches th

BTC Follow Line - ビットコイン取引のガイド BTC Follow Lineは、暗号通貨市場専用に設計された高度なインジケーターで、特にビットコインに焦点を当てています。中長期の信頼できる 買い や 売り シグナルを探しているトレーダーに最適です。このツールは、あらゆる時間足で機能し、トレーディングのニーズに柔軟に対応します。 BTC Follow Lineを選ぶ理由 シンプルで直感的 : クリーンでわかりやすいインターフェースにより、簡単に情報に基づいた判断ができます。 汎用性 : 短期分析から長期評価まで、あらゆる時間足で利用可能。どのような状況でも包括的なサポートを提供します。 ビットコインに最適化 : BTC市場の独自の動きを的確に捉えるように設計されており、シグナルの一貫性が向上します。 BTC Follow Lineの動作原理 インジケーターはビットコインのトレンドを分析し、市場の主要なトレンド変化に基づいて視覚的なシグナルを生成します。緑色と赤色のラインで、エントリーポイントやエグジットポイントを明確に表示し、正確なガイダンスを提供します。 主な利点 不確

概要
Arrow Blue Reversal Indicator は、潜在的な市場反転を識別するために設計された強力な MQL4 取引ツールです。初心者でも経験豊富なトレーダーでも、このインジケーターは明確な非再描画シグナルを提供し、情報に基づいた取引決定を下すのに役立ちます。
主な機能
- 正確な反転シグナル: トレンド反転を検出します。
- 非再描画矢印: 矢印が表示されたらチャート上に残り、誤解を招くようなシグナルが発生しないようにします。
- 使いやすいインターフェイス: シンプルで直感的なデザインで、あらゆるスキル レベルのトレーダーに適しています。
- すべての時間枠と資産で動作: 外国為替、株式、商品、暗号通貨に適応できます。
- 遅延インジケーターなし: 遅延インジケーターの代わりにリアルタイムの価格アクションを使用して、タイムリーなシグナルを生成します。
- カスタム アラート: サウンド、電子メール、またはモバイルへのプッシュ アラートで通知を受け取ります。
仕組み
Arrow Blue Reversal Indicator は、主要な価格アク

non-repaint free MT4 technical indicator works on all timeframes 1 minute to the monthly timeframe the trade vision buy and sell arrow is a multi currency and synthetic indicator Trade vision buy and sell arrow comes with Push Alerts purple arrow look for selling opportunities white arrow look for buying opportunities. wait for candle to close and arrow to appear before taking any trades

AIインジケーター:スマートトレーディングの未来がここに 新しい時代のトレーディングへようこそ。 AIインジケーター は、すべてのレベルのトレーダーに最適なパートナーであり、信頼性の高いデータと高度な分析に基づいて意思決定を支援するために設計されています。人工知能(AI)の力を活用し、このツールはどんな市場やタイムフレームにも適応できる能力で際立ち、明確で正確なトレードシグナルを提供します。 人工知能(AI)とは何か?トレーディングでなぜ重要なのか? 人工知能(AI)は、人間の認知プロセス(学習、適応、分析など)を模倣する高度な技術です。トレーディングでは、AIは強力なアルゴリズムを使用して、大量のデータを迅速に分析し、人間の目では見逃しがちなパターンを特定します。これにより、市場を理解する新しい次元が開かれ、複雑で動的な環境をより自信を持ってナビゲートできます。 AIインジケーターの核心:インテリジェントな回帰線 AIインジケーター の中心には、AIアルゴリズムを使用して価格をリアルタイムで分析し、潜在的な市場の動きを予測する革新的な回帰線があります。単純なトレンドラインや移動平均線
Revolutionize Your Trading with the Enhanced Schaff Trend Cycle Indicator! Unlock the full potential of your trading strategy with our Advanced Schaff Trend Cycle (STC) Indicator , an indicator to deliver faster, more accurate signals than ever before. Built on the foundation of Doug Schaff's classic STC, this upgraded version integrates cutting-edge enhancements to suit the demands of modern traders. Why Choose This Indicator? Precision Redefined : Improved calculations for sharper trend ide
Master Market Trends with the Advanced XST Indicator! Introducing XST (eXtreme Super Trend) , the next-generation trend-following indicator designed for traders who demand speed, precision, and simplicity. XST builds on the strengths of the classic Super Trend indicator while incorporating advanced modifications that make it faster, smarter, and more adaptive to modern market dynamics. Why Choose XST? Enhanced Accuracy : With improved algorithms, XST reduces false signals and provides more re
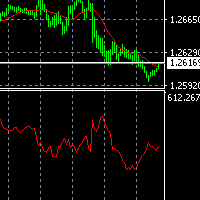
При большом количестве сделок автоматической торговли на различных валютных парах сложно оценить какие были убытки в прошедшем периоде в отсутствии наблюдения. Индикатор помогает проанализировать величину убытков на каждый момент времени в прошлом, когда завершенные ордера были активны, а так же величину убытков еще не завершенных ордеров. Его можно использовать для анализа размера депозита, необходимости увеличить депозит или наоборот возможности его уменьшить в соответствии с используемой стр
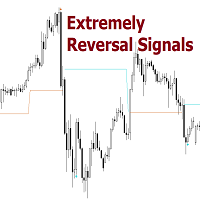
Reversal Signals [AlgoAlpha] – Master Market Reversals with Precision!
Elevate your trading strategy with the Reversal Signals indicator by AlgoAlpha. This advanced tool is designed to pinpoint potential bullish and bearish reversals by analyzing price action and, optionally, volume confirmations. It seamlessly combines reversal detection with trend analysis, giving you a comprehensive view of market dynamics to make informed trading decisions.
Key Features
Price Action Reve

パラボリック SAR およびサポート/レジスタンス レベルは、潜在的なトレンドの反転やエントリー ポイントとエグジット ポイントを識別するために外国為替取引で使用されるテクニカル分析インジケーターであるだけでなく、既製の自律的な取引戦略でもあります。
このインジケーターは、チャートに動的なサポート レベルとレジスタンス レベルを追加することで PSAR インジケーターを基盤としており、トレーダーが市場が反転する可能性のある主要な価格レベルを特定するのに役立ちます。 このインジケーターを使用すると、トレーダーは市場の強さと方向、および取引の潜在的なエントリー ポイントとエグジット ポイントに関する洞察を得ることができます。
パラボリック SAR およびサポート/レジスタンス レベル インジケーターは、チャートにさまざまなパラボリック サポートとレジスタンス (PSAR) レベルをプロットするテクニカル分析ツールであり、トレーダーに潜在的なトレンドの反転シグナルを提供します。 このインジケーターは、メインの MT4 チャート ウィンドウに一連の水平に並んだ線として表示されるため、トレ

The All Market Channels indicator from ProfRobotrading automatically builds and displays all formed trading channels on the screen. This indicator is very convenient for trading on all existing channel strategies and is applicable to all instruments and timeframes.
Look at the screenshot - it will tell you more :)
More information is available on our website ProfRoboTrading.
ProfRobotrading の All Market Channels インジケーターは、形成されたすべての取引チャネルを自動的に構築して画面に表示します。このインジケーターは、既存のすべてのチャネル戦略での取引に非常に便利で、す

This is a Bollinger Bands Compression indicator. It detects volatility compression and the release of “suppressed momentum.” It can be used when it coincides with any specific trading entries — released volatility means a higher probability of making a decent profit. There is also a histogram with colored bands symbolizing weakness or strength, and a zero line crossover. Therefore, this indicator can be used both in conjunction with other indicators within trading strategies, and on its own meri

This is the MT4 Ichimoku Dashboard. This dashboard will scan multiple timeframes in MT5 platform, from M1 chart to D1 chart. It will send the buy/sell signals by alert on the platform or sending notification to your phone or message you via a email.
The buy/sell signal can be set by cross of multiple lines: ex: tenkan-sen line, kijun-sen line, the cloud or you can select the price to cross or above/below the kumo cloud... Please discovery in the input setting, You can find the rule that you are
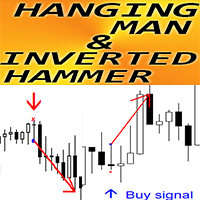
Crypto_Forex インジケーター「ハンギングマンと逆ハンマーパターン」MT4 用。
- インジケーター「ハンギングマンと逆ハンマーパターン」は、プライスアクション取引に非常に強力なインジケーターです。再描画なし、遅延なし。 - インジケーターは、チャート上の強気の逆ハンマーと弱気のハンギングマンパターンを検出します。 - 強気の逆ハンマー - チャート上の青い矢印信号 (画像を参照)。 - 弱気のハンギングマン - チャート上の赤い矢印信号 (画像を参照)。 - PC、モバイル、および電子メールアラート付き。 - インジケーター「ハンギングマンと逆ハンマーパターン」は、サポート/レジスタンスレベルおよび保留中の注文と組み合わせるのに最適です。
// 優れたトレーディングロボットとインジケーターは、 https://www.mql5.com/en/users/def1380/seller から入手できます。 これは、この MQL5 ウェブサイトでのみ提供されるオリジナル製品です。
The DMI MultiTimeframe EMA indicator is designed to facilitate multi-timeframe analysis by displaying a moving average from a specific timeframe (like H1 or D1) on any other chart timeframe. This tool allows traders to have a broader view across multiple timeframes directly on the current chart, enhancing precision and understanding of market trends. Parameters : Moving Average Timeframe : Sets the timeframe for the moving average, such as H1 for hourly or D1 for daily. Default: H1. Moving Avera

The Trend Ultimate Indicator is designed for visualizing and analyzing market trends, allowing traders to quickly assess current market tendencies. It is particularly useful for: Determining the duration of the current trend (bullish or bearish). Providing a clear visualization of price behavior relative to key moving averages and the MACD indicator. Supporting decision-making based on histogram dynamics (trend direction and intensity). Trend Ultimate does not guarantee profit but assists trader

Indicator Seff designed for both beginners and professionals. This indicator generates possible entry points to open BUY and SELL trades and will help you: reduce the number of errors when opennig orders; predict price movement(in absent of significant news); do not rush to close profitable trades prematurely and increase profit; do not rush to enter the market and wait for "easy prey": and increase the profitability of trading. Does not redraw and works by opening bar.
Settings
ALARM- enabl

This indicator combines two tools: MACD and OsMA . MACD is displayed as two lines: The black line represents the main MACD line. The orange line represents the MACD signal line. OsMA Histogram is shown in two colors: Green bars indicate growth. Red bars indicate decline. You can customize the line colors and thickness in the settings. This indicator serves as an addition to the Combo View Impulse System indicator but can also be used independently. Parameters: Fast EMA period (12) – The short

The Ligma Binary Indicator is a sophisticated tool designed to assist traders in identifying key price action patterns that offer high-probability trade opportunities. This indicator is based on a unique strategy that detects isolated candles or “lonely” candles, which occur in trending markets and are often followed by strong price reversals or continuations. Key Features: Trend Detection: The indicator uses a Simple Moving Average (SMA) to identify the prevailing market trend (uptrend or downt
This is the ADX Dashboard MT5. This dashboard will scan multiple timeframes in MT4 platform, from M1 chart to D1 chart. It will send the buy/sell signals by alert on the platform or sending notification to your phone or message you via a email.
The buy signal is the cross over of DI+ and DI- The sell signal is the cross under of DI+ and DI-.
The up trend color will be displayed when DI+ is greater than DI- The down trend color will be displayed when DI+ is less than DI- The value of ADX value wi
This is the Super Trend Dashboard MT4. This dashboard will scan multiple timeframes in MT4 platform, from M1 chart to D1 chart. It will send the buy/sell signals by alert on the platform or sending notification to your phone or message you via a email.
The buy signal is generated when the super trend line flip from SELL to BUY. The sell signal is is generated when the super trend line flip from BUY to SELL.
The up trend color will be displayed depending on the current Super Trend value.
Индикатор LiquidityDWM отображает на графике не перекрытую дневную, недельную, месячную ликвидность и предназначен для определения предрасположенности направления ценового движения. В концепции движения цены рынок всегда стремиться в сторону ликвидности для ее снятия, поэтому для торговли очень важно знать рыночную предрасположенность движения цены. Индикатор LiquidityDWM покажет вам самые важные уровни ближайшей ликвидности, куда стремиться рынок в первую очередь. Знание первоочередной цели д
This is the Heiken Ashi Dashboard MT4. This dashboard will scan multiple timeframes and symbols in MT4 platform, from M1 chart to D1 chart. It will send the buy/sell signals by alert on the platform or sending notification to your phone or message you via a email.
The buy signal is generated when the heiken ashi bar changes its color from red to white. The sell signal is is generated when the heiken ashi bar changes its color from white to red. The up/down trend color will be displayed depend
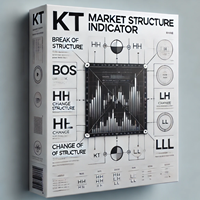
The KT Market Structure intelligently detects and displays Break of Structure (BOS) , Change of Character (CHoCH) , Equal Highs/Lows (EQL) , and various significant swing high/low points using our proprietary algorithm for accurate pattern detection. It also offers advanced pattern analysis by effectively demonstrating the captured profit for each pattern. A fully automated EA based on this indicator is available here: KT Market Structure EA MT4
Features
Accurate Pattern Detection: Our advance

This indicator combines several functionalities: Value Zone Displays two exponential moving averages (EMAs): 13-period EMA in red. 22-period EMA in blue. Impulse System (based on Dr. Alexander Elder's methodology) Candles are color-coded to indicate trade restrictions: Red candles prohibit buying. Green candles prohibit selling. Blue candles allow both buying and selling. Recommended for use on two timeframes for enhanced analysis. 3x ATR Channel A channel based on 3 times the ATR (Average True

MarketEcho Signals is a powerful and innovative technical analysis tool designed to identify high-probability buy and sell signals in the financial markets. By combining trend-following indicators with price action patterns, this indicator helps traders navigate volatile markets with ease. It is based on a 25-period Exponential Moving Average (EMA) to filter trends, ensuring that trades are taken in the direction of the overall market momentum. Key Features : Trend Filter with EMA :
The MarketEc

High, Low, Open, and Close of Candles: Utilizing the Bombafkan Indicator Tool With the Bombafkan Indicator, you can easily view the high, low, open, and close of candles and analyze this price information across different timeframes. This feature helps you perform more accurate analyses and optimize your trading strategies with a comprehensive view of price movements. Additionally, the Bombafkan Strategy includes a setup called the "Candle-Side Signal," which allows you to easily take bu

“ Active Impulse ” - это высокоточный индикатор появления активного импульса (АИ), который является важным элементом современных торговых систем, разработанных на основе теории импульсного равновесия. Индикатор позволяет кардинально снизить время нахождения трейдера у монитора - просто установите индикатор на группу графиков и не нужно будет часами сидеть у монитора, так как индикатор в потоке информации мгновенно находит активные импульсы с определёнными параметрами и при их появлении на график
Enhance your trading with visual clarity — identify trends instantly with dynamic EMA ribbons! Description:
The DMI Dynamic EMA Ribbon is an advanced indicator designed to help traders visualize trend direction and strength using two dynamic exponential moving averages (EMAs). With customizable parameters, this tool enhances your ability to make informed trading decisions by clearly indicating bullish and bearish trends. Key Parameters: Customizable timeframe for moving averages. Period for the
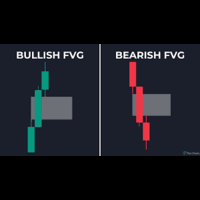
It identifies fair value gaps which are currently valid. Settings: Bullish FVG Color: To set the color of bearish FVGs. Bearish FVG Color: To set the color of bearish FVGs. Minimum Size: For filtering the signals. The restricts a minimum size for the FVG to be considered valid. For custom additions you can reach out to developer here MT5 Version available here

This updated version of the Value Chart indicator introduces new parameters in the way the indicator is calculated. Its main objective is to analyze the current range and attempt to predict the direction of the ongoing candle, displaying an arrow indicating where the candle is expected to move. The calculation structure is based on the last 1,000 candles. First, a weighted average is calculated for each candle. Then, the modified Value Chart calculation is applied to determine the range and str
DMI Smoothed CCI plus: Track Market Trends and Reversals Across Multiple Timeframes The DMI Smoothed CCI plus is a powerful tool for traders, designed to analyze market trends and potential reversals using the Commodity Channel Index (CCI) across multiple timeframes. Ideal for trend-following strategies, this indicator helps you spot overbought and oversold conditions, providing real-time insights that are crucial for optimizing your market entries and exits. Key Features: Multi-Timeframe Analy

What are Fair Value Gaps (FVG)? Fair Value Gaps occur when price moves so quickly that it creates an imbalance between buyers and sellers. These gaps represent areas where price "skipped" levels, creating potential zones for price to return and "fill the gap". Think of it as unfinished business in the market that often gets revisited. They are also considered a support or resistance area because it represents a zone on a chart where there is a significant imbalance between supply and demand, ca
Boost your trading accuracy with the SSL Channel Indicator , designed to identify trends and precise entry points. This dynamic tool adapts to all trading instruments and timeframes. Perfect for scalpers, day traders, and swing traders, the SSL Channel Indicator simplifies market analysis, helping you trade confidently and effectively. Unlock your trading potential today! MT5 Link- https://www.mql5.com/en/market/product/127492

Crypto_Forex インジケーター「ダイナミックな売られ過ぎ/買われ過ぎゾーンを備えたフォース インデックス」MT4 用、リペイントなし。
- フォース インデックスは、価格とボリュームのデータを 1 つの値に組み合わせるトップ インジケーターの 1 つです。 - ダイナミックな買われ過ぎゾーンから売り取引を行い、ダイナミックな売られ過ぎゾーンから買い取引を行うのに最適です。 - このインジケーターは、トレンド方向へのモメンタム取引に最適です。 - ダイナミックな買われ過ぎゾーン - 黄色の線より上。 - ダイナミックな売られ過ぎゾーン - 青い線より下。 - フォース インデックス自体は、価格を動かすために使用される電力の量を測定する強力なオシレーターです。 - PC およびモバイル アラート付き。
// 優れたトレーディング ロボットとインジケーターは、こちらで入手できます: https://www.mql5.com/en/users/def1380/seller これは、この MQL5 Web サイトでのみ提供されるオリジナル製品です。
SmartTrend は、外国為替市場での取引を最適化するために人工知能アルゴリズムを使用するインジケーターです。トレーダーに市場の条件に応じて戦略を調整する機会を提供します。 SmartTrend の主な機能 : 1. 自動 StopLoss 計算 : o インジケーターは現在のボラティリティに基づいて StopLoss レベルを決定し、リスクを最小限に抑えます。 2. 緊急 StopLoss 機能 : o 市場のトレンドが変化したときにアクティブになり、追加の保護レベルを提供します。 3. AI Exit インテリジェンス : o インジケーターはリアルタイムの市場データを分析し、ポジションを閉じる最適なタイミングを判断します。 設定: インジケーターのカラーテーマ :トレーダーがインジケーターのカラースキームをカスタマイズできるようにします。 ステップ :分析計算のためのステップで、柔軟な調整を可能にします。 パーセント 1 :取引信号のより正確な決定のためのパラメータです。 SmartTrend は、トレーダーに投資を管理し

Everyone has heard that 95% of traders lose money, well join the 5% profitable one with 'The 5 Percent.
The 5 Percent Indicator: Join the Elite 5% of Traders. Manage risk and stay in the game by following the trends. Tired of being part of the 95% who lose money? The 5 Percent Indicator is your key to unlocking consistent profitability. This powerful tool provides clear, actionable signals, helping you make informed trading decisions and maximize your returns. Don't miss out on your chance to j
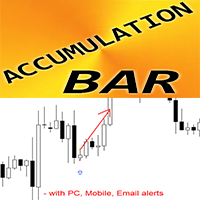
Crypto_Forex インジケーター 蓄積バー パターン (MT4 用)。
- インジケーター「蓄積バー」は、価格アクション取引用の非常に強力なブレイクアウト重視のインジケーターです。 - インジケーターは、1 つのバーの間に狭い領域で価格の蓄積を検出し、ブレイクアウトの方向、保留中の注文、SL の場所を表示します。 - 強気蓄積バー - チャート上の青い矢印信号 (画像を参照)。 - 弱気蓄積バー - チャート上の赤い矢印信号 (画像を参照)。 - 再描画なし、遅延なし、高い R/R 比率 (報酬/リスク)。 - インジケーターには調整可能な感度パラメーターがあります。 - PC、モバイル、および電子メール アラート付き。 - インジケーター「蓄積バー パターン」は、サポート/レジスタンス レベルと組み合わせるのに適しています。
// 素晴らしいトレーディング ロボットとインジケーターは、こちらから入手できます: https://www.mql5.com/en/users/def1380/seller これは、この MQL5 ウェブサイトでのみ提供されるオリジナル製品です。

If you ever wanted to know your local time (or NY time) at any bar on the chart without needing to waste time with mental calculations, look no further.
This indicator creates a crosshair which you can drag anywhere on the chart and will show you the local time in a label on top of the time axis.
Press the "c" key to show/hide the crosshair. Left click it to pick it up and drag anywhere, left click again let it go.
You can't hide the crosshair without letting it go first.
Time setting inputs
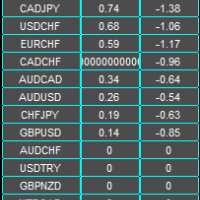
Abbeyfx Swap Dashboard displays your broker swap/interest rate. The implied swap/interest rate differential is for all currency pairs you have in your market watch.
Interest rate differential: The key factor traders consider is the difference in interest rates between two currencies involved in a pair, known as the "interest rate differential
Impact on currency value: A higher interest rate typically makes a currency more attractive, causing its value to rise relative to other currencies with
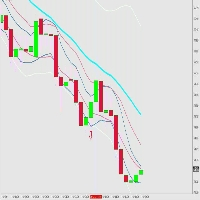
Signal Entry BBMA Low Risk High Reward Entry Friendly Use Using Fibo for TP 1, TP 2 , TP 3 , TP 4, TP 5, TP 6 , TP 7 , TP 8 , TP 9 , TP 10 Entry Low MA or Entry High MA Pair GOLD is The Best Pair EURUSD, GBPUSD, USDJPY Is Good Pair BTCUSD id Good Risk Manajemen only 1% entry and you get Profit 2-10% Recommended Broker https://one.exnesstrack.org/a/yyatk129ng If you want FullMargin Is Good but I recommended using Manajemen your Money

Please contact me after your full purchase for great bonuses.
Adaptive Reversal Star Expert Advisor and an additional indicator as a gift Info Panel are waiting for you. Adaptive Reversal Star is a new generation indicator with an advanced Adaptive algorithm , which additionally tracks potential reversal points and compares the values of the current market volatility when forming the main signals
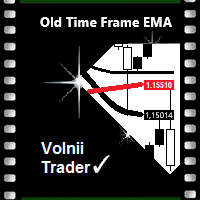
Old Time Frame EMA Индикатор двух динамических уровней сопротивления и поддержки Moving Average.
Данный индикатор рисует на открытом графике младшего тайм фрейма, ЕМА со старшего тайм фрейма. Создан для наглядности сигналов, для входа в рынок, для тех трейдеров, у кого Средние Скользящие Цены (ЕМА или МА),
являются основным сигналом для открытия или закрытия сделок. А также ориентиром, направлением тренда в движении
текущих цен, внутри дня и в среднесрочной торговле.
Возможные типы сред
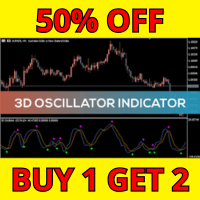
3Dオシレーターの7つのメリット トリプルマーケットビュー 「3Dオシレーター」という名前は偶然ではありません。このツールは、RSI、ストキャスティクス、CCIという3つの定評ある指標を1つのパネルに統合しています。この組み合わせにより、市場を立体的に把握でき、隠れたトレンドを発見し、リスクを回避することが可能です。 カスタマイズ可能な設定 D1RSIPer、D2StochPer、D3tunnelPerなどの調整可能なパラメータを備え、スキャルピングのような積極的なトレードスタイルから、スイングトレードのような落ち着いたスタイルまで、どんなトレード戦略にも適応します。 高精度のシグナル スムージングメカニズム(sigsmooth)と調整ファクター(hot)のおかげで、3Dオシレーターは市場ノイズを除去し、信頼性の高いシグナルを提供し、誤信号を減らします。 マルチタイムフレーム対応 1分足から週足まで、どんなタイムフレームにも対応可能です。これにより、あらゆるトレーダープロファイルに正確なインサイトを提供します。 分かりやすい解釈 2本のシグナルライン(sig1nとsig2n)は、二重
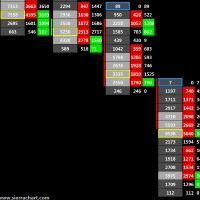
Volume Cluster Indicator for MetaTrader 4: Advanced Analysis of Support, Resistance, and Market Dynamics The Volume Cluster Indicator for MetaTrader 4 is a powerful tool designed for traders seeking an in-depth understanding of market dynamics. It provides detailed insights into volume behavior within each candlestick, highlighting levels where volume is "overpriced" and areas of weakness. This enables precise identification of support and resistance zones, making it indispensable for traders le
主な機能: パターン自動認識: AIが市場動向をリアルタイムで解析し、高確率の繰り返しパターンを検出。 三角形、フラッグ、ヘッド&ショルダーなどのクラシックな形状や、AIが捉えた微妙なパターンを認識可能。 買い・売りシグナルの表示: エントリーシグナルを 矢印 (買いは緑、売りは赤)でチャート上に表示し、音声アラートや通知で知らせます。 トレンドラインの自動描画: サポートライン や レジスタンスライン を動的に描画し、反転ポイントやトレンドの共鳴点を特定します。 複数時間軸対応: 低時間足 (M1、M5、M15)のスキャルピングに最適化されており、短期分析にも対応。 使いやすいインターフェース: シンプルで直感的なデザインにより、 簡単操作 とカスタマイズが可能。 ブレイクアウトとリトレースメントの検出: トレンドのブレイクアウトとリトレースメントを自動的に区別し、迅速な戦略に役立つ情報を提供します。 高度なアラート機能: ポップアップ、メール、プッシュ通知でアラートを送信し、重要なトレード機会を逃しません。 インジケーターの利点: 精度の向上: AIの活用により、従来のツールよりも
MetaTraderマーケットが取引戦略とテクニカル指標を販売するための最適な場所である理由をご存じですか?宣伝もソフトウェア保護も必要なく、支払いのトラブルもないことです。これらはすべて、MetaTraderマーケットで提供されます。
取引の機会を逃しています。
- 無料取引アプリ
- 8千を超えるシグナルをコピー
- 金融ニュースで金融マーケットを探索
新規登録
ログイン