Indicadores técnicos para MetaTrader 4 - 138
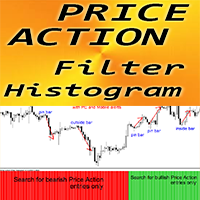
Histograma de filtro de acción de precio: es una herramienta comercial auxiliar eficiente para el comercio de acción de precio.
Este indicador sugiere al operador la dirección de las entradas. Entonces el operador sólo necesita buscar señales de acción del precio en esa dirección. El histograma del filtro de acción del precio debe combinarse con los patrones de acción del precio y los niveles de soporte/resistencia. Histograma de color verde: busque entradas alcistas Histograma de color rojo:
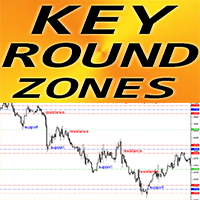
Indicador Forex "Zonas redondas clave" para MT4
El indicador "Zonas redondas clave" debe tener un indicador auxiliar para los operadores que toman en consideración el soporte/resistencia El precio respeta los niveles redondos de 1000 y 500: el precio se recupera muy a menudo. Los niveles principales 1000 también tienen fuertes zonas de soporte/resistencia (100 puntos en cada lado) a su alrededor. También los niveles de ronda 1000 y 500 son buenos para colocar Take Profits (frente al nivel de

The Onion Trend Indicator is a revolutionary trend trading and market data filtering solution that combines all the important features of a trend tool in one tool! It is great for any trader, be it Forex or binary options. No settings are required, everything is optimized by time and experience, it works effectively both in flat conditions and in trend conditions.
The Onion Trend Indicator is a technical analysis tool for financial markets that reflects current deviations in the price of

PERFECT Histogram
This indicator is the PERFECT arrows indicator turned into a histogram indicator.
Shop at the blue circle. Sell to the red circle.
The indicator is created for the M15 timeframe, first of all.
Because it gives more frequent signals. One can trade several times a day using several currency pairs.
Transactions are generally longer. Target profit can exceed 10 pips. Although I recommend for safety to be 10 pips. But it can be done depending on the situation.
This ind
The LewshaGen indicator is a technical analysis tool used in the Forex market. It helps traders make decisions when to enter or exit a trade based on analysis of market data. Let's look at how it works and why it can be useful.
How the LewshaGen indicator works: Trend Analysis: The indicator analyzes chart data and identifies key turning points and trends in the market. In the chart above, you can see how the indicator helps identify a decline of 180 points (PIP) and a subsequent rise of 330
Muon g-2
Welcome! Muon g-2 indicator works on H1, M30 and H4 timeframes and all currency pairs.
One can trade several times a day using several currency pairs.
Buy-Sell signals are in the form of arrows, white - buy, yellow - sell.
Please note the images below.
A demo download is indicated beforehand.
If the indicator does not appear, read my comment in the comment section.
thank you
I wish you much success!

The Dreadnought indicator carefully analyzes price dynamics, identifying temporary weakening of the trend and sharp changes in its direction. By monitoring this indicator, you can easily notice changes in the market and take appropriate action. Entering the market may be easy, but maintaining a position is much more difficult. With Dreadnought, you have reliable support to successfully stay ahead of the trend. This indicator analyzes historical data and provides the trader with the necessary in

Mysterium is a channel indicator without redraws, which is based on double smoothing of moving averages. Unlike channel indicators such as Bollinger, Mysterium uses double smoothed moving averages. This allows you to more accurately determine the direction of market movement, although it reduces the sensitivity of the indicator. However, double smoothing provides a clearer and more stable display of channels on the chart, which helps traders make informed trading decisions.
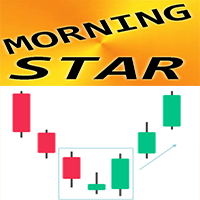
Indicador Forex "Patrón estrella de la mañana" para MT4
El indicador "Patrón Morning Star" es un indicador muy poderoso para el comercio de acción del precio: sin repintado, sin demoras; El indicador detecta patrones alcistas del Morning Star en el gráfico: señal de flecha azul en el gráfico (ver imágenes) Se incluyen alertas para PC, dispositivos móviles y correo electrónico También está disponible su hermano, el indicador bajista "Evening Star Pattern" (siga los enlaces a continuación) El i

Indicador Forex "Patrón de estrella vespertina" para MT4
El indicador "Patrón de estrella de la tarde" es un indicador muy poderoso para el comercio de acción del precio: sin repintado, sin demoras; El indicador detecta patrones bajistas de Evening Star en el gráfico: señal de flecha roja en el gráfico (ver imágenes) Se incluyen alertas para PC, dispositivos móviles y correo electrónico También está disponible su hermano, el indicador alcista "patrón Morning Star" (siga los enlaces a continua

Volatility Range is an indicator that calculates the range of volatility, predicting key levels such as potential resistance above and potential support below. The indicator can display volatility forecast ranges for the latest 50 days, 10 weeks, or 4 months. By observing these ranges, you can better identify reliable levels where combining with price action enhances trade accuracy significantly.
You have the option to fill the rectangle area with color for easier observation, or leave it unf

Price Action Scanner is an indicator that identifies price behaviors and provides alerts. This indicator can simultaneously detect signals for up to 6 different symbols across various timeframes. By setting a separator, you can add different symbol names and timeframes.
The indicator can detect multiple common signal types such as Pinbar, Engulfing Pattern, Inside Bar, Morning Star, Evening Star, Fakey, and display corresponding information in separate subcharts, indicating the direction of t

Price Action Scanner Pro is an indicator that identifies price behaviors and provides alerts, offering more features and customization compared to Price Action Scanner ( https://www.mql5.com/zh/market/product/118937?source=Site+Profile+Seller ) . This indicator can simultaneously detect signals for up to 15 symbols across different timeframes. You can configure it to detect signals during specific trading sessions such as Asian, European, and US sessions, using different timeframes. This

The Radiant Trend indicator calculates the saturation levels of the price chart. A signal to exit the oversold zone indicates a buy, and a signal to exit the overbought zone indicates a sell. For this indicator, it is usually necessary to set relative values for the overbought and oversold levels – Bottom and Top.
Often a good trend can be seen visually on the price chart. However, an experienced trader must clearly understand the current market situation before opening a position. The indi

The Candlestick Pattern Detector is an advanced MetaTrader 4 indicator designed to identify and highlight candlestick patterns on your charts. Currently, the indicator detects one specific candlestick pattern - the pinbar, known for its significance in technical analysis and trading strategies. This tool provides traders with visual cues, making it easier to spot potential market reversals or continuations. Features: Customizable Colors: Users can customize the colors of the bullish and bearish
Working with the Channel Motion Tracker indicator is as simple as possible. Just react to the arrows that the indicator displays. Each arrow represents an explicit command to action. The signals generated by this indicator are accurate enough to allow you to trade based on this information.
One of the main advantages of the indicator is its ability to build high-quality channels and generate signals for entering the market. This is great for the trader who always finds it difficult to choose

The Geliosx indicator is designed to visually display the trend. One of the key tasks when monitoring the currency market is to determine the trend - a stable direction of price movement. Geliosx uses special calculations to smooth out sharp fluctuations that do not have a significant impact on the overall picture of the price movement.
This indicator is created for those who value their time and money.
The trend can be ascending (bull trend) or descending (bear trend). Typically, the trend
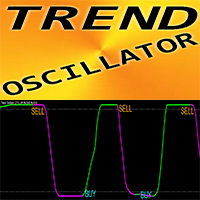
Trend Oscillator: es un indicador personalizado avanzado y una herramienta comercial eficiente.
Se utiliza un nuevo método de cálculo avanzado: 20 opciones para el parámetro "Precio para el cálculo" El oscilador más suave jamás desarrollado Color verde para tendencias al alza, color rojo para tendencias a la baja Valores de sobreventa: por debajo de 5; Valores de sobrecompra: más de 95 Hay muchas oportunidades para mejorar incluso las estrategias estándar con este indicador. con alertas de PC

Support and Resistance Levels is an intelligent indicator that displays horizontal support and resistance levels, suitable for traders of different trading frequencies. You can select your preferred trading frequency, and the indicator will automatically calculate the support and resistance levels relevant to that frequency. Among these, the Bull-Bear Line is an interval used to distinguish the strength of bullish and bearish forces, and is an important level.
You can combine it with other in
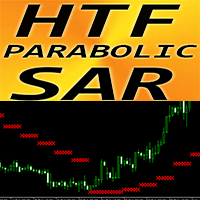
Indicador Forex Parabolic SAR Marco de tiempo más alto para MT4
Actualice sus métodos comerciales con un excelente indicador auxiliar HTF PSAR para MT4. HTF significa - Marco de tiempo más alto PSAR se utiliza para determinar la dirección de la tendencia y posibles reversiones en el movimiento de precios. Este indicador es excelente para usar con fines de Trailing Stop Si el PSAR se encuentra por encima del precio, es una tendencia a la baja. Si el PSAR se encuentra por debajo del precio, es

Product Description: Precision Pattern Indicator for Consistent Profits Elevate your trading with the Precision Pattern Indicator, an advanced tool designed to spot a highly profitable and specific trading pattern. This indicator is your key to unlocking consistent profits with minimal effort. Key Features: Accurate Entry Signals: Receive clear entry signals with green arrows for buy opportunities and red arrows for sell opportunities, ensuring you never miss a profitable trade. Defined Risk Man

The Arriator forex indicator algorithm allows you to quickly determine the current trend in the market. The Elephant indicator accompanies long-term trends and can be used without restrictions on instruments or timeframes. This indicator not only helps predict future values, but also generates buy and sell signals. It tracks market trends, ignoring wild swings and market noise around the average price. The indicator implements a type of technical analysis based on the idea of market cyclicalit
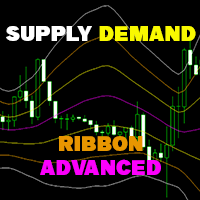
Supply Demand Ribbon is an indicator with moving supply and demand lines that help you identify price zones more easily.
The indicator helps you determine flexible entry, stop loss, and take profit areas.
There are also strategies for algorithmically changing ribbon colors.
From there you can come up with many trading strategies for yourself! You can try the Basic version here ! MT5 version: Click here! Feature in Advanced version: Hide/Show 2 Supply/Demand Over lines. Hide/Show 2

ANDROMEDA indicator
Welcome back to our page!
The Andromeda indicator is a new creation.
This indicator works on H1.
Each signal ensures a minimum quantified profit of 5, 10 pips. For higher profits, support - resistance lines, TMA bands, Bollinger, etc. are used.
The only problem is the news. The remedy for this is the Stop Loss.
White up and down arrows indicate signals to buy and sell, respectively.
Success!

Lyre Histogram
Welcome back to our page.
The Lyre Histogram indicator is created for the M15 and M5 timeframes and for all pairs.
White bars indicate buy signal. Yellow bars indicate sell signal.
Please note the images below.
A demo download is indicated beforehand.
If the indicator does not appear, read my comment in the comment section.
thank you
I wish you much success!

The Sirius X indicator reliably tracks market trends, ignoring wild swings and market noise. Suitable for trading on any timeframe, effectively filtering sudden price spikes and corrections by reducing market noise around the average price. For calculations, the indicator uses iLow, iHigh, iMA and iATR. The output based on these reliable indicators is also reliable. You can set up a sound signal and notifications, for example by email. The indicator does not redraw and works stably.
Configura
To download MT5 version please click here .
- This is the exact conversion from TradingView: "Chandelier Exit" By "everget". - This is a non-repaint and light processing load indicator - input options related to coloring and labels are removed to fit into MetaTrader graphics. - Buffers are available for processing within EAs. - You can message in private chat for further changes you need.
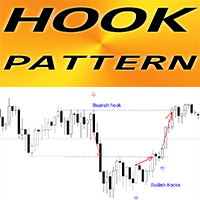
Indicador Forex "Patrón de gancho" para MT4
El indicador "Patrón de gancho" es un indicador muy poderoso para el comercio de acción del precio: sin repintado, sin demoras; El indicador detecta patrones Hook alcistas y bajistas en el gráfico: Gancho alcista: señal de flecha azul en el gráfico (ver imágenes) Gancho bajista: señal de flecha roja en el gráfico (ver imágenes) Se incluyen alertas para PC, dispositivos móviles y correo electrónico El indicador "Patrón de gancho" es bueno para combin
FX Strength Meter Pro es un poderoso indicador diseñado para traders que buscan oportunidades óptimas de trading en el mercado de divisas. Nuestro indicador muestra en tiempo real la fuerza relativa de los principales pares de divisas (USD, EUR, GBP, CHF, AUD, NZD, JPY, CAD), ayudándote a identificar rápidamente las monedas más fuertes y débiles para mejorar tu estrategia de trading.
Las características principales incluyen:
- Soporte multi-timeframe: Desde gráficos de minutos hasta mensual
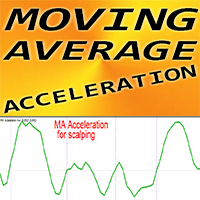
Indicador Forex MA Aceleración para MT4, sin repintado.
MA Acceleration: es un indicador de especulación, diseñado como herramienta auxiliar para el indicador "MA Speed"
El cálculo de este indicador se basa en ecuaciones de la física. Le mostrará la aceleración de la línea de media móvil. Hay muchas oportunidades para actualizar incluso las estrategias estándar con MA Acceleration. Es posible utilizarlo para SMA, EMA y LWMA. La configuración del indicador es muy sencilla. El indicador de ac

¿Cansado de navegar en los mares de incertidumbre del mercado financiero? Imagina tener a un guía experimentado a tu lado, ayudándote a desentrañar los misterios de los gráficos y conduciéndote con seguridad hacia el éxito financiero . Con StakBank , tendrás en tus manos más que un simple indicador. Tendrás un arsenal completo de herramientas para tomar decisiones asertivas y rentables . Pero, ¿qué hace que StakBank sea tan especial? Volumen: Comprende la fuerza motriz detrás de los movimientos
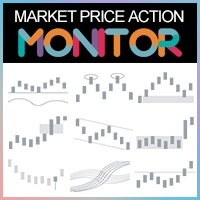
Why do I need to use the Market PA Monitor:
1.It is impossible to monitor multiple varieties and multiple TF of the market.
The market situation is constantly changing, with numerous varieties, and each variety has different timeframe from small to large. Each TF contains different market changes and trend alternations. Under numerous varieties and multiple TFs, there are countless trading opportunities every day. However, an ordinary trader cannot detect the trading opportunities of each v
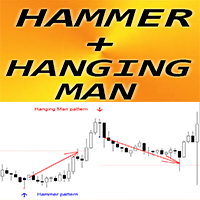
Indicador Forex "Patrones de martillo y hombre colgado" para MT4
El indicador "El martillo y el ahorcado" es un indicador muy potente para el comercio de acción del precio: sin repintado, sin retrasos; El indicador detecta patrones alcistas de Martillo y bajistas del Hombre Colgado en el gráfico: Martillo alcista: señal de flecha azul en el gráfico (ver imágenes) Hombre ahorcado bajista: señal de flecha roja en el gráfico (ver imágenes) con alertas para PC, móvil y correo electrónico El indic

Golden Range 2 is one of the top entry indicators securing its future with its results. Indicator settings: Points = how precise pattern detection is AlertConfirmation = turn on(true) off(false) alert CalculatedBars = how many bars will be calculated
Please leave Positive comments, reviews. Buffer 0 Buy Arrow, Buffer 1 Sell Arrow, Buffer2 Buy Signal(Value:1/0), Buffer3 Sell Signal(Value:1/0) Buy Green, Sell Red
Powerful Order Block indicator in Tradingview platform. Indicator type: Price Action indicator Introduction: The Order Block Indicator - Elevating Your Price Action Analysis. If you're seeking a comprehensive Order Block indicator on the MQL5 platform, look no further.
Firstly, according to this indicator, an OB is understood as a zone of pending orders from large institutions that haven't been fully executed, revealing themselves in the market through subtle signs. Prices react strongly wh
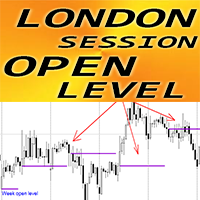
Indicador Forex "Nivel abierto de sesión de Londres" para MT4
El indicador "Nivel de apertura de sesión de Londres" es un indicador auxiliar muy útil para el comercio intradiario. El nivel de precio de apertura de la sesión es muy importante porque muy a menudo el precio regresa a esa zona durante el día. El indicador muestra el nivel de precio de apertura de la sesión de Londres diariamente para cada día También el indicador muestra el nivel de apertura semanal los lunes. Es útil para los op
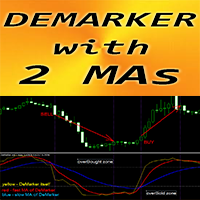
Indicador Forex "DeMarker y 2 medias móviles" para MT4
La curva del oscilador DeMarker indica la posición actual del precio en relación con los máximos y mínimos anteriores durante el período de cálculo del indicador. El indicador "DeMarker y 2 medias móviles" le permite ver las medias móviles rápidas y lentas del oscilador DeMarker Es fantástico aceptar entradas de Venta de la zona de Sobrecompra (por encima de 0,7) y entradas de Compra de la zona de SobreVenta (por debajo de 0,3). El indica

The Listo trend direction indicator shows the current trend direction by coloring the bars in red and blue. It is suitable for all currency pairs and timeframes. It is important to remember that to enter the market it is necessary to take into account an integrated approach and additional signals. The operating principle of the indicator is based on automatically determining the current state of the market and analyzing historical data when placing it on a chart.
The Fractal LVL AM indicator analyzes the price patterns that form on the candlestick chart and display the turning points of the market trend. A fractal consists of candles, the middle of which is either the highest (upward fractal) or the lowest (downward fractal) of all the candles taken for analysis. Unlike the original indicator where fractals are formed by five candles (maximum/minimum in the center and two candles with smaller/larger maximum/minimum values on each side), the proposed ve
The presented indicator is a development of the ideas contained in the Bulls or Bears AM indicator. This indicator displays the difference between the maximum and minimum prices for the current period of time and the values of the channel built using the maximum and minimum prices for a longer period. An increase in indicator values above zero indicates that the maximum price for the current period is greater than the average value of the maximum prices for the period selected as an indicato
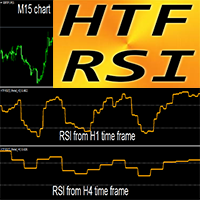
Indicador Forex HTF RSI Oscilador para MT4
El propio RSI es uno de los mejores y más populares osciladores. HTF significa: Marco de tiempo más alto. La zona de sobrecompra es cuando el RSI está por encima de 70 y la de sobreventa, cuando está por debajo de 30. RSI proporciona información sobre el impulso de precios alcista y bajista Este indicador es excelente para sistemas de comercio de marcos de tiempo múltiples con entradas de acción de precio o en combinación con otros indicadores. El in

Gann Angles Indicator The Gann Angles Indicator is a powerful technical tool based on the theory of William Delbert Gann. It helps traders identify potential support and resistance levels, as well as trend direction across various time intervals. Key features: Automatic determination of extremum within a specified time range Construction of 9 Gann Fan lines with angles of 82.5, 75, 71.25, 63.75, 45, 26.25, 18.75, 15, and 7.5 Flexible line color customization Adaptation to both upward an

Get rid of trading confusion and embrace stable income! Are you still worried about finding a low-risk and stable profit method? Are you still anxious about judging the market direction and controlling the risk of placing orders? The new cross-platform arbitrage indicator helps you easily achieve stable returns! Accurately capture arbitrage opportunities without you having to worry! The cross-platform arbitrage indicator is a powerful tool that can monitor the price differences of the same finan
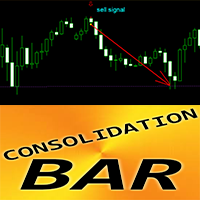
Patrón de barra de consolidación de indicadores Forex para MT4
El indicador "Barra de consolidación" es un indicador muy potente centrado en la ruptura para el comercio de acción del precio. El indicador detecta la consolidación de precios en un área estrecha durante 1 barra y muestra: dirección de ruptura, orden pendiente y ubicaciones de SL Barra de consolidación alcista: señal de flecha azul en el gráfico (ver imágenes) Barra de consolidación bajista: señal de flecha roja en el gráfico (ve
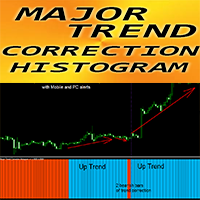
Indicador Forex "Histograma de corrección de tendencia principal" para MT4
El indicador de histograma de corrección de tendencia principal fue diseñado para detectar grandes tendencias El indicador puede estar en 2 colores: rojo para tendencia bajista y azul para tendencia alcista (los colores se pueden cambiar) Al menos 10 columnas consecutivas del histograma del mismo color significan el comienzo de una nueva tendencia El indicador tiene alertas integradas para dispositivos móviles y PC Par
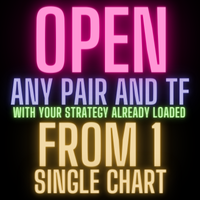
¿Estás cansado de cambiar entre múltiples gráficos para monitorear diferentes pares de divisas y marcos de tiempo? ¡El indicador Pairs and TF Changer está aquí para revolucionar tu experiencia de trading! Una vez que hayas cargado todos los indicadores para tu estrategia, agrega Pairs and TF Changer al gráfico. Si es necesario, puedes ajustar su posición, colores o el número de columnas que muestra. Características principales: Integración sin interrupciones: Integra este indicador en tu estrate
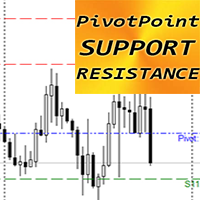
Indicador Forex "Resistencia de soporte del PUNTO PIVOT" para MT4
El indicador "Resistencia de soporte del punto de pivote" es un indicador auxiliar muy poderoso para el comercio de acción del precio. Los niveles de pivote se calculan como un promedio de precios significativos del desempeño de un mercado en el período de negociación anterior. Los niveles de pivote en sí mismos representan los niveles de mayor resistencia o soporte, dependiendo de la condición general del mercado. El indicador
High precision indicator
Welcome back!
This indicator was created for the M5 timeframe.
I recommend a TP = 10 pips. But it can be even bigger. This indicator has the potential to trigger much longer trades.
It is a histogram indicator.
Analyze the images and experience it demo.
If the indicator doesn't show, read my comment in the comments section.
I wish you successful trading!
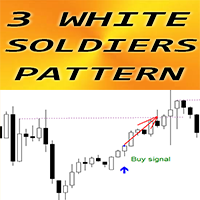
Indicador Forex "Patrón de 3 soldados blancos" para MT4
El indicador "Patrón de los 3 soldados blancos" es muy poderoso para el comercio de acción del precio: sin repintado, sin demoras; El indicador detecta patrones alcistas de 3 Soldados Blancos en el gráfico: señal de flecha azul en el gráfico (ver imágenes) Se incluyen alertas para PC, dispositivos móviles y correo electrónico También está disponible su hermano, el indicador bajista "Patrón de 3 Cuervos Negros" (siga los enlaces a continu

Misio - can be used as an independent trading system. The indicator determines the market trend, ignoring sharp fluctuations and noise around the average price. It displays the trending movement with potential stop points.
Simple, clear and effective use. The indicator does not redraw and does not lag. Suitable for all currency pairs and all timeframes.
Interpretation:
The location of the rate above or below the shadows indicates the presence of a trend. A move into the shadows signals a
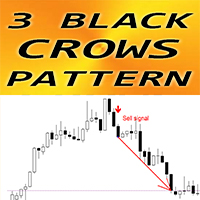
Indicador Forex "Patrón de 3 cuervos negros" para MT4
El indicador "Patrón de los 3 Cuervos Negros" es muy poderoso para el comercio de Acción del Precio: sin repintado, sin demoras; El indicador detecta 3 patrones bajistas de Black Crows en el gráfico: señal de flecha roja en el gráfico (ver imágenes) Se incluyen alertas para PC, dispositivos móviles y correo electrónico También está disponible su hermano, el indicador alcista "Patrón de 3 soldados blancos" (siga los enlaces a continuación)
Argo indicator
Argo indicator is specially created for the M5 timeframe.
The indicator also works on longer time frames, but the signals are rare.
The marker does not repaint.
I recommend a minimum TP of 5, 10 pips for M5.
This indicator is similar to Fantastic indicator, but it is built on a different model.
Analyze the images below.
If the indicator doesn't show, read my comment in the comments section.
Success!

Arrows H1
Welcome back to our page!
This indicator is created for the range H1. It works better for EURUSD and EURJPY pairs. The marker does not repaint.
Combined with other indicators increases the success rate.
Look at the pictures.
The white sign with the tip pointing up indicates the trigger of the operation to buy. And the white sign with the tip facing down, indicates the trigger of the operation to sell.
Of course a demo download is indicated beforehand.
If the indicator do
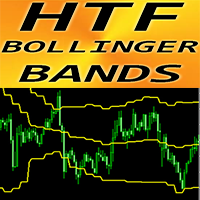
Indicador Forex "Bandas de Bollinger HTF" para MT4
Actualice sus métodos comerciales con el indicador profesional "HTF Bollinger Bands" para MT4. HTF significa - Marco de tiempo más alto Las Bandas de Bollinger son uno de los mejores indicadores del mercado: una herramienta perfecta para operar Aproximadamente el 90% de la acción del precio ocurre entre las dos bandas. El indicador HTF Bollinger Bands es excelente para sistemas de comercio de marcos de tiempo múltiples con entradas de acción
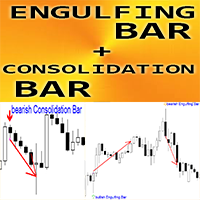
Indicador Forex "Patrones de barra envolvente y barra de consolidación" para MT4
El indicador "Patrones de barra envolvente y barra de consolidación" es muy poderoso para el comercio de acción del precio El indicador detecta barras envolventes y barras de consolidación en el gráfico: Patrón de barra envolvente alcista: señal de flecha verde en el gráfico Patrón de barra envolvente bajista: señal de flecha naranja en el gráfico Patrón de barra de consolidación alcista - Señal de flecha azul en

To get access to MT5 version please click here . This is the exact conversion from TradingView: " WaveTrend" by LazyBear.
This is a light-load processing and non-repaint indicator. All input options are available. Buffers are available for processing in EAs. You can message in private chat for further changes you need. The filling area option is omitted to fit into MT4 graphics.
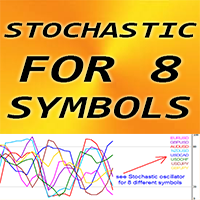
Indicador Forex "Estocástico para 8 símbolos" para MT4.
El oscilador estocástico es uno de los mejores indicadores del mercado y es una herramienta perfecta para muchos traders. Zona de sobrecompra: por encima de 80; Uno sobrevendido: menos de 20 Es fantástico aceptar entradas de venta de zonas superiores a 80 y entradas de compra de zonas inferiores a 20. "Estocástico para 8 símbolos" brinda la oportunidad de controlar los valores estocásticos de hasta 8 símbolos diferentes en 1 gráfico Este

El indicador "GoTrend Multi-Timeframe" es una herramienta imprescindible para los traders que buscan una forma rápida y eficiente de evaluar la tendencia general y específica de un par de divisas en diferentes marcos de tiempo. Este indicador permite a los traders obtener una visión clara y completa de la dirección del mercado con tan solo un vistazo, optimizando así su toma de decisiones y mejorando la efectividad de sus estrategias de trading. Características Principales: Análisis Multimarcos

Trend oscillator indicator for tracking microtrends and pullbacks. Determines even a minor change in trend . Allows you to open positions in a timely manner in accordance with market changes. Works on all timeframes, all currency pairs, metals, indices and cryptocurrencies. Can be used when working with binary options. Distinctive features Does not redraw after the candle closes; Accurately detects trend changes; Simple and clear setup; Works on all timeframes and all trading instruments; Suit

Pipwise Indicators Multiple MAs The Pipwise Indicators Moving Averages indicator is a powerful tool for technical analysis in MetaTrader 4 (MT4). It allows traders to visualize and analyze moving averages from multiple periods on a single chart. Here are the key features:
Customizable Moving Averages: Traders can choose the number of moving averages to plot (up to 9 MAs). Each Moving Average is customiseable.
Method Selection: The indicator supports various moving average methods, includin

The Accelerator Oscillator (AC) technical indicator measures the acceleration or deceleration of the current market strength. It is designed to identify potential trend reversal points and is used to determine the moment of buying or selling assets. The indicator helps traders make decisions based on changes in market dynamics. This implementation of the indicator is its creative version. Since the standard version is very limited by its built-in settings, this implementation has significantly
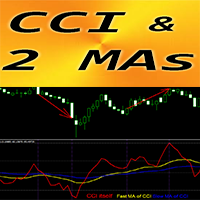
Indicador Forex "CCI y 2 medias móviles" para MT4
El Commodity Channel Index (CCI) es excelente para operar con Momentum en la dirección de la tendencia. El indicador "CCI y 2 medias móviles" le permite ver las medias móviles rápidas y lentas del indicador CCI Tendencia alcista: la MA rápida está por encima de la lenta; Tendencia a la baja: la MA rápida está por debajo de la lenta CCI es uno de los osciladores más populares para operar: mide la diferencia entre el precio actual y el precio pr

Installation MetaTrader 4 Download: Download the provided file PrecisionStopDemo.ex4. Copy the File: Open MetaTrader 4. From the top menu, click on File > Open Data Folder. Navigate to MQL4 > Indicators. Copy the file PrecisionStopDemo.ex4 into this folder. Restart MetaTrader: Close and reopen MetaTrader 4. Add Indicator to Chart: In the Navigator (Ctrl+N), expand the Indicators folder. Find the indicator PrecisionStopDemo and drag it onto the desired chart.
Configuration After adding the i

¿Cansado de navegar en el mar de incertidumbres del mercado financiero? Imagina tener un guía experimentado a tu lado, ayudándote a desentrañar los misterios de los gráficos y conduciéndote con seguridad hacia el éxito financiero. Con StakBank, tendrás en tus manos más que un simple indicador. Tendrás un arsenal completo de herramientas para tomar decisiones asertivas y rentables. Pero, ¿qué hace a StakBank tan especial? Volumen: Comprende la fuerza motriz detrás de los movimientos del mercado,

Key Features: Pattern Recognition : Identifies Fair Value Gaps (FVGs) Spots Break of Structure (BOS) points Detects Change of Character (CHoCH) patterns Versatile Application : Optimized for candlestick charts Compatible with any chart type and financial instrument Real-Time and Historical Analysis : Works seamlessly with both real-time and historical data Allows for backtesting strategies and live market analysis Visual Representation : Draws rectangles to highlight significant areas on the cha

Indicador Perfil de Volumen para MT4 Obtén una ventaja en el trading con el indicador "Perfil de Volumen" para MetaTrader 4 (MT4). Esta herramienta avanzada de análisis técnico te permite identificar con precisión niveles clave de soporte y resistencia basados en el volumen de transacciones. Visualiza fácilmente las áreas de mayor interés del mercado, donde los volúmenes de negociación son más altos, y utiliza esta información para tomar decisiones de trading más informadas. Características prin
This indicator is a classic indicator of technical analysis - MACD. Unlike the classic MACD indicator, the presented indicator is calculated as follows: - the first smoothing signal is one of the standard methods used to create moving averages. - secondary smoothing method used in MAMA/FAMA indicators. - calculation of the difference between MAMA/FAMA values.
The indicator gives signals about a change in trend direction, as well as signals about weakening or strengthening of the trend. The ind

Insight Pro is a comprehensive tool for market analysis. It offers various features such as trend analysis, resistance and support levels, and distribution analysis, suitable for both novice and experienced traders. Features Trend Analysis Detects and visualizes market trends. Suggests potential entry and exit points based on trends. Customizable trend lines for clear market direction. Displays extreme levels based on standard deviation. Positive slope indicates buy orders; negative slope indic
Lossless M1 signal A
The indicator is created for M1.
The signals are very rare, but I consider them safer.
Look at the pictures.
The white arrow indicates the trigger of the operation to buy. And the yellow arrow indicates the trigger of the operation to sell.
Of course a demo download is indicated beforehand.
If the indicator doesn't show, read my comment in the comments section.
Success!
Presentación del "Color Range Indicator" El "Color Range Indicator" es una poderosa herramienta de análisis técnico diseñada para la plataforma MT4, ideal para traders que desean tener una visión clara e inmediata de las tendencias del mercado. Este indicador dibuja una línea de color en función de la tendencia actual, facilitando la interpretación de los movimientos de precios. Descripción del indicador: Línea verde : Indica una tendencia alcista. Utilice esta señal para considerar oportunidade
¿Sabe usted por qué MetaTrader Market es el mejor lugar para vender estrategias comerciales e indicadores técnicos? Con nosotros, el desarrollador no tiene que perder tiempo y fuerzas en publicidad, protección del programa y ajustes de cuentas con los compradores. Todo eso ya está hecho.
Está perdiendo oportunidades comerciales:
- Aplicaciones de trading gratuitas
- 8 000+ señales para copiar
- Noticias económicas para analizar los mercados financieros
Registro
Entrada
Si no tiene cuenta de usuario, regístrese
Para iniciar sesión y usar el sitio web MQL5.com es necesario permitir el uso de Сookies.
Por favor, active este ajuste en su navegador, de lo contrario, no podrá iniciar sesión.