YouTubeにあるマーケットチュートリアルビデオをご覧ください
ロボットや指標を購入する
仮想ホスティングで
EAを実行
EAを実行
ロボットや指標を購入前にテストする
マーケットで収入を得る
販売のためにプロダクトをプレゼンテーションする方法
MetaTrader 4のためのテクニカル指標 - 135

Subscribe to the 'MA7 Trading' channel to receive notifications about new programs, updates and other information. Ask questions in the profile on the MQL5 .
Description of work
The 'MA7 Agave' indicator is based on the standard Average Directional Movement Index (ADX) indicator. Shows the intersection of the +DI and -DI lines. Detailed information about the 'MA7 Agave' indicator.
Indicator settings
General settings: ADX period - Average Directional Movement Index indicator period.
'MA7

This indicator is based on chart with specialty in volume, it clearly shows where the buying and selling force.
Note on images:
Settings and adjustments to the colors you prefer.
Being able to see the price that the market is at at the exact moment.
Able to accept more indicators in the same window, such as Bollinger Bands, Ma, Stochastic, MACD and many others that adapt to your best configuration.
SEEDER_Volume1 Mt4 indicator can be used on all types of charts, including RENKO c
Exclusive Limited Time Offer! Grab this powerful indicator for a lifetime at just $65. Open the power of precise decision-making with our revolutionary product, FX Correlation Matrix. This indicator is your key to understanding multiple FX currency pairs' positive and negative correlations at a glance, providing valuable insights to elevate your trading strategies.
Indicator Features:
Multiple-Frame Multi-Currency Dashboard: Displays 10 multiple currency pairs positive and negative correlati
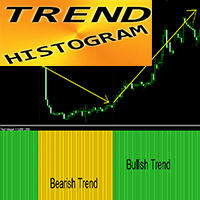
MT4用FXインジケーター「TRENDヒストグラム」
TREND ヒストグラム インジケーターは、標準的な MA クロスよりもはるかに感度が高く、効率的です。 インジケーターは 2 色で表示できます: 弱気トレンドの場合は黄色 (金色)、強気トレンドの場合は緑 (色は設定で変更可能) TREND ヒストグラムにはモバイルおよび PC アラートが組み込まれています このインジケーターを他の取引方法(プライスアクション、VSA、その他のインジケーター)と組み合わせるのは素晴らしいアイデアです。
// さらに優れたエキスパートアドバイザーとインジケーターはここから入手できます: https://www.mql5.com/en/users/def1380/seller // また、収益性が高く、安定していて信頼性の高いシグナル https://www.mql5.com/en/signals/1887493 に参加することも歓迎します。 当MQL5サイトのみでご提供しているオリジナル商品です。

Fair Value Gap is and MT4 Non Repaint and Non Lagging indicator which give alerts upon a signal is detected. It can be used for both scalping and swing trading.
The indicator is based on Trend following strategy and inbuilt trading algorithms of pure price action
Has alerts and also push notifications to your phone with signals to buy or sell.
Works on all Time-frames and MT4 brokers. It is as well a Multi-Currency Indicator, including Gold, Nasdaq and US30 pairs
Take advantage of this wo

Информационный индикатор, показывающий самые важные торговые уровни для внутридневной торговли, и не только. О понятии уровней «Поддержка» и «Сопротивление».
Всем известно, что исторический ценовой диапазон цен состоит из уровней от которых в прошлом, были значимые движения.
И уровни работающие в прошлом, наверняка будут работать и сейчас. К примеру, уровень, находящийся снизу текущей цены
является уровнем «Поддержки», если от него ранее было значительное движение. К примеру, уровень,
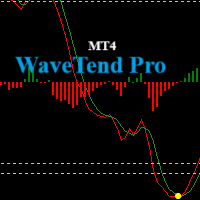
Introducing the Wave Trend Oscillator Indicator for MetaTrader 4(MT4). Our carefully designed oscillator leverages wave trend analysis principles to track market trends accurately. It assists traders in identifying potential buying and selling points based on market wave patterns, allowing you to stay informed. Key Features: Divergence Detection : Spot potential reversals in the market. Intermediate Level Crosses : Gain granular insights into market trends. Please note: The indicator states are
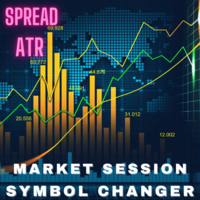
マーケットイージーインジケーター
マーケットイージーインジケーターは、トレーダーが1つの画面で異なる通貨ペア間を便利に切り替えることを可能にするインジケーターです。このEA(エキスパートアドバイザー)には市場セッション、スプレッド、ATRなど、トレーダーアナリシスを容易にするための複数の機能が組み込まれています。
マーケットイージーインジケーターを使用すると、複数のタブを開かなくても簡単に取引でき、チャート画面がよりクリーンで分析しやすくなります。
他のトップEAおよびインジケーター: https://www.mql5.com/en/users/lothimailoan/seller
主な特徴:
1. 1クリックで異なるペアのチャートを開く このインジケーターでは、クリック一つでペアを設定し、チャートを開くように構成できます。市場監視タブを繰り返し開く必要がなくなります。
2. オートドローの市場セッション インジケーターは、カスタマイズ可能なカラーボックスを使用してアジア、ロンドン、ニューヨークの時間枠を描画します。この機能により、セッションがアクティブ
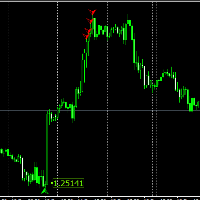
For those who have followed my FCK Quantum Scalping thread know about the FCK Quantum Scalping indicator and have taken the indicator to different levels (Mastermind) to suit his or her trading style. In this system, the Quantum indicator is only for showing us trading entries, and that’s it. Targets and stop levels are a little later. For those who don’t know what the FCK Quantum Scalping indicator is, I’ll tell you. The FCK Quantum Scalping indicator is basically a modified Wave indicator

Subscribe to the 'MA7 Trading' channel to receive notifications about new programs, updates and other information. Ask questions in the profile on the MQL5 .
Description of work
The 'MA7 Flax' indicator is based on the standard Average True Range (ATR) indicator and candle data. Shows candles that are larger in size relative to the ATR indicator value. Detailed information about the 'MA7 Flax' indicator.
Indicator settings
General settings: ATR period – Average True Range indicator period
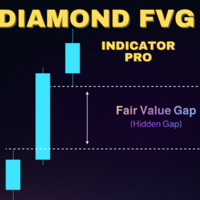
FVG(フェアバリューギャップ、ヒドゥンギャップ、アンバランス)は、三つのローソク足の間に現れる低ボリュームの価格帯を指します。
詳細なエキスパートアドバイザーやインジケーターについては、こちらを参照してください: https://www.mql5.com/en/users/lothimailoan/seller 私はロスです、もっとアップデートを受け取るにはこちらを購読してください: https://www.mql5.com/en/users/lothimailoan/news
1/ WRB-Hidden-Gapの理解:
このインジケーターでは、まず「ワイドレンジボディ(WRB)」と呼ばれる大きなボディを持つローソク足を最初に識別し、「」で表示します。ワイドレンジボディの条件は、「次のローソク足のボディが過去3本のローソク足のボディよりも大きい」ことです。識別されたWRB内で、もしローソク足にフェアバリューギャップがあれば、水平に青いゾーンが表示されます。
ゾーンは完全に埋まると停止します。
これはFVGの分析が簡単な優れたインジケーターです。
2/ パラ
MT4用FXインジケーター「MA with Dynamic Borders」
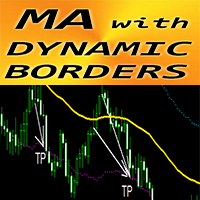
インジケーターには移動平均に関連付けられた独自の機能があります - ダイナミックボラティリティボーダー ダイナミック ボラティリティ ボーダーは計算に平均トゥルー レンジ値を使用します このインジケーターは、テイクプロフィットのターゲット設定とボーダーラインでの SL の配置に最適です インジケーターはプライスアクションエントリーとの組み合わせにも優れています
// さらに優れたエキスパートアドバイザーとインジケーターはここから入手できます: https://www.mql5.com/en/users/def1380/seller // また、収益性が高く、安定していて信頼性の高いシグナル https://www.mql5.com/en/signals/1887493 に参加することも歓迎します。 当MQL5サイトのみでご提供しているオリジナル商品です。

RaysFX Donchian Channel
Questo indicatore può essere utile per identificare i livelli di supporto e resistenza, nonché per visualizzare visivamente la gamma di prezzo di un determinato periodo. Variabili Valore Periodo 20 TimeFrame Current Mode High/Low(true) o Close (false) Modalità true Telegram: https://t.me/SmartSaverOfficial Store: https://www.mql5.com/it/users/rays96/seller
Questo indicatore è stato Progettato da RaysFX

Metatrader 4 の Super Arrow Forex Signal インジケーターは、チャート上に正確な売買矢印を印刷する完全な FX 取引システムです。
このインジケーターは、メインの MT4 チャート ウィンドウに緑と赤の色の矢印として表示されます。
インジケーターが示す信号に従ってください。
トレードシグナル:
緑色の矢印は買いシグナルです。 赤い矢印は売りシグナルです。 スーパーアロー外国為替シグナルインジケーターは、トレードエントリーとトレードエグジットの両方に、または他の戦略やシステムのトレンド確認シグナルインジケーターとして使用できます。
このインジケーターはすべての通貨ペア(メジャー、マイナー、エキゾチック)で同様に機能し、正しく使用されれば有望な結果を示します。
取引のヒント:
Super Arrow Forex Signal インジケーターを使用して、独自のお気に入りのトレードエントリー、ストップロス、テイクプロフィットの方法を自由に使用して取引できます。
いつものように、全体的な傾向に合わせてトレードし、この指標を完全

Indicator for determining the direction of the current trend Sends signals about trend changes to the terminal, smartphone and email Allows you to quickly navigate when changing price direction Works on all timeframes, on any currency pairs, metals and cryptocurrencies Can be used when working with binary options Distinctive features Doesn't redraw Gives three types of signals Has simple settings Quickly adapts to any trading instrument; Works on all timeframes and all symbols; Suitable for trad
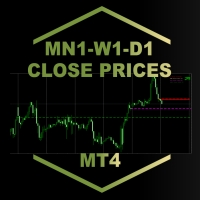
MN1-W1-D1 Close Price Indicator to Index Trading for MT4
The indicator draws lines to the close prices of the last closed bars of monthly, weekly and daily timeframes. Observably, these prices are significant support and resistance prices at major indices, like Nasdaq, DAX. The info panel always shows the prices relative to each other in the correct order. If the current price is the highest - i.e. higher than the last monthly, weekly and daily closing price - it is in the first row. The lowest
mt4 (Metatrader 4) の Scalper Signal Tarek インジケーターは、日足チャートでも、あらゆる時間枠であらゆる通貨ペアのスキャルピング シグナルを提供します。
このインジケーターは非常に信頼性が高く、軽量であり、取引プラットフォームの速度を低下させることはありません。
シグナルは、メインの MT4 チャート ウィンドウに緑と赤の色のシグナル矢印の形で表示されます。
売買シグナル:
緑色の矢印がチャートに表示されたら、買いポジションをオープンします。 チャートに赤い矢印が表示されたら売りポジションをオープンします。 取引ごとに 7 ~ 40 ピップスの利益を目指します (選択した時間枠によって異なります)。 Scalper Signal Tarek インジケーターは、トレードのエントリーとエグジットの両方に、または追加の短期トレンドフィルターとして使用できます。
このインジケーターはすべての通貨ペア(メジャー、マイナー、エキゾチック)で同様に機能し、正しく使用されれば有望な結果を示します。
取引のヒント:
Forex Sca

The Limiter One of the helpful tool to identify the limits of HH, HL, LH and LL easily, The Limiter is only a auxiliary tool and not a complete trading system, The market changes his psychology every week, day and sometimes every hour, for that there's no fixed default values and you must use the tuners settings and change the values, and use the limiter as you need, it's very simple customized tool, you can use it with any kind of indicators to have the best entry Recommend to use it on H1 bu

Miko Trend is a hybrid trend indicator, as it is based on signals from elementary indicators and a special algorithm for analysis. The indicator shows favorable moments for entering the market. The indicator's intelligent algorithm determines the trend, filters out market noise and generates input signals.
The indicator can be used primarily to determine the trend. The indicator can work both for entry points and as a filter. Uses two parameters for settings. The indicator uses color signalin

RaysFX TMAT3 è uno strumento potente che combina due tipi di medie mobili per aiutarti a identificare e seguire le tendenze del mercato. L’indicatore utilizza una media mobile triangolare centrata (TMA) e un T3 Moving Average. Queste due medie mobili lavorano insieme per fornire segnali di trading chiari e tempestivi. Quando il T3 Moving Average è inferiore alla TMA, l’indicatore considera che la tendenza del mercato sia al rialzo e genera un segnale di acquisto. Al contrario, quando il T3 Movin
The Ruby Trend indicator calculates the saturation levels of the price chart. A signal to exit the resale area is a buy signal. A signal to exit the overbought area is a signal to sell. Usually you need to set relative values for the overbought and oversold levels Bottom and Top for this indicator.
Most often, a good trend is visible visually on the price chart. But an experienced trader must clearly understand the current balance of power in the market before entering. And the indicator will
Embrace the Power With Ultimate Trend Trader Indicator. Facing the reality of individual traders, we are far from harnessing the capabilities of AI and high-frequency trading algorithms that dominate today's markets. Without access to massive data centers or infrastructure to compete on microseconds, the battle seems skewed. Yet, the true advantage lies not in technological arms but in leveraging human intellect to outsmart the competition. The Ultimate Trend Trader Indicator embodies this appr

Unlock the power of timely intra-day reversals with our cutting-edge "Intra-Day Reversal Arrow Indicator" available exclusively on MQL5. Designed to cater to traders seeking precision and efficiency in their trading strategies, this indicator offers clear visual signals pinpointing potential reversal points within the intraday market trends.
Key Features:
1. Arrow-Based Signals: Instantly identify potential reversal points with clear, easy-to-understand arrow signals displayed directly on

Draw On 1 Timeframe: Does exactly what the name says! When you draw a rectangle or trendline - the timeframe you draw it in, is the one it is visible. When you look at a higher or lower timeframe - the drawn object is not seen, but when you change back to the timeframe you originally draw in - the object can be seen. How to use it: This is an indicator that interacts with all trendline or rectangle objects drawn. Once running - it will automatically make any drawn trendline or rectangle objec

Market Structure MTF Dashboard Alerts: Is an fast way of checking the currently market structure on 4 timeframes! It lets you know if you are trading in the direction of both long-term and shor-term market bias. It is setup to track the High and Low positions to determine the current bias. Once the bias is shifting on the any of the 4 timeframes - you have the option to have an alarm notify you of the change. Once the alarm has gone off - you will be able to see a break of structure (BOS) form

Using the Neo Forex indicator algorithm, you can quickly understand what trend is currently developing in the market. The NeoX indicator accompanies long trends and can be used without restrictions on instruments or timeframes. Using this indicator you can try to predict future values. But the main use of the indicator is to generate buy and sell signals. The indicator tracks the market trend, ignoring sharp market fluctuations and noise around the average price. The indicator implements a type

The Compare Graphs indicator is an analysis tool that allows traders to compare two or more graphs on the same chart window. This indicator is commonly used in trading platforms such as MetaTrader and provides a clearer comparison of different financial instruments or time frames.
Functions of the Compare Graphs indicator may include: Selecting Charts: The trader can select the charts he wants to compare, such as price charts of different currency pairs or indicators on the same chart. Settin

Subscribe to the 'MA7 Trading' channel to receive notifications about new programs, updates and other information. Ask questions in the profile on the MQL5 .
Description of work
The 'MA7 Viola' indicator is based on the standard Moving Average (MA) indicator. Shows a sharp increase or decrease in the moving average. Detailed information about the 'MA7 Viola' indicator.
Indicator settings
General settings: Difference – difference between the last two MA values, percentage; Period ; Method

Make no mistake, this is not just another indicator; it's much more than that!
Welcome to a groundbreaking approach! Sunrise Divergence is not just another tool; it represents a deep understanding in how market dynamics are analyzed and traded. This indicator is crafted for traders who seek to navigate the markets with precision, leveraging the powerful concept of asset correlation, both positive and negative, to unveil trading opportunities that many overlook. In the markets, understanding t
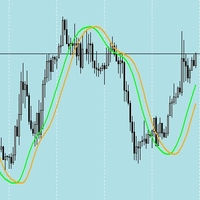
The Hull Moving Average (HMA) is renowned for its ability to smooth price movements effectively while maintaining responsiveness to recent price changes. When combined with a shifted Hull Moving Average crossover strategy, it offers a robust approach for identifying trends. Here's why: 1. Smoothness and Responsiveness : The HMA reduces noise in price data due to its weighted moving average calculation, which prioritizes recent prices. This smoothness helps filter out insignificant price fluctuat

RaysFX Forcaster è un indicatore avanzato per MetaTrader 4, progettato per fornire previsioni accurate del mercato. Questo indicatore utilizza un algoritmo sofisticato per calcolare i valori futuri basandosi su una serie di parametri configurabili dall'utente.
Caratteristiche principali: - TimeFrame : Permette all'utente di impostare il timeframe desiderato. Supporta diversi timeframes come M1, M5, M15, M30, H1, H4, D1, W1 e MN. - HalfLength : Questo parametro determina la lunghezza della met

MEGA TREND DASHBOARD
This Dashboard shows the Currency Strength across multiple timeframes. This SUPER DASHBOARD, Not only does it get your watchlist of currency pairs and shows the strength of each currency across the timeframes you Select - but also does it in a way that You can check it in 1 second!!! This indicator is very powerful because it is based on our custom algorithm to show the trends that are existing right now! The indicator does all the work for you by showing you what i

RaysFX Engulfing
RaysFX Engulfing è uno strumento potente per identificare i pattern di engulfing nel mercato Forex. Questi pattern sono segnali di inversione di tendenza che possono fornire opportunità di trading preziose. Caratteristiche principali : Rilevamento di pattern engulfing : L’indicatore identifica i pattern engulfing rialzisti e ribassisti, che sono segnali di possibili inversioni di tendenza. Segnali visivi : I pattern rilevati vengono evidenziati sul grafico con frecce blu e r

RaysFX DMI
Presentiamo l’Oscillatore RaysFX DMI, un indicatore personalizzato per la piattaforma di trading MetaTrader 4. Questo indicatore unico è progettato per fornire segnali di trading chiari e precisi basati sull’Indice di Movimento Direzionale (DMI). Caratteristiche principali: Oscillatore DMI: Calcola un oscillatore DMI basato su un periodo DMI specificato e un metodo di media mobile. Smoothing: L’oscillatore DMI viene ulteriormente lisciato in base a un periodo di lisciatura e a u

Subscribe to the 'MA7 Trading' channel to receive notifications about new programs, updates and other information. Ask questions in the profile on the MQL5 .
Description of work
The 'MA7 Galega' indicator is based on the standard Moving Average (MA) indicator. Shows a puncture of the moving average. Detailed information about the 'MA7 Galega' indicator.
Indicator settings
General settings: Period – MA period; Method – MA method; Apply to – price type; Consider the direction of the candle

RaysFX Dynamic Cycle Explorer (DCE) RaysFX Dynamic Cycle Explorer (DCE) è un potente indicatore di trading sviluppato per la piattaforma MetaTrader 4. Progettato con l’obiettivo di fornire ai trader un vantaggio competitivo, DCE utilizza algoritmi avanzati per identificare e segnalare le opportunità di trading più promettenti. Caratteristiche principali Multi-periodo: DCE utilizza sei periodi diversi per calcolare i suoi segnali, offrendo una visione completa del mercato. Super Trend Price: DCE
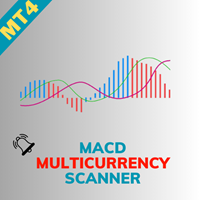
Welcome to the world of advanced trading with the MACD Multicurrency Scanner! Maximize your trading experience with our powerful MT4 indicator designed for seamless analysis and real-time insights. Key Features: Effortless MACD Scanning: Unlock the full potential of the MACD Multicurrency Scanner by effortlessly scanning multiple currency pairs. Receive instant alerts when specific Moving Average Convergence Divergence (MACD) conditions are met, ensuring you stay ahead of market movements. Comp

RaysFX Candlestick Signals
RaysFX Candlestick Signals è un potente strumento progettato per migliorare la tua esperienza di trading su MT4. Questo indicatore personalizzato è stato sviluppato con l’obiettivo di fornire segnali di trading precisi e tempestivi basati su specifiche configurazioni di candele e l’indicatore RSI. Caratteristiche principali : Segnali di acquisto e vendita : L’indicatore genera segnali di acquisto e vendita basati su specifiche configurazioni di candele e valori dell’

上昇下降トレンド - トレンドそのものを決定します。 トレンドを正しく特定することで、取引効率の 95% が決まります。 そして、トレーダーが常にトレンドの方向を正確に判断できれば、トレンドの方向が修正されるのを待って取引を開始するだけで済みます。 どのような取引戦略においても、トレンドを正しく特定する必要があります。 トレンドが正しく定義されていない場合、トレーダーは市場に効果的に参入できず、取引結果がマイナスになる可能性が高くなります。 アップダウントレンドインジケーターは、市場のトレンドの動きを正確に判断し、この情報をシンプルな形でトレーダーに表示するために作成されました。 このインジケーターは、多数の矢印や線の代わりに、上昇トレンドの場合は「UP」という単語をチャート上に表示し、下降トレンドの場合は「DOWN」という単語をチャート上に表示します。 トレンドの動きをさらに単純に判断することは不可能です。 トレーダーにとって、これは市場の現在のトレンドをすべての時間枠にわたって同時に判断するための最も簡単であると同時に、最も効果的な方法の 1 つです。 このインジケーターは、すべ

Pivot Points และระดับ (Support) และ(Resistance) บนแผนภูมิการเทรดใน MetaTrader 4 สำหรับตลาด Forex : คำนวณ Pivot Points : สคริปต์คำนวณจุด Pivot โดยใช้ข้อมูลราคาประวัติศาสตร์ เช่น ราคาเปิด, ราคาสูงสุด, ราคาต่ำสุด, และราคาปิด จากช่วงเวลาที่กำหนด (เช่น วัน, ชั่วโมง, ฯลฯ) จุด Pivot และระดับต่างๆ เช่น R1, R2, R3 (ระดับการต้านทาน) และ S1, S2, S3 (ระดับการสนับสนุน) ถูกคำนวณออกมา แสดงบนแผนภูมิ : หลังจากคำนวณจุด Pivot และระดับต่างๆ, สคริปต์จะแสดงเส้นเหล่านี้บนแผนภูมิ MT4 เพื่อช่วยให้นักเทรดสามารถเห็นจุดที่

RaysFX Master Inside Bars Master Inside Bars : L’indicatore identifica una serie di “Inside Bars” consecutive, formando un “Master Inside Bar”. Puoi personalizzare il numero minimo di “Inside Bars” consecutive necessarie per formare un “Master Inside Bar”, così come il colore e la larghezza dell’istogramma del “Master Inside Bar”. Inside Bars : L’indicatore identifica le “Inside Bars”, candele che si trovano completamente all’interno dell’intervallo della candela precedente. Puoi personalizzare

RaysFX Auto Fibo
RaysFX Auto Fibo v2.1 è un indicatore di trading essenziale per tutti i trader che utilizzano la piattaforma MetaTrader 4. Questo strumento automaticamente disegna i ritracciamenti di Fibonacci sul tuo grafico, risparmiando tempo e fatica. Caratteristiche principali: Disegno automatico : Non dovrai più tracciare manualmente i livelli di Fibonacci. L’indicatore lo fa per te, risparmiandoti tempo e garantendo precisione. Personalizzabile : Puoi personalizzare il colore, lo stile

indicator named "MTRADER" designed to be used with the MetaTrader 4 trading platform. It appears to be a technical analysis tool for forex or stock market trading. Here's a breakdown of its key components and functionalities: Indicator Properties and Inputs : The code begins by setting up basic properties of the indicator, such as its name, version, and drawing styles. It defines two indicator buffers with blue and red colors, likely used for graphical representation on charts. Input parameters

RaysFX Auto TrendLine Linee di tendenza automatiche : L’indicatore disegna automaticamente le linee di tendenza sul tuo grafico, risparmiandoti tempo e fatica. Personalizzabile : Periodo (nPeriod) : Questo parametro determina il numero di barre che l’indicatore considera per il calcolo delle linee di tendenza. Ad esempio, se imposti nPeriod a 10, l’indicatore considererà le ultime 10 barre per disegnare le linee di tendenza. Un periodo più lungo renderà l’indicatore meno sensibile

RaysFX Reversal Bar RaysFX Reversal Bar è un potente strumento di trading progettato per la piattaforma MetaTrader 4. Questo indicatore è stato sviluppato per individuare le inversioni di mercato basate su un modello di candela specifico.
Caratteristiche principali: Rilevamento di inversioni : L’indicatore cerca specifici modelli di inversione di 2 barre nel mercato. Questi modelli includono una barra rialzista seguita da due barre ribassiste per un segnale di acquisto, e una barra ribassist

RaysFX 3 Stoch!
Sei un trader alla ricerca di un vantaggio competitivo? L’indicatore RaysFX 3 Stoch è l’aggiunta perfetta al tuo arsenale di trading. Caratteristiche principali: Stocastico a 3 livelli : L’indicatore RaysFX 3 Stoch utilizza tre livelli di stocastico per fornire segnali di trading accurati e tempestivi. Personalizzabile : Puoi personalizzare i periodi di K, D e Slowing, così come i periodi dei tre stocastici, per adattarsi al tuo stile di trading. Allerta integrata : L’in

forex indicator GRAY ZONE for gold xauusd use with price action and Breakout time frame 15 and 30 m platform mt4 use with price action and break good tp 20 use sl warning only for one account mt4 Trading risks must be taken into account New traders are always excited to jump into action. When you’re putting your hard earned money on the line, it’s important to make sure you’re equipped with a strong foundation. Learn the ins and outs of the market and test yourself with paper trading before

RaysFX Supertrend Bar RaysFX Supertrend Bar è un indicatore personalizzato per MetaTrader 4. Utilizza l'indice di canale delle materie prime (CCI) per generare segnali di trading. L'indicatore mostra dei puntini in una finestra separata sotto il grafico principale per indicare i segnali di trading. Caratteristiche principali: Calcola il CCI per diversi periodi temporali. Visualizza puntini per indicare i segnali di trading. Permette all'utente di modificare i periodi temporali e la distanza tra

RaysFX Candlestick Exit
Il RaysFX Candlestick Exit è un indicatore di trading avanzato progettato per i trader che desiderano avere un controllo preciso sulle loro uscite di trading. Questo indicatore utilizza una combinazione di tecniche di trading per fornire segnali di uscita accurati e tempestivi. Caratteristiche principali: Range : Questo parametro consente di impostare il range di candele considerate per il calcolo dell’indicatore. Shift : Questo parametro consente di spostare l’indicato

Subscribe to the 'MA7 Trading' channel to receive notifications about new programs, updates and other information. Ask questions in the profile on the MQL5 .
Description of work
The 'MA7 Ixora' indicator is based on the standard Moving Average (MA) indicator. Shows the intersection of the fast and slow moving averages. Detailed information about the 'MA7 Ixora' indicator.
Indicator settings
General settings: Consider the direction of the candle .
Fast moving average settings: Period – M

RaysFX Intraday Fibo RaysFX Intraday Fibo è un indicatore di trading Forex di alta qualità, progettato con precisione e attenzione ai dettagli. Questo indicatore è il risultato di anni di esperienza nel trading Forex e nella programmazione MQL4, ed è stato creato con l’obiettivo di fornire ai trader un vantaggio competitivo nel mercato. Caratteristiche principali: Precisione : L’indicatore RaysFX Intraday Fibo utilizza un algoritmo avanzato per identificare i punti di ingresso e di uscita ottima

RaysFX MACD Divergence
Presentiamo RaysFX MACD Divergence, un indicatore di trading avanzato progettato per i trader moderni. Questo indicatore utilizza la divergenza MACD, uno dei metodi più affidabili nel mondo del trading, per fornirti segnali di trading precisi e tempestivi. Caratteristiche principali: Divergenza MACD: L’indicatore identifica e traccia le divergenze MACD, fornendo segnali di trading potenzialmente redditizi. Personalizzabile: Puoi personalizzare i parametri dell’EMA veloce

Master Trend is a complete trading system for day traders, scalp traders and swing traders. The system consists of two indicators. A simple, clear set of rules ideal for both beginners and experienced traders. The Master Trend Strategy helps you to always be on the right side. It helps filter out the strongest trends and prevents you from trading in a directionless market. If the market is too weak or is in sideways phases, then the Magic Band shows different color It works well on all instrume

RaysFX WPR Strategy Indicator RaysFX WPR Strategy è un indicatore di strategia di trading basato sul calcolo del WPR (Williams Percent Range). Questo indicatore utilizza tre lunghezze diverse per il calcolo del WPR e pesa i risultati per fornire un valore complessivo del WPR.
Caratteristiche: - Calcola il WPR utilizzando tre lunghezze diverse (9, 33, 77) - Utilizza un sistema di pesi per combinare i tre valori del WPR in un unico valore - Genera alert in base al numero di alert impostato dall

This indicator accurately identifies and informs market reversals and continuation patterns by analyzing and signaling the Three White Soldiers / Three Black Crows pattern. It also offers a "real-time backtesting" panel in the indicator itself in a way that every change made on the indicator parameters will immediately show the user how many signals are occurred, how many take profits and stop losses were hit and, by having these informations, the Win Rate and the Profit Factor of the setup ba
トレーダーの皆様、こんにちは。
私の最高の取引ツールを紹介します。
機動部隊 PPAAF モデル T.
マルチタイムフレーム 正確なプライスアクションアローフィルタリングされたモデル T。
この取引ツールは、長年さまざまな取引ツールを作成してきた私の最高傑作です。
なぜこの取引ツールが最高で信頼できるのでしょうか?
1. このツールは 6 つのインジケーターを使用します。
ダブル CCI = 高速 CCI x 低速 CCI デュアル ストキャスティクス = 高速ストキャスティクス (高速ストキャスティクス メイン ライン x 高速ストキャスティクス シグナル ライン) & スロー ストキャスティクス (低速ストキャスティクス メイン ライン x 低速ストキャスティクス シグナル ライン) デュアルMACD = 高速MACD (高速MACDメインライン x 高速MACDシグナルライン) & スローMACD (低速MACDメインライン x 低速MACDシグナルライン) 6 つの移動平均 = MA 1 x MA 2 、MA 3 x M

導入
マイティ・アリゲーター - 金融市場と個々の証券のトレンドは 15% ~ 30% の確率で推移し、残りの 70% ~ 85% の確率で横ばいに推移するという前提に基づくトレンド追跡指標です。 Mighty Alligator インジケーターは、5、8、13 期間に設定された 3 つの平滑化移動平均を使用します。これらはすべてフィボナッチ数です。 最初の平滑化平均は単純移動平均 (SMA) を使用して計算され、インジケーターの回転を遅くする追加の平滑化平均が追加されます。
その特徴的な機能 ポップアップメッセージ、通知、メールなどのアラート機能を搭載 3 つの移動平均はワニの顎、歯、唇で構成され、進化するトレンドや取引範囲に反応して開閉します。 ジョー (青線) - 13 バー SMMA から始まり、後続の値で 8 バーによって平滑化されます。 歯 (赤い線) - 8 バーの SMMA から始まり、後続の値では 5 バーで平滑化されます。 唇 (緑の線) - 5 つのバーの SMMA から始まり、後続の値で 3 つのバーによって平滑化されます。 インジケーターの設定
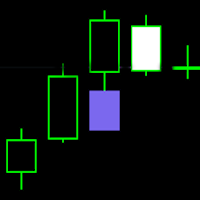
FVG - Fair Value Gap indicator is a three candle pattern indicator . It find inefficiencies or imbalances in market. It act as magnet before continue the trend.
indicator key function
1. No object is used to draw the plot. You can use this to build EA and backtest also.
2. Min and max value to Filter-out the noises .
It use as retest zone and can be use as entry price also. It popular among price action traders. your suggestion and comments are welcome and hopping that you will find th

HorizonFXを紹介します。Forexトレーダーが競争優位を求めて設計された革新的な市場オシレーターです。独自の公式から開発されたHorizonFXは、従来の指標を超え、市場の動きをより正確に特定するのに役立つ確かな買いと売りのシグナルを提供します。 HorizonFXの特徴: 独自の計算:市場の変数と高度な数学のユニークな組み合わせを使用して、市場のボラティリティとモメンタムのより細かい読み取りを可能にする振動線を生成します。 適応性:複数の時間枠で効率的に機能し、HorizonFXはスキャルピング、デイトレーディング、スウィングトレーディング戦略に適用可能な多用途性を持っています。 高い正確性:さまざまな市場条件で広範囲にテストされたHorizonFXは、顕著な正確性を実証し、技術分析のための信頼できるツールとなっています。 HorizonFXは、初心者トレーダーから経験豊富なトレーダーまで、直感的なインターフェイスと堅牢なアプローチを提供し、通貨市場での取引に適しています。HorizonFXオシレーターを使用して、技術分析を向上させ、自信を持って取引決定を下しましょう。

Subscribe to the 'MA7 Trading' channel to receive notifications about new programs, updates and other information. Ask questions in the profile on the MQL5 .
Description of work
The 'MA7 Hypnum' indicator is based on the standard Commodity Channel Index (CCI) indicator. Shows overbought and oversold zones. Detailed information about the 'MA7 Hypnum' indicator.
Indicator settings
General settings: Period – period of the CCI indicator; Apply to – price type for calculating the CCI indicator

The Positive Trend indicator is very reliable because it is based on moving averages. A feature of Trend Positive is the presence of a signal for entry/exit - the indicator line in a certain color indicates the signals "buy" or "sell". The accuracy of this signal is very high, matching 95% success to 5% failure. Trend Positive is also suitable for exiting a position. The indicator captures the trend almost completely, but during the flat it is necessary to use filters. When entering a positi

人工知能(AI)を用いて、生物の目に見える行動パターンを傾向分析に取り込むために作成。 カオス理論は移動平均と出会う。 イソギンチャクに餌を与えるフィルターは、その蔓を伸ばして栄養の海に出し、自分自身を豊かにします。 私は過度に長い説明であなたの時間を無駄にしません、概念はこれらの用語で理解できます。 そのカスタマイズ可能な期間回転移動平均は、あなたが指定した時間入力で、単純、指数、加重、平滑化の間で切り替わります。 ローテーションはセミカオスであり、市場自体によって注入されたランダム性です。 これらのMAを積み重ねると、イソギンチャクのフィルターが巻きひげを環境に伸ばして餌を摂るような効果が得られます。

Volume indicator Effect Volume , in the Forex market volumes are unique (tick). This volume indicator demonstrates the level of financial and emotional involvement. When the indicator forms a new top, it indicates that buyers are stronger than sellers over a certain period of time. If the indicator decreases, this indicates that the bears are stronger.
Why is it impossible to track normal volumes in Forex? The fact is that this is an over-the-counter market. Consequently, it is practically im

The Trend Bureaucrat indicator helps analyze the market on a selected time interval. They define the prevailing trend. Easy to set up and works on all pairs and all time intervals. Trend indicators make it possible to classify the direction of price movement, determining its strength. Solving this problem helps investors enter the market on time and get good returns. For any trader, it is extremely important to correctly determine the direction and strength of trend movement. Unfortunately, ther
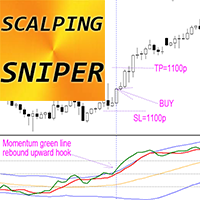
外国為替インジケーター SCALPING SNIPER for MT4、リペイントなし取引システム スキャルピングスナイパー - 正確な価格の勢いを示す高度なシステム (インジケーター) です。 MT4用のプロフェッショナルなスキャルピングスナイパーインジケーターを使用して取引方法をアップグレードしてください。 このシステムは非常に正確ですがまれな狙撃信号を提供し、勝率は最大 90% です。 システムは、1 ペアあたりの信号数が少ないことを補うために、多くのペアを使用して信号を検索すると想定します。 スキャルピングスナイパーの構成: 上下のボラティリティ ライン (青色); 中央の線 (オレンジまたは黄色) - 主要な傾向を示します。 信号方向線 (赤) - ローカルトレンドの方向を示します。 70 レベルを超えるエリア - 買われすぎゾーン (そこでは購入しないでください)。 30 未満のエリア - 売られすぎゾーン (そこでは販売しないでください)。 モメンタムライン (緑) - 取引に入る正確なシグナルを生成します Scalping Sniper にはユーザーの手間を避ける
Introducing the Ultimate Beast Super Signal Indicator Scanner Dashboard!
Are you tired of missing out on profitable trading opportunities in the fast-paced world of Forex? Say goodbye to guesswork and hello to precision with our cutting-edge Beast Super Signal Indicator Scanner Dashboard!
What is it?
Our Beast Super Signal Scanner Dashboard is the game-changer you've been waiting for. It is designed to work seamlessly with the renowned Beast Super Signal Indicator, a trusted tool among

--- INTRODUCTION ---- This indicator is to measure the strength of BULL and BEAR. The formulars are based on Price Change and Volume for period of time.
---- HOW TO READ ---- GREEN BAR = BULL is stronger than BEAR ----> Strong GREEN = Strong Buying Volume ----> Light GREEN = Weakening Buying Volume (BULL Still in control)
RED BAR = BEAR is stronger than BULL ----> Strong RED = Strong Selling Volume ----> Light RED = Weakening Selling Volume (BEAR Still in control)

Данный индикатор представляет из себя комплекс из 4 индикаторов в правом углу состоящий из RSI,Stochastic,Envelope и MACD, показывающий данные на различных таймфреймах, настройки данных индикаторов вы можете изменить в параметрах, сигналы на вход основан на индикаторах силы быков и медведей, данные сигналы используются и в роботах, скрины прилагаю, желающим, скину бесплатно

Exclusive Limited Time Offer! Grab this useful indicator for a lifetime at just $65. Elevate your trading experience with the IQ RSI Dashboard Indicator, your go-to tool for monitoring RSI value and Overbought, and Oversold signals across 10 currency pairs and all timeframes starting from 1M to Monthly. Indicator Features:
Comprehensive Signal Display: Effortlessly track RSI values for 10 symbols across 9 different timeframes, providing a comprehensive overview of market conditions. Flexible
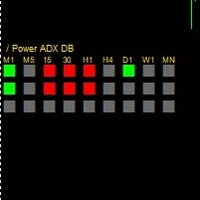
This is a trend indicator based on ADX and some other oscillators, the indicator change colors on strong trend directions, this indicator is most suitable for scalping purposes, if the lower timeframe shows opposite direction to the higher timeframe direction , the move may act as a retracement. And the lower squares of the indicator uses a higher ADX period, upon their change on color move may be exhausted.
MetaTraderプラットフォームのためのアプリのストアであるMetaTraderアプリストアで自動売買ロボットを購入する方法をご覧ください。
MQL5.community支払いシステムでは、PayPalや銀行カードおよび人気の支払いシステムを通してトランザクションをすることができます。ご満足いただけるように購入前に自動売買ロボットをテストすることを強くお勧めします。
取引の機会を逃しています。
- 無料取引アプリ
- 8千を超えるシグナルをコピー
- 金融ニュースで金融マーケットを探索
新規登録
ログイン