古典的な戦略をPythonで再構築する(第3回):高値更新と安値更新の予測
はじめに
人工知能は、私たちの取引能力を向上させる無限の機会を提供する可能性があります。しかし、すべての戦略が効果的であるとは限りません。私たちは、十分な情報に基づいた意思決定に必要なデータを提供することで、トレーダーのニーズに最も適した戦略を特定する手助けとなることを目指しています。
潜在的な戦略の組み合わせの数が膨大であるため、一人のトレーダーが重要な決断を下す前に、それらすべてを総合的に評価することはできません。この苦悩は、私たち取引コミュニティの誰もが共有しています。そこで本連載では、最も単純なモデルに対して人気のある戦略の精度を比較することで、取引戦略の探索空間を探っていきます。
この記事では、「高値更新」または「安値更新」に基づいて取引する古典的なプライスアクション取引戦略を精査します。2つの異なるターゲットを予測するために、さまざまなモデルを訓練しました。最初のターゲットは価格の変化を予測するもので、可能な限りシンプルなものでした。2つ目のターゲットは、将来の終値が現在の高値より高いか、現在の安値より低いか、あるいはその中間かを判断することを目的としました。
異なる複雑さのモデルを比較するために、ランダムシャッフルを使わない時系列相互検証を採用しました。両ターゲットにおける精度の変化を分析した結果、価格水準の変化を予測するよりシンプルなモデルが、より効果的である可能性が示唆されました。
取引戦略の概要
通常、プライスアクション戦略に従うトレーダーは、証券を分析する際に強いトレンドの形成や消滅の兆候を探します。強いトレンドが形成される兆候としてよく知られているのは、価格水準が以前の極端な値を上回り、徐々に大きなステップを踏みながら離れていくことです。これは俗に「高値引け」や「安値引け」と呼ばれ、価格の動向によって名称が変わります。
何世代にもわたり、トレーダーはこのシンプルな戦略を用いてエントリポイントとエグジットポイントを特定してきました。エグジットポイントは一般的に、価格が極端な値を超えられず、トレンドが強さを失い、反転の兆しが見えたときに決定されます。何年もの間、この戦略にはさまざまな細かい拡張が加えられてきましたが、基本的なテンプレートは変わっていません。
この戦略の最大の欠点の一つは、価格が不意にその極端な値動きの下に戻ってしまうことです。このような不利な価格変動は「リトレースメント」と呼ばれ、予測が難しくなります。その結果、ほとんどのトレーダーは、価格が新たな極端にブレイクしてもすぐにはポジションを持ちません。代わりに、価格がその水準をどの程度維持できるかを見極めてから投資を決定します。しかし、このアプローチにはいくつかの疑問が伴います。トレンドが確立したと結論付けるまで、どれくらいの時間待つべきか?逆に、トレンドが反転するまでの期間はどれくらいが長すぎるのか?これは、プライスアクションアナリストが直面するジレンマです。
方法論の概要
取引戦略の弱点がわかったところで、こうした過去の限界を克服するためにAIを採用する動機が理解できました。前述したように、価格が現在の極端な値を超えて閉じるか、それとも範囲内にとどまるかを予測するために、多様な分類子を訓練しました。このタスクには、AdaBoost、決定木、ニューラルネットワークなど、さまざまな分類器を選択しました。比較の前に、どのモデルでもハイパーパラメータのチューニングはおこないませんでした。
3つの潜在的な結果を3つのカテゴリレベルにマッピングしました。それぞれ1、2、3です。
- 1は、将来の終値が現在の高値を上回ることを表す。
- 2は、将来の終値が現在の安値を下回ることを表す。
- 3は1と2が偽であり、将来の価格は現在の高値と安値の中間になる。
注目すべきは、私たちが作成した新しいターゲットの解釈がより難しいということです。モデルが状態3への移行を予測した場合、その時点の価格によって、物価水準が上昇するのか下落するのかが不確実なままとなる可能性があります。このため、モデルは透明性が低いだけでなく、最も単純なモデルよりも精度が低いように見えます。
最も単純なモデルを上回ることができる戦略に対して評価を与えます。それに対して、そうできない複雑な戦略は、時間などの制約のあるリソースを追加で投資する正当性を欠くかもしれません。
Pythonによる探索的データ分析
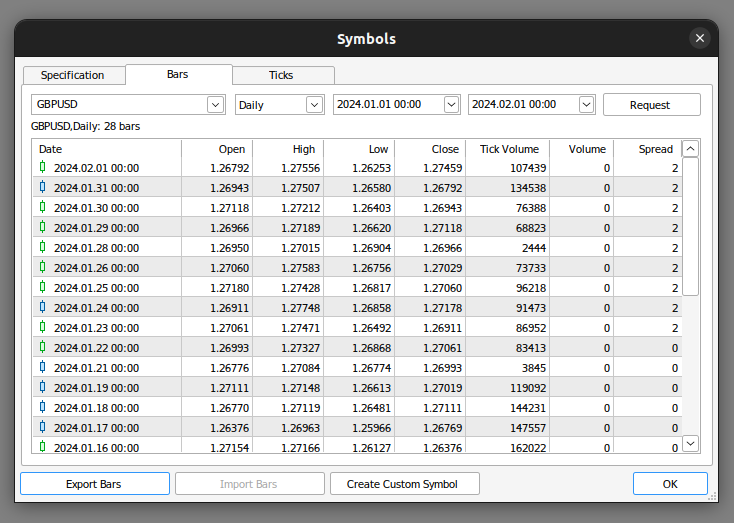
まず、MetaTrader 5端末からマーケットデータをエクスポートします。まずは端末を開き、銘柄アイコンを選択します。次に、コンテキストメニューからバーを選択し、興味のある銘柄を検索して、[エクスポート]を押します。

図1:市場データの輸出準備
データの準備ができたので、問題の変数間に関係があるかどうかを可視化し始めます。
まず、必要なライブラリをインポートすることから始めます。
#import libraries
import pandas as pd
import numpy as np
import seaborn as sns
import matplotlib.pyplot as plt
次に、先ほど準備したデータを読み込みます。MetaTrader 5端末は、タブ区切りのcsvファイルを生成するため、ファイルを読み込む際に「\t」パラメータを渡します。
gbpusd = pd.read_csv("/home/volatily/market_data/GBPUSD_Daily_20160103_20240131.csv",sep="\t")
データフレームの列名を変更してみましょう。
#Rename the columns
gbpusd.rename(columns={"<DATE>":"Date","<OPEN>":"Open","<HIGH>":"High","<LOW>":"Low","<CLOSE>":"Close","<TICKVOL>":"TickVol","<VOL>":"Vol","<SPREAD>":"Spread"},inplace=True)
どの程度先の未来を予測したいのかを明確にします。
#Define how far into the future we want to forecast
look_ahead = 20
では、先ほど説明したのと同じ方法でラベルを定義します。
#This column will help us with our plots
gbpusd["Future Close"] = gbpusd["Close"].shift(-look_ahead)
#Let's mark the normal target
#If price rises, our target will be 1
#If price falls, our target will be 0
gbpusd["Price Target"] = 0
#Let's mark the new target
#If price makes a higher high, we will label 1
#If price makes a lower low, we will label 2
#If price fails to make either, we will label 3
gbpusd["New Target"] = 0
データにラベルを付けます。
#Labeling the data
#If the future close was less than the current close, price depreciated, label 0
gbpusd.loc[gbpusd["Close"] > gbpusd["Close"].shift(-look_ahead),"Price Target"] = 0
#If the future close was greater than the current close, price depreciated, label 1
gbpusd.loc[gbpusd["Close"] < gbpusd["Close"].shift(-look_ahead),"Price Target"] = 1
#If price makes a higher high our label will be 1
gbpusd.loc[gbpusd["Close"].shift(-look_ahead) > gbpusd["High"],"New Target"] = 1
#If price makes a lower low our label will be 2
gbpusd.loc[gbpusd["Close"].shift(-look_ahead) < gbpusd["Low"],"New Target"] = 2
#Otherwise our label will be 3
gbpusd.loc[gbpusd["Close"].shift(-look_ahead) < gbpusd["Low"],"New Target"] = 3
欠損値のある行はすべて削除できます。
#Drop the last look ahead rows
gbpusd = gbpusd[:-look_ahead]
取引戦略は終値と高値の間に関係があることを示唆してますが、終値と高値の間に関係があるかどうかを可視化してみましょう。
#Plot a scattor plot so we can see if there may be any relationship between the close and the high
sns.scatterplot(data=gbpusd,x="Close",y="High",hue="Price Target")

図2:高値に対する終値のプロット
散布図は、モデル化しているシステムの状態変数の任意のペア間の関係を可視化できるので便利です。
データを観察すると、終値と高値の間に強い、ほぼ直線的な関係があるように見えることがすぐにわかります。価格が上昇した場合と下落した場合を区別するため、プロットに色を付けました。観察されたように、2つの事例の間に明確な隔たりはありません。唯一目立つ分離点は極端な値に現れます。例えば価格が1.1レベルを下回って引けると、常に跳ね返されるように見えます。
同じ散布図を描くことができますが、今回は安値をY軸に置きます。
#Plot a scattor plot so we can see if there may be any relationship between the close and the low
sns.scatterplot(data=gbpusd,x="Close",y="Low",hue="Price Target")

図3:終値と安値の関係を可視化する
予想通り、自然な分離はあまり得られません。このような自然な分離が望ましいのは、モデルが意思決定の境界をより速く学習できるようにするためです。新しいターゲットがデータセットの分離に役立つかどうか見てみましょう。
#Plot a scattor plot so we can see if there may be any relationship between the close and the low
sns.scatterplot(data=gbpusd,x="Close",y="Low",hue="New Target")

図4:新目標は分離を促進しない
見ての通り、まだ分離は良くありません。最も濃い点は状態3を表し、プロットのほぼ全長にわたっています。これは、データ中に同じ入力が異なる出力になった例があることを視覚的に示しており、問題です。
良い分離がどのようなものかを示すために、X軸に現在の価格、Y軸に将来の価格を可視化してみましょう。価格が上昇した場合はオレンジ色に、価格が下落した場合は青色にプロットします。
#Plot a scattor plot so we can see if there may be any relationship between the close and the low
sns.scatterplot(data=gbpusd,x="Close",y="Future Close",hue="Price Target")

図5:良い分離とはどのようなものかを示す簡単な例
ご覧のように、このプロットでは2つのクラスが明確に分かれています。これは、プロット内のターゲット自体を使用しているため予想されることです。機械学習の実践者としての私たちの目標は、図4で見たものに近い分離レベルを与えてくれる特徴やターゲットを発見することです。
新しいターゲットを使って同じプロットをおこなうと、奇妙なことが観察されます。
#Plot a scattor plot so we can see if there may be any relationship between the close and the low
sns.scatterplot(data=gbpusd,x="Close",y="Future Close",hue="New Target")

図6:新ターゲットがもたらす分離の可視化
プロットの上半分と下半分では、濃い点と薄い点がうまく分離しており、それぞれ価格が上昇した場合と下落した場合を表していることに注目してください。この2つのクラスの間に、中央の暗い斑点で示される状態3に分類されるポイントがあり、これは価格が幅を持った例を示しています。
モデルの訓練
これから、必要なモデルとその他の前処理ツールをインポートします。
#Let's get a group of different models
from sklearn.ensemble import RandomForestClassifier
from sklearn.ensemble import BaggingClassifier
from sklearn.ensemble import AdaBoostClassifier
from sklearn.neighbors import KNeighborsClassifier
from sklearn.discriminant_analysis import LinearDiscriminantAnalysis
from sklearn.neural_network import MLPClassifier
from sklearn.svm import LinearSVC
#Import cross validation libraries
from sklearn.model_selection import TimeSeriesSplit
#Import accuracy metrics
from sklearn.metrics import accuracy_score
#Import preprocessors
from sklearn.preprocessing import RobustScaler
時系列交差検証のパラメータを定義します。このギャップは、少なくとも予測水平線と等しくなければならないことを覚えておいてください。
#Splits
splits = 10
gap = look_ahead
必要なモデルをそれぞれリストに格納し、プログラムによってすべてのモデルを適合させることができるようにします。
#Store each of the models we need
cols = ["AdaBoostClassifier","Linear DiscriminantAnalysis","Bagging Classifier","Random Forest Classifier","KNeighborsClassifier","Neural Network Small","Neural Network Large"]
models = [AdaBoostClassifier(),LinearDiscriminantAnalysis(),BaggingClassifier(n_jobs=-1),RandomForestClassifier(n_jobs=-1),KNeighborsClassifier(n_jobs=-1),MLPClassifier(hidden_layer_sizes=(5,2),early_stopping=True,max_iter=1000),MLPClassifier(hidden_layer_sizes=(20,10),early_stopping=True,max_iter=1000)]
#Create data frames to store our accuracy with different models on different targets
index = np.arange(0,splits)
price_target = pd.DataFrame(columns=cols,index=index)
new_target = pd.DataFrame(columns=cols,index=index)
交差検証テスト用の時系列分割オブジェクトを作成します。
#Create the tscv splits
tscv = TimeSeriesSplit(n_splits=splits,gap=gap)
モデルの予測変数とターゲットを定義します。
#Define the predictors and target
predictors = ["Open","High","Low","Close"]
target = "New Target"
交差検証の実施
#Now we perform cross validation
for j in (np.arange(len(models))):
    #We need to train each model
    model = models[j]
    for i,(train,test) in enumerate(tscv.split(gbpusd)):
        #Scale the data
        scaler = RobustScaler()
        X_train_scaled = scaler.fit_transform(gbpusd.loc[train[0]:train[-1],predictors])
        scaler = RobustScaler()
        X_test_scaled = scaler.fit_transform(gbpusd.loc[test[0]:test[-1],predictors])
        #Train the model
        model.fit(X_train_scaled,gbpusd.loc[train[0]:train[-1],target])
        #Measure the accuracy
        new_target.iloc[i,j] = accuracy_score(gbpusd.loc[test[0]:test[-1],target],model.predict(X_test_scaled))
最も単純なターゲットに対する各モデルのパフォーマンスを観察してみましょう。
#Calculate the mean for each column when predicting price
for i in np.arange(0,len(models)):
    print(f"{cols[i]} achieved accuracy: {price_target.iloc[:,i].mean()}")
線形判別分析の達成精度:0.5579646017699115
バギング分類器の達成精度:0.5075221238938052
ランダムフォレスト分類器の達成精度:0.5349557522123894
KNeighborsClassifierの達成精度:0.536283185840708
小型ニューラルネットワークの達成精度:0.45309734513274336
大型ニューラルネットワークの達成精度:0.5446902654867257
線形判別分析は、この特定のデータセットで最も良い結果を出し、ほぼ56%の精度を達成しましたが、新しいターゲットでのパフォーマンスを見てみましょう。
#Calculate the mean for each column when predicting price
for i in np.arange(0,len(models)):
    print(f"{cols[i]} achieved accuracy: {new_target.iloc[:,i].mean()}")
線形判別分析の達成精度:0.4668141592920355
バギング分類器の達成精度:0.4393805309734514
ランダムフォレスト分類器の達成精度:0.45929203539823016
KNeighborsClassifierの達成精度:0.465929203539823
小型ニューラルネットワークの達成精度:0.3920353982300885
大型ニューラルネットワークの達成精度:0.4606194690265487
どちらもLDAがトップでした。どのモデルも新しいターゲットに対するスキルは弱かったですが、小型ニューラルネットワークのパフォーマンスが最も低下しました。
| モデル | パフォーマンスの変化 |
|---|---|
| AdaBoostClassifier | -14.32748538011695% |
| 線形判別分析 | -19.526066350710863% |
| バギング分類器 | -22.09660842754366% |
| ランダムフォレスト分類器 | -16.730769230769248% |
| KNeighborsClassifier | -15.099715099715114% |
| 小型ニューラルネットワーク | -41.04193138500632% |
| 大型ニューラルネットワーク | -21.1502782931354% |
最高のパフォーマンスを示したモデルの混同行列を分析してみましょう。
#Let's continue analysing the performance of our best model Linear Discriminant Analysis
from mlxtend.evaluate import confusion_matrix
from mlxtend.plotting import plot_confusion_matrix
model = LinearDiscriminantAnalysis()
model.fit(gbpusd.loc[0:1000,predictors],gbpusd.loc[0:1000,"New Target"])
cm = confusion_matrix(y_target=gbpusd.loc[1000:,"New Target"],y_predicted=model.predict(gbpusd.loc[1000:,predictors]),binary=True)
fig , ax = plot_confusion_matrix(cm)

図7:LDAモデルの混同行列
混同行列は、どのクラスがモデルにとって挑戦的であるかを特定するのに役立ちます。上のプロットに示されているように、モデルはクラス3の予測で最悪の結果を出しました。しかし、このクラスは観察回数が少なくなっています。これに対処するには、全母集団をよりよく表すデータを使う必要があるかもしれません。より多くの履歴データをフェッチするか、より下位の時間枠を分析することによって、これを達成することができます。
特徴量の選択
モデルから不要な特徴量を削除することで、パフォーマンスが向上することもあります。最もパフォーマンスの良いモデルであるLDAに焦点を当て、その最も重要な特徴量を特定し、パフォーマンスをさらに向上させることができるかどうかを見てみましょう。#Now let us perform feature selection
from mlxtend.feature_selection import SequentialFeatureSelector
多くの特徴量選択アルゴリズムがありますが、本稿では前方特徴量選択アルゴリズムを使用しました。このアルゴリズムには様々なバージョンがありますが、一般的なプロセスはベンチマークとなる帰無モデルから始まります。次にアルゴリズムは、利用可能なp個の特徴量を1つずつ評価し、最大の性能向上をもたらすものを最初の特徴量として選択します。このプロセスは,残りのp-1個の予測変数について繰り返されます。最近の並列計算の進歩のおかげで、このようなアルゴリズムはより実現可能になってきました。
予測因子をp個からk個に減らし、k<pとし、k個の特徴量を賢く選択することで、元のモデルを凌駕するか、あるいは同等の信頼性を持ちながら、より高速に訓練できるモデルを実現できるかもしれません。さらに、モデルで使用される予測変数の数を減らせば、モデルの係数の分散を減らすことができます。
しかし、このアルゴリズムには議論に値する2つの重要な制約があります。まず、新しいモデルは、使用している情報が限られているため、若干のバイアスがかかる可能性があります。さらに、最初の特徴量の選択は、その後の選択に影響を与えます。最初に選択された特徴量にターゲットとほとんど関係がない場合、この最初の選択ミスが原因で、後続の特徴が情報不足に見えることがあります。
分析では、特徴量選択器が重要と見なした変数を選択できるようにしましたが、選ばれたのは唯一「始値」だけでした。
#Forward feature selection
forward_feature_selection = SequentialFeatureSelector(LinearDiscriminantAnalysis(),
                                                     k_features =(1,4),
                                                     forward=True,
                                                     verbose=2,
                                                     scoring="accuracy",
                                                     cv=5,
                                                     n_jobs=-1).fit(gbpusd.loc[:,predictors],gbpusd.loc[:,"New Target"])
さて、最良の特徴量を見てみましょう。
#Best feature
forward_feature_selection.k_feature_names_ 新しい精度レベルを観察してみましょう。
#Update the predictors and target
predictors = ["Open"]
target = "New Target"
best_features_for_new_target = pd.DataFrame(columns=["Linear Discriminant Analysis"],index=index)
同定した最良の特徴量を用いて交差検証をおこないます。
#Now we perform cross validation
for i,(train,test) in enumerate(tscv.split(gbpusd)):
    #First initialize the model
    model = LogisticRegression()
    #Train the model
    model.fit(gbpusd.loc[train[0]:train[-1],predictors],gbpusd.loc[train[0]:train[-1],target])
    #Measure the accuracy
    best_features_for_new_target.iloc[i,0] = accuracy_score(gbpusd.loc[test[0]:test[-1],target],model.predict(gbpusd.loc[test[0]:test[-1],predictors]))
新しい精度レベルを観察してみましょう。
#New accuracy only using the open price
best_features_for_new_target.iloc[:,0].mean()
そして最後に、すべての予測変数を使用したモデルと、1つの予測変数を使用したモデルとの性能の変化を観察してみましょう。
パフォーマンスの変化は約-0.2%であることがわかります。つまり、他の3つの予測因子を手放しても、ほとんど情報は失われないということです。
MQL5で戦略を実行する
まず、必要なライブラリをインポートすることから始めます。
//+------------------------------------------------------------------+
//|                                   Forecasting Highs And Lows.mq5 |
//|                                        Gamuchirai Zororo Ndawana |
//|                                             https://www.mql5.com |
//+------------------------------------------------------------------+
#property copyright "Gamuchirai Zororo Ndawana"
#property link      "https://www.mql5.com"
#property version   "1.00"

//+------------------------------------------------------------------+
//|Libraries we need                                                 |
//+------------------------------------------------------------------+
#include <Trade/Trade.mqh> //Trade class
CTrade Trade;             //Initialize the class
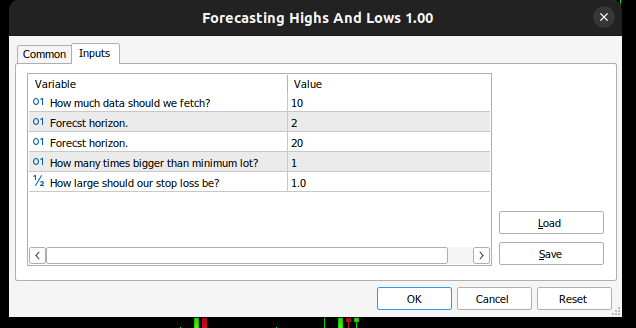
そして入力変数を定義し、エンドユーザーが自分の体験をカスタマイズできるようにします。
//+------------------------------------------------------------------+
//| Input variables                                                  |
//+------------------------------------------------------------------+
input int fetch = 10; //How much data should we fetch?
input int look_ahead = 2; //Forecst horizon.
input int rsi_period = 20; //Forecst horizon.
int input  lot_multiple = 1; //How many times bigger than minimum lot?
input double stop_loss_values = 1; //How large should our stop loss be?
アプリケーション全体で使われるグローバル変数がいくつか必要です。
//+------------------------------------------------------------------+
//| Global variables                                                 |
//+------------------------------------------------------------------+
vector state = vector::Zeros(3);//This vector will store the state of the system using binary mapping
double minimum_volume;//The smallest contract size allowed
vector input_data;//Input data
vector output_data;//Output data
vector rsi_data;//RSI output data
double variance;//This is the variance of our input data
int classes = 3;//The total number of output classes we have
vector mean_values = vector::Zeros(classes);//This vector will store the mean value for each class
vector probability_values = vector::Zeros(classes);//This vector will store the prior probability the target will belong each class
vector total_class_count = vector::Zeros(classes);//This vector will count the number of times each class was the target
int rsi_handler;//This will store our RSI handler
int forecast = 0;//Our model's forecast
double discriminant_values[3];//The discriminant function
次に、エキスパートアドバイザー(EA)の初期化プロシージャを定義します。このプロシージャでは、まずユーザーが有効な入力を渡したことを確認し、次にテクニカル指標を設定し、取引システムの状態を初期化します。
//+------------------------------------------------------------------+
//| Expert initialization function                                   |
//+------------------------------------------------------------------+
int OnInit()
  {
//--- Validate inputs
   if(!valid_inputs())
     {
      //User passed invalid inputs
      Print("Invalid inputs were received!");
      return(INIT_FAILED);
     }
//--- Load input data
   rsi_handler = iRSI(_Symbol,PERIOD_CURRENT,rsi_period,PRICE_CLOSE);
//--- Market data
   minimum_volume = SymbolInfoDouble(_Symbol,SYMBOL_VOLUME_MIN);
//--- Update system state
   update_system_state(0);
//--- End of initialization
   return(INIT_SUCCEEDED);
  }
また、アプリケーションの初期化解除プロシージャも定義する必要があります。
//+------------------------------------------------------------------+
//| Expert deinitialization function                                 |
//+------------------------------------------------------------------+
void OnDeinit(const int reason)
  {
//--- Remove indicators
   IndicatorRelease(rsi_handler);
//--- Detach the Expert Advisor
   ExpertRemove();
//--- End of deinitialization
  }
エントリシグナルがあるかどうかを分析するための関数を構築します。エントリシグナルは、モデルの予測が週足などの高い時間軸のトレンドと一致している場合に有効とみなされます。この2つが一致したら、RSI指標を使ってエントリのタイミングを計ります。
//+------------------------------------------------------------------+
//| This function will analyse our entry signals                     |
//+------------------------------------------------------------------+
void analyse_entry(void)
  {
   Print("Higher Time Frame Trend");
   Print(iClose(_Symbol,PERIOD_W1,12) - iClose(_Symbol,PERIOD_CURRENT,0));
   if(iClose(_Symbol,PERIOD_W1,12) < iClose(_Symbol,PERIOD_CURRENT,0))
     {

      if(forecast == 1)
        {
         bullish_sentiment();
        }
     }
   if(iClose(_Symbol,PERIOD_W1,12) > iClose(_Symbol,PERIOD_CURRENT,0))
     {

      if(forecast == 2)
        {
         bearish_sentiment();
        }
     }
  }
RSI指標の解釈には、2つの専用関数が必要で、1つは売り機会を、もう1つは買い機会を分析します。
//+------------------------------------------------------------------+
//| This function will analyze our RSI for sell signals              |
//+------------------------------------------------------------------+
void bearish_sentiment(void)
  {
   rsi_data.CopyIndicatorBuffer(rsi_handler,0,0,1);
   if(rsi_data[0] < 50)
     {
      Trade.Sell(minimum_volume * lot_multiple,_Symbol,SymbolInfoDouble(_Symbol,SYMBOL_BID),(SymbolInfoDouble(_Symbol,SYMBOL_BID) + stop_loss_values),(SymbolInfoDouble(_Symbol,SYMBOL_BID) - stop_loss_values));
      update_system_state(2);
     }
  }
//+------------------------------------------------------------------+
//| This function will analyze our RSI for buy signals               |
//+------------------------------------------------------------------+
void bullish_sentiment(void)
  {
   rsi_data.CopyIndicatorBuffer(rsi_handler,0,0,1);
   if(rsi_data[0] > 50)
     {
      Trade.Buy(minimum_volume * lot_multiple,_Symbol,SymbolInfoDouble(_Symbol,SYMBOL_ASK),(SymbolInfoDouble(_Symbol,SYMBOL_ASK) - stop_loss_values),(SymbolInfoDouble(_Symbol,SYMBOL_ASK) +stop_loss_values));
      update_system_state(2);
     }
  }
ここで、初期化時にユーザーが渡した入力を検証する関数を定義しておきましょう。
//+------------------------------------------------------------------+
//|This function will check the inputs the user passed               |
//+------------------------------------------------------------------+
bool valid_inputs(void)
  {
//--- For the inputs to be valid:
//--- The forecast horizon must be less than the data fetched
   return((fetch > look_ahead));
  }
LDAモデルを初期化する関数を設計します。
//+------------------------------------------------------------------+
//| This function will initialize our model                          |
//+------------------------------------------------------------------+
void initialize_model(void)
  {
//--- First fetch the input data
   fetch_input_data(look_ahead,fetch);
   fetch_output_data(0,fetch);
//--- Update the system state
   update_system_state(1);
//--- Fit the model
   fit_model();
  }
モデルを初期化するには、まずモデルの入力データを取得する必要があります。この関数は単に始値をフェッチするだけです。なぜなら、ここでの分析では、始値が最も重要な機能であると示唆されたからです。
//+------------------------------------------------------------------+
//| This function will fetch our input data                          |
//+------------------------------------------------------------------+
void fetch_input_data(int start,int size)
  {
//--- Fetching input data
   Print("Fetching input data");
   input_data = vector::Zeros(fetch);
   input_data.CopyRates(_Symbol,PERIOD_CURRENT,COPY_RATES_OPEN,start,size);
   input_data.Resize(size);
   Print("Input data fetched");
  }
次に、出力データを取得してラベルを付ける必要があり、各クラスがターゲットとして出現した回数を追跡することも重要です。この情報は、後でLDAモデルを適合するときに使用されます。
//+------------------------------------------------------------------+
//| This function will fetch our output data                         |
//+------------------------------------------------------------------+
void fetch_output_data(int start,int size)
  {
//--- Fetching output data
   vector historic_high = vector::Zeros(size);
   vector historic_low = vector::Zeros(size);
   vector historic_close = vector::Zeros(size);
   historic_close.CopyRates(_Symbol,PERIOD_CURRENT,COPY_RATES_CLOSE,start,size+look_ahead);
   historic_low.CopyRates(_Symbol,PERIOD_CURRENT,COPY_RATES_HIGH,start,size+look_ahead);
   historic_high.CopyRates(_Symbol,PERIOD_CURRENT,COPY_RATES_LOW,start,size+look_ahead);
   output_data = vector::Zeros(size);
   output_data.Resize(size);
//--- Reset class counts
   total_class_count[0] = 0;
   total_class_count[1] = 0;
   total_class_count[2] = 0;
//--- Label the data
   for(int i = 0; i < size; i++)
     {
      //--- Price broke into a higher high
      if(historic_close[i + look_ahead] > historic_high[i])
        {
         output_data[i] = 1;
         total_class_count[0] += 1;
        }
      //--- Price broke into a lower low
      else
         if(historic_close[i + look_ahead] < historic_low[i])
           {
            output_data[i] = 2;
            total_class_count[1] += 1;
           }
         //--- Price was stuck in a range
         else
            if((historic_close[i + look_ahead] > historic_low[i]) && (historic_close[i + look_ahead] < historic_high[i]))
              {
               output_data[i] = 3;
               total_class_count[2] += 1;
              }
     }
//--- We fetched output data succesfully
   Print("Output data fetched");
   Print("Total class counts");
   Print(total_class_count);
  }
ここで、LDAモデルのフィッティング手順を定義します。最初のステップでは、3つの各クラスの始値の平均値を計算します。2番目のステップでは、各クラスがターゲットクラスである事前確率分布を計算する必要がありますが、前のステップで実行したクラスカウントを使用することで、この値を単純に推定することができます。最後に、3クラスそれぞれの始値の分散を計算する必要があります。
//+------------------------------------------------------------------+
//| This function will fit the LDA algorithm                         |
//+------------------------------------------------------------------+
//--- Fit the model
void fit_model(void)
  {
//--- To fit the LDA model, we first need to know the mean value of X for each of our 3 classes
   double sum_class_one = 0;
   double sum_class_two = 0;
   double sum_class_three = 0;

//--- In this case we only have 1 input
   for(int i = 0; i < fetch;i++)
     {
      //--- Class 1
      if(output_data[i] == 1)
        {
         sum_class_one += input_data[i];
        }
      //--- Class 2
      else
         if(output_data[i] == 2)
           {
            sum_class_two += input_data[i];
           }
         //--- Class 3
         else
            if(output_data[i] == 3)
              {
               sum_class_three += input_data[i];
              }
     }
//--- Calculate the mean value for each class
   mean_values[0] = sum_class_one / total_class_count[0];
   mean_values[1] = sum_class_two / total_class_count[1];
   mean_values[2] = sum_class_three / total_class_count[2];
   Print("Mean values");
   Print(mean_values);
//--- Now we need to calculate class probabilities
   for(int i=0;i<classes;i++)
     {
      probability_values[i] = total_class_count[i] / fetch;
     }
   Print("Class probability values");
   Print(probability_values);
//--- Calculating the variance
   Print("Calculating the variance");
//--- Next we need to calculate the variance of the inputs within each class of y.
//--- This process can be simplified into 2 steps
//--- First we calculate the difference of each instance of x from the group mean.
   double squared_difference[3];
   for(int i =0; i < fetch;i++)
     {
      //--- If the output value was 1, find the input value that created the output
      //--- Calculate how far that value is from it's group mean and square the difference
      if(output_data[i] == 1)
        {
         squared_difference[0] = MathPow((input_data[i]-mean_values[0]),2);
        }

      else
         if(output_data[i] == 2)
           {
            squared_difference[1] = MathPow((input_data[i]-mean_values[1]),2);
           }

         else
            if(output_data[i] == 3)
              {
               squared_difference[2] = MathPow((input_data[i]-mean_values[2]),2);
              }
     }
//--- Show the squared difference values
   Print("Squared difference value for each output value of y");
   ArrayPrint(squared_difference);

//--- Next we calculate the variance as the average squared difference from the mean
   variance = (1.0/(fetch - 3.0)) * (squared_difference[0] + squared_difference[1] + squared_difference[2]);
   Print("Variance: ",variance);
  }
ここで、モデルから予測を取得する関数が必要です。モデルは、3つの可能なクラスごとに判別値を予測します。最大の判別値を持つクラスが予測クラスです。
//+-------------------------------------------------------------------+
//| This model will fetch our model's prediction                      |
//+-------------------------------------------------------------------+
void model_forecast(void)
  {
//--- Obtain a forecast from our model
//--- First we need to fetch the most recent input data
   fetch_input_data(0,1);
//--- We need to calculate the discriminant function for each class
//--- The predicted class is the one with the largest discriminant function
   Print("Calculating discriminant values.");
   for(int i = 0; i < classes; i++)
     {
      discriminant_values[i] = (input_data[0] * (mean_values[i]/variance) - (MathPow(mean_values[i],2)/(2*variance)) + (MathLog(probability_values[i])));
     }
//--- Show the LDA prediction
   forecast = (ArrayMaximum(discriminant_values) +1);
   Print("LDA Forecast: ",forecast);
   ArrayPrint(discriminant_values);
  }
OnTick関数が常に次に何をすべきかを知ることができるように、システムの状態を更新する関数が必要です。
//+-------------------------------------------------------------------+
//| This function will be used to update the state of the system      |
//+-------------------------------------------------------------------+
void update_system_state(int index)
  {
//--- Each column vector is set to 0 except column 0, the first column.
//--- If the first column is set to 1, then our model has not been trained
//--- If the second column is set to 1, then our model has been trained but we have no positions
//--- If the third column is set to 1, then we have a position we need to manage
//--- Update the system state
   state = vector::Zeros(3);
   state[index] = 1;
   Print("Updating system state");
   Print(state);
  }
すべての関数が適切なタイミングで呼び出されるようにするOnTick関数を定義します。
//+------------------------------------------------------------------+
//| Expert tick function                                             |
//+------------------------------------------------------------------+
void OnTick()
  {
//--- The model has not been trained
   if(state.ArgMax() == 0)
     {
      Print("Training the model.");
      initialize_model();
     }
//--- The model has been trained, but we have no positions
   else
      if(state.ArgMax() == 1)
        {
         Print("Finding An Entry.");
         model_forecast();
         analyse_entry();
        }
  }
//+------------------------------------------------------------------+

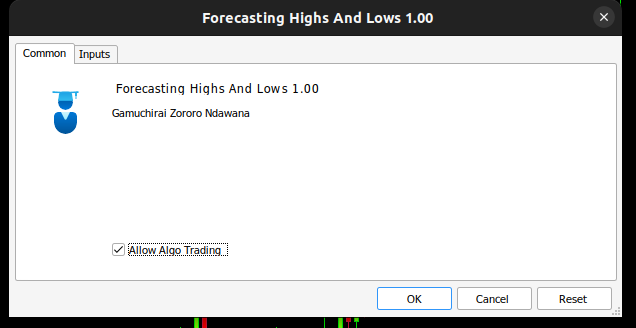
図8:EA

図9:LDA EA

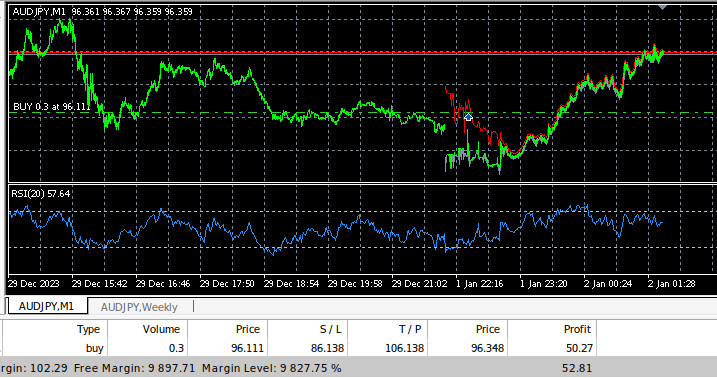
図10:EAの取引履歴データ
結論
この記事では、トレーダーが高値更新や安値更新を予測するよりも、価格の変化を予測する方が有効である理由を示しました。この記事を読んだ後、個人のリスク許容度や経済的目標を考慮し、この取引戦略が自身に適しているかどうかを判断する自信が持てることを願っています。
線形判別分析(LDA)アルゴリズムは、ベイズの定理を使用して確率を推定し、クラス固有の平均と共通の分散を持つ正規分布を仮定して、各クラス内の入力変数の分布をモデル化します。これにより、クラス分離を最大化し、クラス内分散を最小化する判別値を計算し、LDAがクラスの特性を効果的に区別するのに役立ちます。しかし、LDAの仮定は透明性と解釈可能性を制限する可能性があり、大規模なパラメータチューニングを行わない限り、より単純なモデルのパフォーマンスを下回ることがあります。日次データでのデフォルト設定を使用したテストでは、潜在的なパフォーマンスの問題が明らかになり、より多くのデータと計算リソースがあれば、より良い結果が得られる可能性が示唆されました。
より大規模なデータセットで分析を繰り返せば、さらなる知見が得られるでしょうが、このアプローチは十分な計算能力がなければ実現不可能です。10フォールド時系列交差検証を使用したため、各モデルを10回訓練する必要がありました。データセットのサイズが大きくなると、モデルの訓練時間は指数関数的に長くなると予想されます。
MetaQuotes Ltdにより英語から翻訳されました。
元の記事: https://www.mql5.com/en/articles/15388
 データサイエンスと機械学習(第28回):AIを使ってEURUSDの複数の先物を予測する
 MQL5でボリンジャーバンド取引戦略を実装する:ステップごとのガイド
 MQL5とPythonで自己最適化エキスパートアドバイザーを構築する(第2回):ディープニューラルネットワークのチューニング
 MQL5とデータ処理パッケージの統合(第1回):高度なデータ分析と統計処理
- 無料取引アプリ
- 8千を超えるシグナルをコピー
- 金融ニュースで金融マーケットを探索