
古典的な戦略をPythonで再構築する(第2回):ボリンジャーバンドのブレイクアウト
はじめに
ボリンジャーバンドは、トレンドフォローや潜在的な転換点の識別において、取引戦略に広く利用されるツールです。厳密には、この指標は指数移動平均(EMA: Exponential Moving Average)を基に構成されており、証券の終値を平滑化します。中央のラインはEMAを示し、その上下に通常2標準偏差で形成された2本のバンドが配置されます。
本記事の目的は、ボリンジャーバンドを活用した戦略の有効性を実証的に分析し、その結果をもとに、読者がこの手法が自身の取引スタイルに適しているかを判断する材料を提供することです。また、テクニカル指標がAIモデルの指針としてどのように活用され、より安定した取引戦略の構築に貢献できるかも紹介します。
私たちは、線形判別分析アルゴリズムを使用して2種類のAIモデルを訓練しました。モデルのテストにはscikit-learnライブラリを使用し、時系列交差検証を用いて比較をおこないました。1つ目のモデルは単純に価格の上昇・下落を予測するもので、2つ目はボリンジャーバンドによって定義される4つのゾーン内で価格がどのように推移するかを予測するものです。残念ながら、ボリンジャーバンドに基づく4つのゾーン間の推移を予測するよりも、価格自体を予測する方が効果的であるとの結論に至りました。ただし、ボリンジャーバンドのパラメータ最適化はおこなっておらず、その点も考慮が必要です。
この記事の主な目的は以下の点を明らかにすることです。
- 2つの取引戦略の分析的比較方法
- MQL5での線形判別分析のゼロからの実装方法
- AIを活用した安定した取引戦略の構築方法
戦略の概要と動機
人工知能(AI: Artificial Intelligence)という言葉は、歴史上、最も誤解を招きやすい命名のひとつであることは間違いありません。この記事を読んでいただければ、AIという名前が適切でないと感じるかもしれません。私が問題視しているのは、「知能」という言葉です。AIモデルは、人間の意味での知能を持つわけではなく、実際には最適化アルゴリズムを知的に応用したものにすぎません。
AIモデルは、主にシステム内のエラーを最小化したり、報酬を最大化することを目指します。しかし、モデルが導き出す解決策は、常に現実的とは限りません。たとえば、取引口座の損失を最小限に抑えることを目標にしたAIシステムは、「取引を行わない」という結論に達する可能性があります。この解決策は数学的には問題を満たしていますが、実際の取引では現実的ではありません。
私たち、いわゆる知的AIの実践者は、慎重に計画された制約を通してモデルを導く必要があります。この記事では、ボリンジャーバンドを活用してAIモデルに指示を与えます。ボリンジャーバンドを基に、価格がどの瞬間にも存在し得る4つのゾーンを特定します。価格は常にこの4つのゾーンのいずれかに位置します。
- ゾーン1:価格がボリンジャーバンドの上限を超えている状態
- ゾーン2:価格がミッドバンドより上だが、上限バンド未満の状態
- ゾーン3:価格が下限バンドより上だが、ミッドバンド未満の状態
- ゾーン4:価格がボリンジャーバンドの下限を下回っている状態
価格がこれら4つのゾーン間をどのように移動するかを理解するためにモデルを訓練し、次に価格が移動するゾーンを予測します。取引シグナルは、価格があるゾーンから別のゾーンに移動するたびに生成されます。たとえば、モデルがゾーン2からゾーン1に価格が移動すると予測した場合、これを上昇のサインと捉え、買い注文を発行します。このモデルとエキスパートアドバイザー(EA)は、完全にMQL5でネイティブに実装されています。
ボリンジャーバンドは、トレンドフォロー戦略や転換点の特定など、さまざまな取引戦略に利用されます。この指標は、厳密には指数移動平均(EMA)を基に構成され、通常は証券の終値を平滑化します。EMAは2本のバンドに挟まれており、1本はEMAの上、もう1本はEMAの下に配置され、これらのバンドは通常2標準偏差に設定されています。
伝統的に、ボリンジャーバンドは、買われ過ぎや売られ過ぎの価格水準を見極めるために使われます。価格がボリンジャーバンドの上限に達すると、中央値まで下がる傾向があり、この傾向は下限に達した場合にもよく見られます。下限に達した際には、証券が2標準偏差分割安になり、投資家にとって魅力的な割引価格で購入できる機会と見なされることがあります。しかし、価格がボリンジャーバンドの外側を大きく突き抜け、強いトレンドがそのまま続くこともあります。残念ながら、私たちの統計分析によると、ボリンジャーバンドのブレイクアウトを予測するのは、価格の変動を予測するよりも難しいかもしれません。MetaTrader 5端末からのデータ取得
まず、MetaTrader5端末を開き、コンテキストメニューの銘柄アイコンをクリックすると、端末で使用可能な銘柄のリストが表示されます。
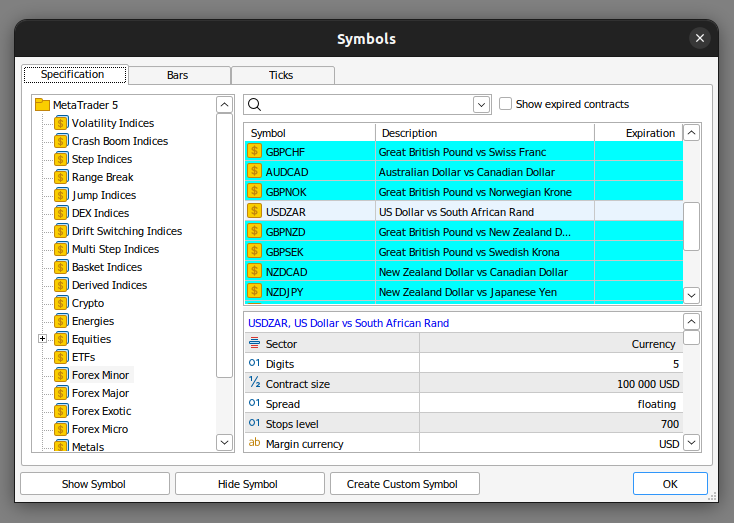
図1:MetaTrader 5端末からデータを取得する準備をしています。
次にBarsウィンドウをクリックし、モデル化したい銘柄を検索し、使用したい時間枠を選択します。この例では、GBPUSD日足為替レートをモデル化します。
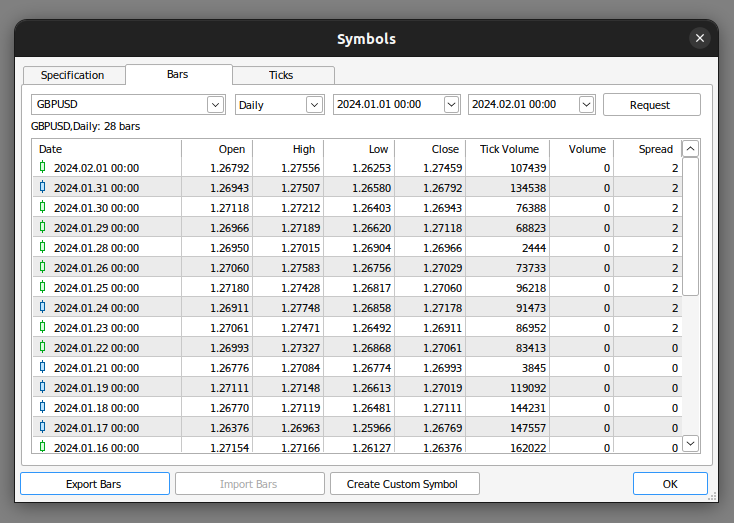
図2:データをエクスポートする準備
そして[Export Bars]ボタンをクリックし、Pythonで分析を続けます。
探索的データ分析
ボリンジャーバンドと価格水準の変化の相互作用を視覚化してみましょう。
まずは必要なライブラリをインポートすることから始めましょう。
#Import libraries
import pandas as pd
import numpy as np
import seaborn as sns
import pandas_ta as ta
次に、実証テストのために作成したcsvファイルを読み込みます。csvファイルがタブ区切りであることを示すために、sep=" \t" というパラメータを渡していることに注意してください。これはMetaTrader 5端末からの標準出力です。
#Read in the csv file
csv = pd.read_csv("/home/volatily/market_data/GBPUSD_Daily_20160103_20240131.csv",sep="\t")
ここで、予測期間を定義してみましょう。
#Define how far into the future we should forecast
look_ahead = 20
それでは、pandas taライブラリを使って、今あるデータのボリンジャーバンドを計算してみましょう。
#Add the Bollinger bands
csv.ta.bbands(length=30,std=2,append=True)
次に、将来の終値を格納する列が必要です。
#Add a column to show the future price
csv["Future Close"] = csv["Close"].shift(-look_ahead)
では、データにラベルを付けましょう。ボリンジャーバンドゾーン間の価格の変化を示すラベルと、ボリンジャーバンドゾーン間の価格の変化を示すラベルです。価格の変動は、上が1、下が0と表示されます。ボリンジャーバンドのラベルは上記で定義しました。
#Add the normal target, predicting changes in the close price
csv["Price Target"] = 0
csv["Price State"] = 0
#Label the data our conditions
#If price depreciated, our label is 0
csv.loc[csv["Close"] < csv["Close"].shift(look_ahead),"Price State"] = 0
csv.loc[csv["Close"] > csv["Future Close"], "Price Target"] = 0
#If price appreciated, our label is 1
csv.loc[csv["Close"] > csv["Close"].shift(look_ahead),"Price State"] = 1
csv.loc[csv["Close"] < csv["Future Close"], "Price Target"] = 1

#Label the Bollinger bands
#The label to store the current state of the market
csv["Current State"] = -1
#If price is above the upper-band, our label is 1
csv.loc[csv["Close"] > csv["BBU_30_2.0"], "Current State"] = 1
#If price is below the upper-band and still above the mid-band,our label is 2
csv.loc[(csv["Close"] < csv["BBU_30_2.0"]) & (csv["Close"] > csv["BBM_30_2.0"]),"Current State"] = 2
#If price is below the mid-band and still above the low-band,our label is 3
csv.loc[(csv["Close"] < csv["BBM_30_2.0"]) & (csv["Close"] > csv["BBL_30_2.0"]),"Current State"] = 3
#Finally, if price is beneath the low-band our label is 4
csv.loc[csv["Close"] < csv["BBL_30_2.0"], "Current State"] = 4
#Now we can add a column to denote the future state the market will be in
csv["State Target"] = csv["Current State"].shift(-look_ahead)
ヌルエントリを削除しましょう。
#Let's drop any NaN values
csv.dropna(inplace=True)
箱ひげ図を使った価格水準の変化から始めて、データを視覚化する準備が整いました。Y軸には終値を、X軸には2つの値を表示します。X軸の最初の値は、データの中で価格が下落した例を示しており、0と表示されています。0値の中に2つの箱ひげ図があります。青で示された最初のボックスプロットは、価格が20本のローソク足で下落し、さらに20本のローソク足で下落し続けた例を示しています。オレンジのボックスプロットは、価格が20本のローソク足で下落した後、次の20本のローソク足で上昇した例を示しています。私たちが収集したデータでは、価格水準が1.1を下回ると、常に反発しているように見えます。逆に、X軸の1の値も、その上に2つのボックスプロットがあります。最初の青い枠のプロットは、価格が上昇し、その後下落した事例をまとめたもので、2番目のオレンジの枠のプロットは、価格が上昇し、上昇し続けた事例をまとめたものです。
1の値、言い換えれば、価格が20本のローソク足で上昇した場合、青いボックスのプロットのテールはオレンジのボックスのプロットよりも大きいことに注意してください。これは、GBPUSDの為替レートが1.5レベルに向かって上昇するたびに、下落する傾向があることを示している可能性があります。一方、0列では、為替レートが1.1レベル付近まで下落すると、価格が反転して上昇し始める傾向があるように見えます。
#Notice that the tails of the box plots have regions where they stop overlapping these zones may guide us as boundaries
sns.boxplot(data=csv,x="Price State",y="Close",hue="Price Target")
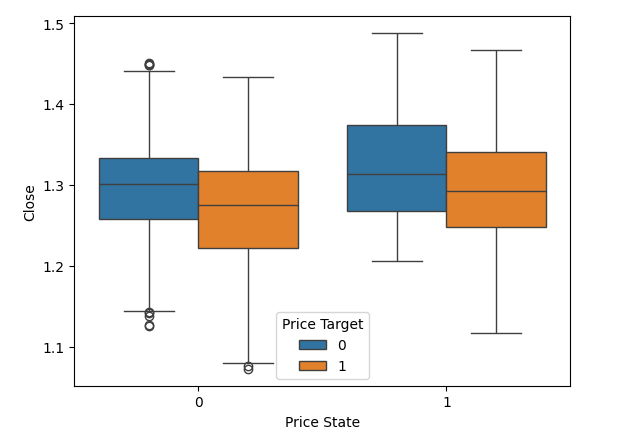
図3:価格水準の変化を視覚化する
また、ボリンジャーバンドで定義された状態を使用して、同様の可視化をおこなうこともできます。以前と同様に、終値がY軸に、ボリンジャーバンド内の価格の現在位置がX軸の4つの値で示されます。箱ひげ図には、当然ながら重ならない領域があります。これらの領域は、分類の境界となる可能性があります。例えば、価格が状態4、つまりボリンジャーバンドの完全に下にあり、1.1レベルに近づくと、常に反発しているように見えることを観察してください。
#Notice that the tails of the box plots have regions where they stop overlapping these zones may guide us as boundaries
sns.boxplot(data=csv,x="Current State",y="Close",hue="Price Target")
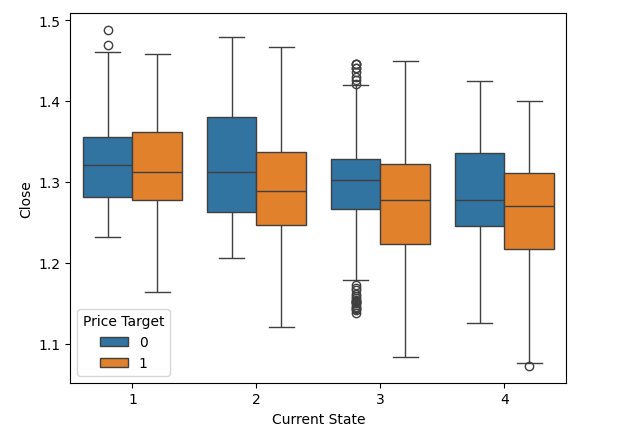
図4:ボリンジャーバンドの4つのゾーン内での価格の動きを視覚化
さらに、ボックスプロットを使って、価格が4つのボリンジャーバンドの状態の間でどのように推移するかを視覚化することもできます。例えば、下のボックスプロットは、Y軸に終値、X軸にボリンジャーバンドが形成する4つのゾーンを示す4つの値を示しています。各ボックスプロットは、そのゾーンに出現した後、価格がどこに推移したかを要約したものです。一緒にデータを解釈しましょう。最初の値である状態1には、3つのボックスプロットしかないことに注目してください。つまり、状態1から価格は3つの状態にしか遷移しません。状態1に留まるか、状態2か3に遷移するかです。
#Notice that the tails of the box plots have regions where they stop overlapping these zones may guide us as boundaries
sns.boxplot(data=csv,x="Current State",y="Close",hue="State Target")
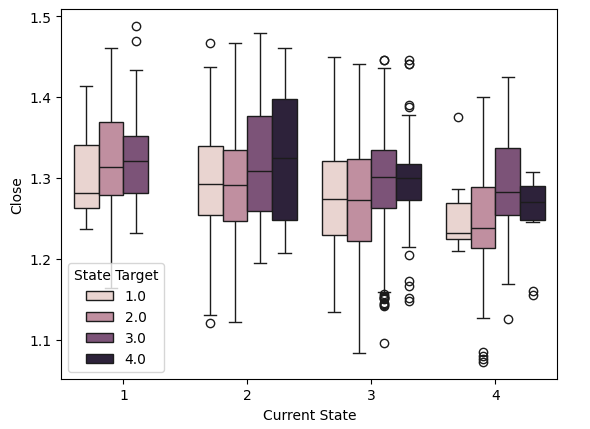
図5:4つのゾーン内での価格の動きを視覚化
#we have very poor separation in the data
sns.catplot(data=csv,x="Price State",y="Close",hue="Price Target")
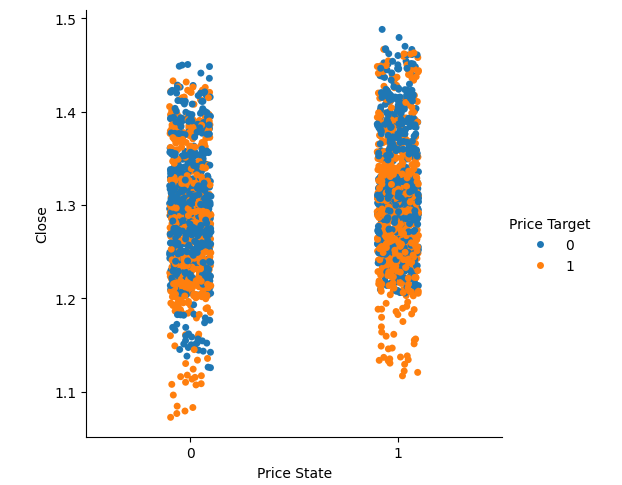
図6:データセットの分離を可視化する
ボリンジャーバンドで定義された4つの状態を使用して、同じ可視化をおこなうことができます。再び、青とオレンジの点は極端な価格水準で最もよく分かれていることがわかります。
#Visualizing the separation of data in the Bollinger band zones
sns.catplot(data=csv,x="Current State",y="Close",hue="Price Target")
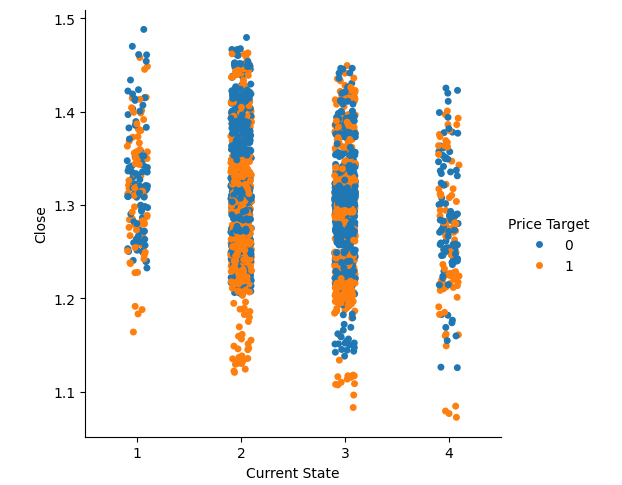
図7:データの分離をボリンジャーバンドゾーンで可視化する
X軸を終値、Y軸を将来の終値とする散布図を作成することができます。過去20本のローソク足のうち、価格が上昇したか下落したかに応じて、ドットをオレンジ色か青色に着色します。プロットの左下隅から右上隅まで金色の線を引くことを想像してください。この金色のラインより上のポイントはすべて、前の20本のローソク足が下落(青色)したか上昇(オレンジ色)したかにかかわらず、次の20本のローソク足で価格が上昇に終わった事例を表しています。金色の線の両側に青とオレンジの点が混在していることに注目してください。
さらに、終値1.3の位置に赤い仮想線を引くと、この線に多くの青とオレンジの点が接することになります。これは、現在の終値以外に、将来の終値に影響を与える変数があることを意味しています。これらの観察結果を解釈するもう一つの方法は、同じ入力値が異なる出力値になる可能性があるということであり、これは私たちのデータセットがノイジーであることを示しています。
#Notice that using the price target gives us beautiful separation in the data set
sns.scatterplot(data=csv,x="Close",y="Future Close",hue="Price Target")
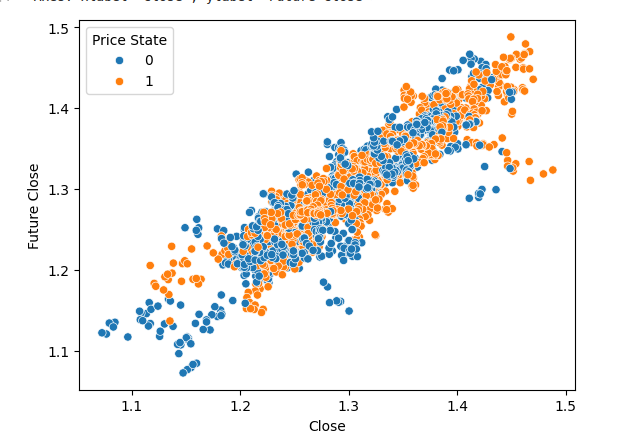
図8:データセットには自然分離がほとんどない
ここで、散布図に色を付けるために、ボリンジャーバンドの目標状態を用いて同じ可視化をおこないます。ボリンジャーバンドを使用した場合、データセット内の分離が非常に悪いことに注意してください。視覚的には、単純に価格そのものを使用したときに得られた分離よりもさらに悪く見えます。
#Using the Bollinger bands to define states, however, gives us rather mixed separation
sns.scatterplot(data=csv,x="Close",y="Future Close",hue="Current State")
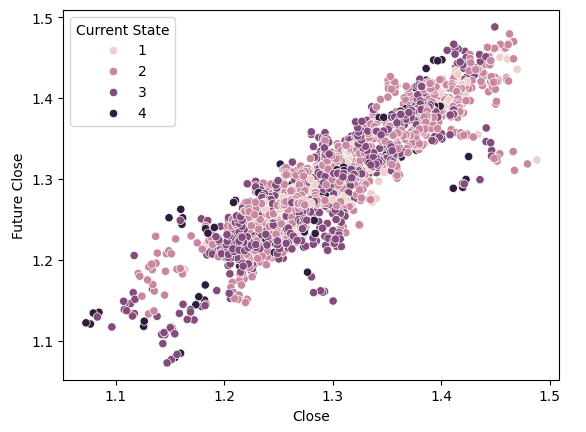
図9:ボリンジャーバンドゾーンによって作成されたデータセットの分離を視覚化する
それでは、価格水準の変化とボリンジャーバンドの状態の変化のどちらを予測する精度が高いかを判断するために、分析テストを実施してみましょう。まず、必要なライブラリをインポートします。
#Now let us compare our accuracy forecasting the original price target and the new Bollinger bands target
from sklearn.discriminant_analysis import LinearDiscriminantAnalysis
from sklearn.model_selection import TimeSeriesSplit
from sklearn.metrics import accuracy_score
次に、時系列クロスバリデーションのパラメータを定義します。最初のパラメータであるsplitsは、データから作成するパーティションの数を指定します。2番目のパラメータgapは、各パーティション間のギャップの大きさを決定します。このギャップは、少なくとも私たちの予想水平線と同じ大きさでなければなりません。
#Now let us define the cross validation parameters
splits = 10
gap = look_ahead
これで時系列オブジェクトが作成でき、訓練セットとテストセットの適切なインデックスが得られます。この例では、モデルの訓練と評価のために10組のインデックスを生成します。
#Now create the cross validation object
tscv = TimeSeriesSplit(n_splits=splits,gap=gap)
次に、各ターゲットを予測するモデルの精度を格納するDataFrameを作成します。
#We need a dataframe to store the accuracy associated with each target
target_accuracy = pd.DataFrame(index=np.arange(0,splits),columns=["Price Target Accuracy","New Target Accuracy"])
次に、モデルの入力を定義します。
#Define the inputs
predictors = ["Open","High","Low","Close"]
target = "Price Target"
では、相互検証のテストをおこないましょう。
#Now let us perform the cross validation
for i,(train,test) in enumerate(tscv.split(csv)):
    #First initialize the model
    model = LinearDiscriminantAnalysis()
    #Now train the model
    model.fit(csv.loc[train[0]:train[-1],predictors],csv.loc[train[0]:train[-1],target])
    #Now record the accuracy
    target_accuracy.iloc[i,0] = accuracy_score(csv.loc[test[0]:test[-1],target],model.predict(csv.loc[test[0]:test[-1],predictors]))
これでようやくテスト結果を分析できます。
target_accuracy
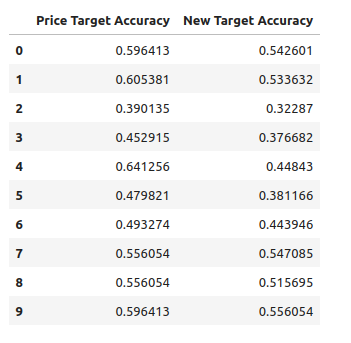
図10:モデルは、価格の変化を直接予測する場合により良い結果を示した
前述したように、私たちのテストは、私たちのモデルがボリンジャーバンドの推移よりも価格水準を予測する上で効果的であることを示しました。しかし、平均的には2つの戦略に大きな違いはありません。
次に、この戦略をMQL5コードに実装してバックテストをおこない、実際の市場データでどのように機能するかを確認します。
戦略の実行
初めに、プログラム全体で使用する必要なライブラリをインポートします。
//+------------------------------------------------------------------+
//|                                           Target Engineering.mq5 |
//|                                        Gamuchirai Zororo Ndawana |
//|                                             https://www.mql5.com |
//+------------------------------------------------------------------+
#property copyright "Gamuchirai Zororo Ndawana"
#property link      "https://www.mql5.com"
#property version   "1.00"
//+------------------------------------------------------------------+
//| Libraries we need                                                |
//+------------------------------------------------------------------+
/*
   This Expert Advisor will implement the Linear Discriminant Anlysis
   algorithm to help us successfully trade Bollinger Band Breakouts.

   Gamuchirai Zororo Ndawana
   Selebi Phikwe
   Botswana
   Wednesday 10 July 2024 15:42
*/
#include <Trade/Trade.mqh>//Trade class
CTrade Trade;
次に、ボリンジャーバンドの期間や標準偏差など、ユーザーが設定可能な入力を定義します。
//+------------------------------------------------------------------+
//| Input variables                                                  |
//+------------------------------------------------------------------+
input double bband_deviation = 2.0;//Bollinger Bands standard deviation
input int    bband_period = 60; //Bollinger Bands Period
input int look_ahead = 10; //How far into the future should we forecast?
int input  lot_multiple = 1; //How many times bigger than minimum lot?
int input    fetch = 200;//How much data should we fetch?
input double stop_loss_values = 1;//Stop loss values
続いて、アプリケーションで使用するグローバル変数を定義します。
//+------------------------------------------------------------------+
//| Global variables                                                 |
//+------------------------------------------------------------------+
int bband_handler;//Technical Indicator Handlers
vector bband_high_reading = vector::Ones(fetch);//Bollinger band high reading
vector bband_mid_reading = vector::Ones(fetch);//Bollinger band mid reading
vector bband_low_reading = vector::Ones(fetch);//Bollinger band low reading
double minimum_volume;//The smallest contract size allowed
double ask_price;//Ask
double bid_price;//Bid
vector input_data = vector::Zeros(fetch);//All our input data will be kept in vectors
int training_output_array[];//Our output data will be stored in a vector
vector output_data = vector::Zeros(fetch);
double variance;//This is the variance of our input data
int classes = 4;//The total number of output classes we have
vector mean_values = vector::Zeros(classes);//This vector will store the mean value for each class
vector probability_values = vector::Zeros(classes);//This vector will store the prior probability the target will belong each class
vector total_class_count = vector::Zeros(classes);//This vector will count the number of times each class was the target
bool model_trained = false;//Has our model been trained?
bool training_procedure_running = false;//Have we started the training process?
int forecast = 0;//Our model's forecast
double discriminant_values[4];//The discriminant function
int current_state = 0;//The current state of the system
次に、EAの初期化関数を定義する必要があります。この関数では、ボリンジャーバンド指標を初期化し、重要な市場データを取得します。
//+------------------------------------------------------------------+
//| Expert initialization function                                   |
//+------------------------------------------------------------------+
int OnInit()
  {
//--- Initialize the bollinger bands
   bband_handler = iBands(_Symbol,PERIOD_CURRENT,bband_period,0,bband_deviation,PRICE_CLOSE);
//--- Market data
   minimum_volume = SymbolInfoDouble(_Symbol,SYMBOL_VOLUME_MIN);
//--- End of initilization
   return(INIT_SUCCEEDED);
  }
続いて、コードをより小さく管理しやすいセグメントに分割するために、必要不可欠なヘルパー関数を定義します。最初に作る関数は、マーケットデータの更新を担当します。
//+------------------------------------------------------------------+
//|This function will update the price and other technical data      |
//+------------------------------------------------------------------+
void update_technical_data(void)
  {
//--- Update the bid and ask prices
   ask_price = SymbolInfoDouble(_Symbol,SYMBOL_ASK);
   bid_price = SymbolInfoDouble(_Symbol,SYMBOL_BID);
  }
続いて、初期化手順を編成する関数を実装する必要があります。この関数は、訓練データを取得し、モデルを適合させ、正しい順序で予測を開始することを保証します。
//+------------------------------------------------------------------+
//|This function will start training our model                       |
//+------------------------------------------------------------------+
void model_initialize(void)
  {
//--- First we have to fetch the input and output data
   Print("Initializing the model");
   int input_start = 1 + (look_ahead * 2);
   int output_start = 1+ look_ahead;
   fetch_input_data(input_start,fetch);
   fetch_output_data(output_start,fetch);
//--- Fit the model
   fit_lda_model();
  }
続いて、モデルを訓練するために入力データを取得する関数を定義します。重要なのは、モデルの入力は市場の現状、具体的には市場が現在どのゾーンを占めているかということです。そしてモデルは、市場が次にどのゾーンに移動するかを予測します。
//+------------------------------------------------------------------+
//|This function will fetch the inputs for our model                 |
//+------------------------------------------------------------------+
void fetch_input_data(int f_start,int f_fetch)
  {
//--- This function will fetch input data for our model   Print("Fetching input data");
//--- The input for our model will be the current state of the market
//--- To know the current state of the market, we have to first update our indicator readings
   bband_mid_reading.CopyIndicatorBuffer(bband_handler,0,f_start,f_fetch);
   bband_high_reading.CopyIndicatorBuffer(bband_handler,1,f_start,f_fetch);
   bband_low_reading.CopyIndicatorBuffer(bband_handler,2,f_start,f_fetch);
   vector historical_prices;
   historical_prices.CopyRates(_Symbol,PERIOD_CURRENT,COPY_RATES_CLOSE,f_start,f_fetch);
//--- Reshape the input data
   input_data.Resize(f_fetch);
//--- Now we will input the state of the market
   for(int i = 0; i < f_fetch;i++)
     {
      //--- Are we above the bollinger bands entirely?
      if(historical_prices[i] > bband_high_reading[i])
        {
         input_data[i] = 1;
        }

      //--- Are we between the upper and mid band?
      else
         if((historical_prices[i]  < bband_high_reading[i]) && (historical_prices[i] > bband_mid_reading[i]))
           {
            input_data[i] = 2;
           }

         //--- Are we between the mid and lower band?
         else
            if((historical_prices[i]  < bband_mid_reading[i]) && (historical_prices[i]  > bband_low_reading[i]))
              {
               input_data[i] = 3;
              }

            //--- Are we below the bollinger bands entirely?
            else
               if(historical_prices[i]  < bband_low_reading[i])
                 {
                  input_data[i] = 4;
                 }
     }
//--- Show the input data
   Print(input_data);
  }
次に、モデルの出力データを取得する関数が必要です。この作業は、入力データのフェッチよりも複雑です。価格が最終的にどのゾーンで終わったかを記録するだけでなく、各ゾーンが何回出力されたかも記録しなければなりません。このカウントは、後の段階でLDAモデルのパラメータを推定するために重要です。
この時点から、LDAモデルをフィットさせる準備が整いました。モデルのフィッティングには様々な方法がありますが、今日はある特定の方法に焦点を当てます。
//+---------------------------------------------------------------------+
//|Fetch the output data for our model                                  |
//+---------------------------------------------------------------------+
void fetch_output_data(int f_start,int f_fetch)
  {
//--- The output for our model will be the state of the market
//--- To know the state of the market, we have to first update our indicator readings
   Print("Fetching output data");
   bband_mid_reading.CopyIndicatorBuffer(bband_handler,0,f_start,(f_fetch));
   bband_high_reading.CopyIndicatorBuffer(bband_handler,1,f_start,(f_fetch));
   bband_low_reading.CopyIndicatorBuffer(bband_handler,2,f_start,(f_fetch));
   vector historical_prices;
   historical_prices.CopyRates(_Symbol,PERIOD_CURRENT,COPY_RATES_CLOSE,f_start,f_fetch);
//--- First we have to ensure that the class count has been reset
   total_class_count[0] = 0;
   total_class_count[1] = 0;
   total_class_count[2] = 0;
   total_class_count[3] = 0;
//--- Now we need to resize the matrix
   ArrayResize(training_output_array,f_fetch);
//--- Now we will input the state of the market to our output vector
   for(int i =0 ; i < f_fetch;i++)
     {
      //--- Are we above the bollinger bands entirely?
      if(historical_prices[i] > bband_high_reading[i])
        {
         training_output_array[i] = 1;
         total_class_count[0] += 1;
        }

      //--- Are we between the upper and mid band?
      else
         if((historical_prices[i] < bband_high_reading[i]) && (historical_prices[i] > bband_mid_reading[i]))
           {
            training_output_array[i] = 2;
            total_class_count[1] += 1;
           }

         //--- Are we between the mid and lower band?
         else
            if((historical_prices[i] < bband_mid_reading[i]) && (historical_prices[i] > bband_low_reading[i]))
              {
               training_output_array[i] = 3;
               total_class_count[2] += 1;
              }

            //--- Are we below the bollinger bands entirely?
            else
               if(historical_prices[i] < bband_low_reading[i])
                 {
                  training_output_array[i] = 4;
                  total_class_count[3] += 1;
                 }
     }
//--- Show the output data
   Print("Final state of output vector");
   ArrayPrint(training_output_array);
//--- Show the total number of times each class appeared as the target.
   Print(total_class_count);
  }
このプロセスは少し複雑で、詳しい説明が必要です。最初に、出力中の各クラスに対応するすべての入力値の総和を計算します。例えば、ターゲットが1であったすべてのインスタンスについて、1という出力にマッピングされたすべての入力値の合計を計算し、各出力クラスについて同様に計算します。 その後、各クラスのXの平均値を計算します。入力が複数ある場合は、各入力の平均値を計算します。次に、訓練セットのデータに基づいて、各クラスが実際のターゲットとして現れる確率を決定します。続いて、yの各クラスについてXの分散を計算します。 最後に、訓練手順の完了を示すフラグを更新します。
//+------------------------------------------------------------------+
//|Fit the LDA model                                                 |
//+------------------------------------------------------------------+
void fit_lda_model(void)
  {

//--- To fit the LDA model, we first need to know the mean value for each our inputs for each of our 4 classes
   double sum_class_one = 0;
   double sum_class_two = 0;
   double sum_class_three = 0;
   double sum_class_four = 0;

//--- In this case we only have 1 input
   for(int i = 0; i < fetch;i++)
     {
      //--- Class 1
      if(training_output_array[i] == 1)
        {
         sum_class_one += input_data[i];
        }
      //--- Class 2
      else
         if(training_output_array[i] == 2)
           {
            sum_class_two += input_data[i];
           }
         //--- Class 3
         else
            if(training_output_array[i] == 3)
              {
               sum_class_three += input_data[i];
              }
            //--- Class 4
            else
               if(training_output_array[i] == 4)
                 {
                  sum_class_four += input_data[i];
                 }
     }
//--- Show the sums
   Print("Class 1: ",sum_class_one," Class 2: ",sum_class_two," Class 3: ",sum_class_three," Class 4: ",sum_class_four);
//--- Calculate the mean value for each class
   mean_values[0] = sum_class_one / fetch;
   mean_values[1] = sum_class_two / fetch;
   mean_values[2] = sum_class_three / fetch;
   mean_values[3] = sum_class_four / fetch;
   Print("Mean values");
   Print(mean_values);
//--- Now we need to calculate class probabilities
   for(int i=0;i<classes;i++)
     {
      probability_values[i] = total_class_count[i] / fetch;
     }
   Print("Class probability values");
   Print(probability_values);
//--- Calculating the variance
   Print("Calculating the variance");
//--- Next we need to calculate the variance of the inputs within each class of y.
//--- This process can be simplified into 2 steps
//--- First we calculate the difference of each instance of x from the group mean.
   double squared_difference[4];
   for(int i =0; i < fetch;i++)
     {
      //--- If the output value was 1, find the input value that created the output
      //--- Calculate how far that value is from it's group mean and square the difference
      if(training_output_array[i] == 1)
        {
         squared_difference[0] = MathPow((input_data[i]-mean_values[0]),2);
        }

      else
         if(training_output_array[i] == 2)
           {
            squared_difference[1] = MathPow((input_data[i]-mean_values[1]),2);
           }

         else
            if(training_output_array[i] == 3)
              {
               squared_difference[2] = MathPow((input_data[i]-mean_values[2]),2);
              }

            else
               if(training_output_array[i] == 4)
                 {
                  squared_difference[3] = MathPow((input_data[i]-mean_values[3]),2);
                 }
     }

//--- Show the squared difference values
   Print("Squared difference value for each output value of y");
   ArrayPrint(squared_difference);

//--- Next we calculate the variance as the average squared difference from the mean
   variance = (1.0/(fetch - 4.0)) * (squared_difference[0] + squared_difference[1] + squared_difference[2] + squared_difference[3]);
   Print("Variance: ",variance);

//--- Update our flags to denote the model has been trained
   model_trained = true;
   training_procedure_running = false;
  }
//+------------------------------------------------------------------+
モデルで予測をおこなうには、まず市場から最新の入力データを取得することから始めます。この入力データを使って、可能性のある各クラスの判別関数を計算します。判別関数の値が最も高いクラスが予測クラスとなります。
MQL5では、配列にはArrayMaximum()という便利な関数があり、1次元配列の中で最大の値のインデックスを返します。配列はゼロインデックスなので、ArrayMaximum()の結果に1を加えて、予測クラスを得ます。
//+------------------------------------------------------------------+
//|This function will obtain forecasts from our model                |
//+------------------------------------------------------------------+
int model_forecast(void)
  {
//--- First we need to fetch the most recent input data
   fetch_input_data(0,1);
//--- Update the current state of the system
   current_state = input_data[0];

//--- We need to calculate the discriminant function for each class
//--- The predicted class is the one with the largest discriminant function
   Print("Calculating discriminant values.");
   for(int i = 0; i < classes; i++)
     {
      discriminant_values[i] = (input_data[0] * (mean_values[i]/variance) - (MathPow(mean_values[i],2)/(2*variance)) + (MathLog(probability_values[i])));
     }

   ArrayPrint(discriminant_values);
   return(ArrayMaximum(discriminant_values) + 1);
  }
モデルから予測を得たら、次のステップはそれを解釈し、それに従って決断することです。前述したように、私たちの取引シグナルは、価格が異なるゾーンに移動するとモデルが予測したときに生成されます。
- 予測がゾーン1からゾーン2への移行を示した場合、これは売りシグナルのトリガーとなります。
- 逆に、ゾーン4からゾーン3への移動予測は買いシグナルを示します。
- しかし、予測が価格が同じゾーンにとどまることを示唆している場合(例えば、ゾーン1からゾーン1へ)、これはエントリシグナルを発生させません。
//+--------------------------------------------------------------------+
//|This function will interpret out model's forecast and execute trades|
//+--------------------------------------------------------------------+
void find_entry(void)
  {
//--- If the model's forecast is not equal to the current state then we are interested
//--- Otherwise whenever the model forecasts that the state will remain the same
//--- We are uncertain whether price levels will rise or fall
   if(forecast != current_state)
     {
      //--- If the model forecasts that we will move from a small state to a greater state
      //--- That is from 1 to 2 or from 2 to 4 then that is a down move
      if(forecast > current_state)
        {
         Trade.Sell(minimum_volume * lot_multiple,_Symbol,bid_price,(bid_price + stop_loss_values),(bid_price - stop_loss_values));
        }

      //--- Otherwise we have a buy setup
      else
        {
         Trade.Buy(minimum_volume * lot_multiple,_Symbol,ask_price,(ask_price - stop_loss_values),(ask_price +stop_loss_values));
        }
     }
//--- Otherwise we do not have an entry signal from our model
  }
最後に、OnTick()イベントハンドラはイベントフローを管理し、モデルが学習され、他の取引条件を満たしたときのみ取引をおこなうようにします。
//+------------------------------------------------------------------+
//| Expert tick function                                             |
//+------------------------------------------------------------------+
void OnTick()
  {
//--- We must always update market data
   update_technical_data();
//--- First we must ensure our model has been trained
   switch(model_trained)
     {

      //--- Our model has been trained
      case(true):
         //--- If we have no open positions, let's obtain a forecast from our model
         if(PositionsTotal() == 0)
           {
            //--- Obtaining a forecast
            forecast = model_forecast();
            Comment("Model forecast: ",forecast);
            //--- Find an entry setup
            find_entry();
           }
         break;
      //--- End of case 1

      //--- Our model has not been trained
      default:
         //--- We haven't started the training procedure!
         if(!training_procedure_running)
           {
            Print("Our model has not been trained, starting the training procedure now.");
            //--- Initialize the model
            model_initialize();
           }

         break;
         //--- End of default case
     }
  }
//+------------------------------------------------------------------+
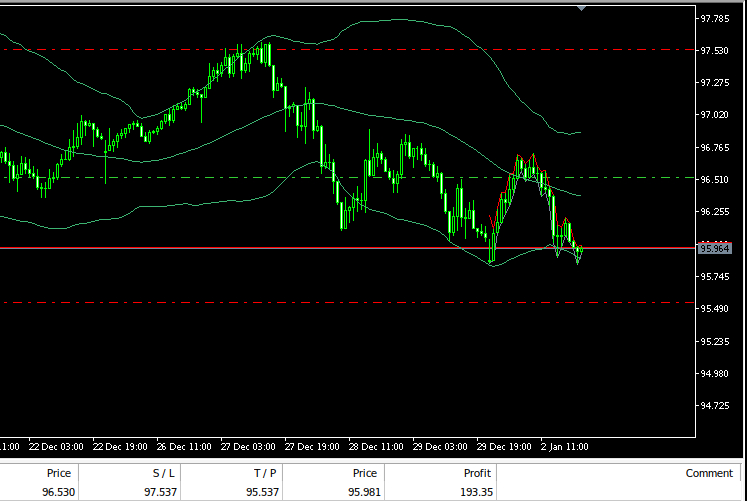
図11:私たちの取引システム
制限事項
れまでのところ、私たちの戦略は、解釈が難しいという大きな制約に直面しています。モデルが価格の停滞を予測しても、価格が上昇するのか下落するのかが明確でないのです。このトレードオフは、市場を4つの異なるゾーンに分類するという私たちの選択に起因しており、これにより価格変動の直接予測よりも精度は向上しますが、透明性が犠牲になっています。さらに、このアプローチでは、モデルがゾーンの変化を予測するのを待つ必要があるため、売買シグナルの頻度が少なくなる傾向があります。
結論
結論として、私たちの戦略は、機械学習、特に線形判別分析(LDA)の力を活用し、ボリンジャーバンドと組み合わせて売買シグナルを生成しています。精度の向上を図る一方で、このアプローチは透明性をある程度犠牲にしています。総じて、トレーダーはボリンジャーバンドのブレイクアウトを予測するよりも、価格の変動を予測する方が有利かもしれません。
MetaQuotes Ltdにより英語から翻訳されました。
元の記事: https://www.mql5.com/en/articles/15336
警告: これらの資料についてのすべての権利はMetaQuotes Ltd.が保有しています。これらの資料の全部または一部の複製や再プリントは禁じられています。
この記事はサイトのユーザーによって執筆されたものであり、著者の個人的な見解を反映しています。MetaQuotes Ltdは、提示された情報の正確性や、記載されているソリューション、戦略、または推奨事項の使用によって生じたいかなる結果についても責任を負いません。
 初心者からエキスパートへ:MQL5取引のエッセンシャルジャーニー
 MQL5取引ツールキット(第2回):ポジション管理EX5ライブラリの拡張と実装
 知っておくべきMQL5ウィザードのテクニック(第28回):学習率に関する入門書によるGANの再検討
 データサイエンスと機械学習(第27回):MetaTrader 5取引ボットにおける畳み込みニューラルネットワーク(CNN)に価値はあるか?
- 無料取引アプリ
- 8千を超えるシグナルをコピー
- 金融ニュースで金融マーケットを探索
新しい記事をご覧ください:古典的な戦略を再考する(パートII):ボリンジャーバンドのブレイクアウト。
著者ガムチライ・ゾロロ・ンダワナ
こんにちは、Ndawana
まず最初に、記事とAI神話の単純化に感謝するよ。)この記事から生成されたシグナルを私のコードで使おうとしています。
あなたのコードで単純な配列の代わりにベクトルを使った理由を説明してもらえますか?
こんにちは、ンダワナ
まず最初に、記事とAI神話の単純化に感謝するよ。)この記事から生成されたシグナルを私のコードで使おうとしています。
あなたのコードで単純な配列の代わりにベクトルを使った理由を説明してもらえますか?
私がベクターを好むのは、ベクターにしか使えない特別な関数があるからです。その特別な関数に加えて、ベクターはすべての要素に対して一度に計算を実行することもできます。
。
もし将来、役に立つような計算を思いついたとしたら、ベクターを使っているので、コードベースの修正がとても簡単になると想像してください。