Articles on trading system automation in MQL5
Read articles on the trading systems with a wide variety of ideas at the core. Learn how to use statistical methods and patterns on candlestick charts, how to filter signals and where to use semaphore indicators.
The MQL5 Wizard will help you create robots without programming to quickly check your trading ideas. Use the Wizard to learn about genetic algorithms.
Add a new article

You are missing trading opportunities:
- Free trading apps
- Over 8,000 signals for copying
- Economic news for exploring financial markets
Registration
Log in
You agree to website policy and terms of use
If you do not have an account, please register

Practical application of neural networks in trading. It's time to practice
The article provides a description and instructions for the practical use of neural network modules on the Matlab platform. It also covers the main aspects of creation of a trading system using the neural network module. In order to be able to introduce the complex within one article, I had to modify it so as to combine several neural network module functions in one program.


An Example of a Trading Strategy Based on Timezone Differences on Different Continents
Surfing the Internet, it is easy to find many strategies, which will give you a number of various recommendations. Let’s take an insider’s approach and look into the process of strategy creation, based on the differences in timezones on different continents.

Adaptive Trading Systems and Their Use in the MetaTrader 5 Client Terminal
This article suggests a variant of an adaptive system that consists of many strategies, each of which performs its own "virtual" trade operations. Real trading is performed in accordance with the signals of a most profitable strategy at the moment. Thanks to using of the object-oriented approach, classes for working with data and trade classes of the Standard library, the architecture of the system appeared to be simple and scalable; now you can easily create and analyze the adaptive systems that include hundreds of trade strategies.
Studying candlestick analysis techniques (part IV): Updates and additions to Pattern Analyzer
The article presents a new version of the Pattern Analyzer application. This version provides bug fixes and new features, as well as the revised user interface. Comments and suggestions from previous article were taken into account when developing the new version. The resulting application is described in this article.
Library for easy and quick development of MetaTrader programs (part XXIII): Base trading class - verification of valid parameters
In the article, we continue the development of the trading class by implementing the control over incorrect trading order parameter values and voicing trading events.

Automating Trading Strategies in MQL5 (Part 12): Implementing the Mitigation Order Blocks (MOB) Strategy
In this article, we build an MQL5 trading system that automates order block detection for Smart Money trading. We outline the strategy’s rules, implement the logic in MQL5, and integrate risk management for effective trade execution. Finally, we backtest the system to assess its performance and refine it for optimal results.

Reversing: Reducing maximum drawdown and testing other markets
In this article, we continue to dwell on reversing techniques. We will try to reduce the maximum balance drawdown till an acceptable level for the instruments considered earlier. We will see if the measures will reduce the profit. We will also check how the reversing method performs on other markets, including stock, commodity, index, ETF and agricultural markets. Attention, the article contains a lot of images!
Library for easy and quick development of MetaTrader programs (part IV): Trading events
In the previous articles, we started creating a large cross-platform library simplifying the development of programs for MetaTrader 5 and MetaTrader 4 platforms. We already have collections of historical orders and deals, market orders and positions, as well as the class for convenient selection and sorting of orders. In this part, we will continue the development of the base object and teach the Engine Library to track trading events on the account.

The Simple Example of Creating an Indicator Using Fuzzy Logic
The article is devoted to the practical application of the fuzzy logic concept for financial markets analysis. We propose the example of the indicator generating signals based on two fuzzy rules based on Envelopes indicator. The developed indicator uses several indicator buffers: 7 buffers for calculations, 5 buffers for the charts display and 2 color buffers.
Timeseries in DoEasy library (part 40): Library-based indicators - updating data in real time
The article considers the development of a simple multi-period indicator based on the DoEasy library. Let's improve the timeseries classes to receive data from any timeframes to display it on the current chart period.
Creating a new trading strategy using a technology of resolving entries into indicators
The article suggests a technology helping everyone to create custom trading strategies by assembling an individual indicator set, as well as to develop custom market entry signals.

Learn how to design a trading system by Fractals
This article is a new one from our series about how to design a trading system based on the most popular technical indicators. We will learn a new indicator which Fractals indicator and we will learn how to design a trading system based on it to be executed in the MetaTrader 5 terminal.

Learn how to design a trading system by Volumes
Here is a new article from our series about learning how to design a trading system based on the most popular technical indicators. The current article will be devoted to the Volumes indicator. Volume as a concept is one of the very important factors in financial markets trading and we have to pay attention to it. Through this article, we will learn how to design a simple trading system by Volumes indicator.

Self-adapting algorithm (Part III): Abandoning optimization
It is impossible to get a truly stable algorithm if we use optimization based on historical data to select parameters. A stable algorithm should be aware of what parameters are needed when working on any trading instrument at any time. It should not forecast or guess, it should know for sure.

Mastering Market Dynamics: Creating a Support and Resistance Strategy Expert Advisor (EA)
A comprehensive guide to developing an automated trading algorithm based on the Support and Resistance strategy. Detailed information on all aspects of creating an expert advisor in MQL5 and testing it in MetaTrader 5 – from analyzing price range behaviors to risk management.

Larry Williams Market Secrets (Part 2): Automating a Market Structure Trading System
Learn how to automate Larry Williams market structure concepts in MQL5 by building a complete Expert Advisor that reads swing points, generates trade signals, manages risk, and applies a dynamic trailing stop strategy.

Market math: profit, loss and costs
In this article, I will show you how to calculate the total profit or loss of any trade, including commission and swap. I will provide the most accurate mathematical model and use it to write the code and compare it with the standard. Besides, I will also try to get on the inside of the main MQL5 function to calculate profit and get to the bottom of all the necessary values from the specification.
Library for easy and quick development of MetaTrader programs (part XXIV): Base trading class - auto correction of invalid parameters
In this article, we will have a look at the handler of invalid trading order parameters and improve the trading event class. Now all trading events (both single ones and the ones occurred simultaneously within one tick) will be defined in programs correctly.

Learn how to design a trading system by Momentum
In my previous article, I mentioned the importance of identifying the trend which is the direction of prices. In this article I will share one of the most important concepts and indicators which is the Momentum indicator. I will share how to design a trading system based on this Momentum indicator.

The Optimal Method for Calculation of Total Position Volume by Specified Magic Number
The problem of calculation of the total position volume of the specified symbol and magic number is considered in this article. The proposed method requests only the minimum necessary part of the history of deals, finds the closest time when the total position was equal to zero, and performs the calculations with the recent deals. Working with global variables of the client terminal is also considered.

Reversing: Formalizing the entry point and developing a manual trading algorithm
This is the last article within the series devoted to the Reversing trading strategy. Here we will try to solve the problem, which caused the testing results instability in previous articles. We will also develop and test our own algorithm for manual trading in any market using the reversing strategy.

Dealing with Time (Part 2): The Functions
Determing the broker offset and GMT automatically. Instead of asking the support of your broker, from whom you will probably receive an insufficient answer (who would be willing to explain a missing hour), we simply look ourselves how they time their prices in the weeks of the time changes — but not cumbersome by hand, we let a program do it — why do we have a PC after all.

Evaluating the ability of Fractal index and Hurst exponent to predict financial time series
Studies related to search for the fractal behavior of financial data suggest that behind the seemingly chaotic behavior of economic time series there are hidden stable mechanisms of participants' collective behavior. These mechanisms can lead to the emergence of price dynamics on the exchange, which can define and describe specific properties of price series. When applied to trading, one could benefit from the indicators which can efficiently and reliably estimate the fractal parameters in the scale and time frame, which are relevant in practice.
Library for easy and quick development of MetaTrader programs (part XXXIII): Pending trading requests - closing positions under certain conditions
We continue the development of the library functionality featuring trading using pending requests. We have already implemented sending conditional trading requests for opening positions and placing pending orders. In the current article, we will implement conditional position closure – full, partial and closing by an opposite position.

Deep Learning Forecast and ordering with Python and MetaTrader5 python package and ONNX model file
The project involves using Python for deep learning-based forecasting in financial markets. We will explore the intricacies of testing the model's performance using key metrics such as Mean Absolute Error (MAE), Mean Squared Error (MSE), and R-squared (R2) and we will learn how to wrap everything into an executable. We will also make a ONNX model file with its EA.

Neural networks made easy (Part 7): Adaptive optimization methods
In previous articles, we used stochastic gradient descent to train a neural network using the same learning rate for all neurons within the network. In this article, I propose to look towards adaptive learning methods which enable changing of the learning rate for each neuron. We will also consider the pros and cons of this approach.

Bi-Directional Trading and Hedging of Positions in MetaTrader 5 Using the HedgeTerminal API, Part 2
This article describes a new approach to hedging of positions and draws the line in the debates between users of MetaTrader 4 and MetaTrader 5 about this matter. It is a continuation of the first part: "Bi-Directional Trading and Hedging of Positions in MetaTrader 5 Using the HedgeTerminal Panel, Part 1". In the second part, we discuss integration of custom Expert Advisors with HedgeTerminalAPI, which is a special visualization library designed for bi-directional trading in a comfortable software environment providing tools for convenient position management.

Neural networks made easy (Part 2): Network training and testing
In this second article, we will continue to study neural networks and will consider an example of using our created CNet class in Expert Advisors. We will work with two neural network models, which show similar results both in terms of training time and prediction accuracy.
Library for easy and quick development of MetaTrader programs (part XXVII): Working with trading requests - placing pending orders
In this article, we will continue the development of trading requests, implement placing pending orders and eliminate detected shortcomings of the trading class operation.
Manual charting and trading toolkit (Part II). Chart graphics drawing tools
This is the next article within the series, in which I show how I created a convenient library for manual application of chart graphics by utilizing keyboard shortcuts. The tools used include straight lines and their combinations. In this part, we will view how the drawing tools are applied using the functions described in the first part. The library can be connected to any Expert Advisor or indicator which will greatly simplify the charting tasks. This solution DOES NOT use external dlls, while all the commands are implemented using built-in MQL tools.

Modified Grid-Hedge EA in MQL5 (Part I): Making a Simple Hedge EA
We will be creating a simple hedge EA as a base for our more advanced Grid-Hedge EA, which will be a mixture of classic grid and classic hedge strategies. By the end of this article, you will know how to create a simple hedge strategy, and you will also get to know what people say about whether this strategy is truly 100% profitable.

Charts and diagrams in HTML
Today it is difficult to find a computer that does not have an installed web-browser. For a long time browsers have been evolving and improving. This article discusses the simple and safe way to create of charts and diagrams, based on the the information, obtained from MetaTrader 5 client terminal for displaying them in the browser.

Learn how to deal with date and time in MQL5
A new article about a new important topic which is dealing with date and time. As traders or programmers of trading tools, it is very crucial to understand how to deal with these two aspects date and time very well and effectively. So, I will share some important information about how we can deal with date and time to create effective trading tools smoothly and simply without any complicity as much as I can.

Neural networks made easy (Part 4): Recurrent networks
We continue studying the world of neural networks. In this article, we will consider another type of neural networks, recurrent networks. This type is proposed for use with time series, which are represented in the MetaTrader 5 trading platform by price charts.
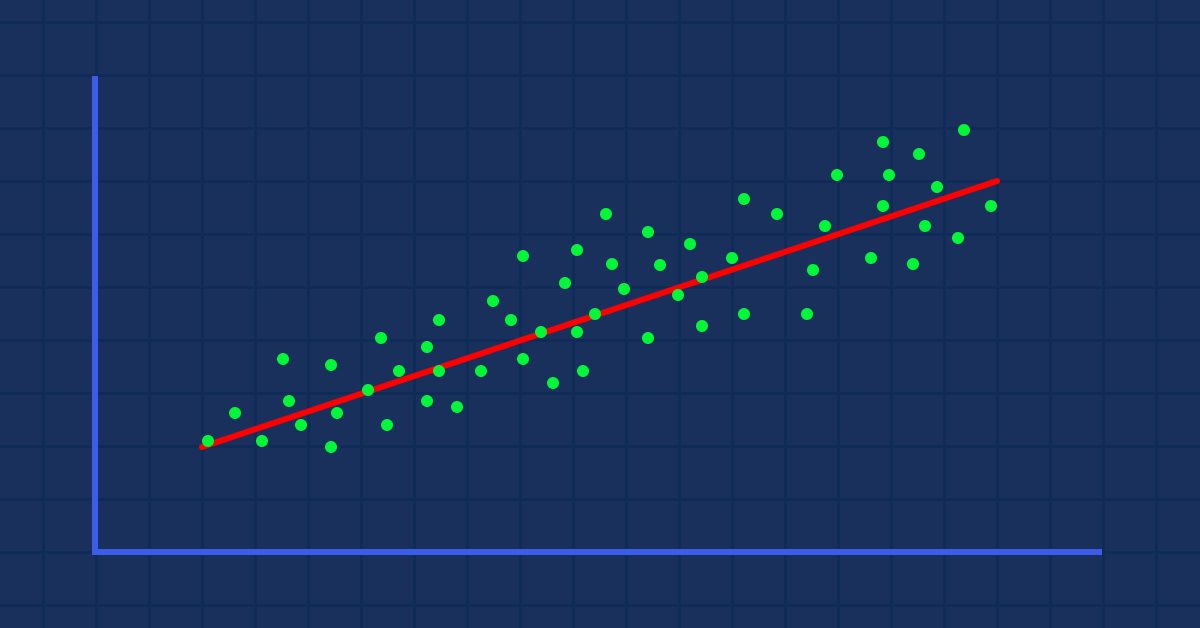
Data Science and Machine Learning (Part 01): Linear Regression
It's time for us as traders to train our systems and ourselves to make decisions based on what number says. Not on our eyes, and what our guts make us believe, this is where the world is heading so, let us move perpendicular to the direction of the wave.

Automating Trading Strategies in MQL5 (Part 36): Supply and Demand Trading with Retest and Impulse Model
In this article, we create a supply and demand trading system in MQL5 that identifies supply and demand zones through consolidation ranges, validates them with impulsive moves, and trades retests with trend confirmation and customizable risk parameters. The system visualizes zones with dynamic labels and colors, supporting trailing stops for risk management.
Timeseries in DoEasy library (part 37): Timeseries collection - database of timeseries by symbols and periods
The article deals with the development of the timeseries collection of specified timeframes for all symbols used in the program. We are going to develop the timeseries collection, the methods of setting collection's timeseries parameters and the initial filling of developed timeseries with historical data.

MQL5 Integration: Python
Python is a well-known and popular programming language with many features, especially in the fields of finance, data science, Artificial Intelligence, and Machine Learning. Python is a powerful tool that can be useful in trading as well. MQL5 allows us to use this powerful language as an integration to get our objectives done effectively. In this article, we will share how we can use Python as an integration in MQL5 after learning some basic information about Python.

Developing a cross-platform grider EA (part II): Range-based grid in trend direction
In this article, we will develop a grider EA for trading in a trend direction within a range. Thus, the EA is to be suited mostly for Forex and commodity markets. According to the tests, our grider showed profit since 2018. Unfortunately, this is not true for the period of 2014-2018.
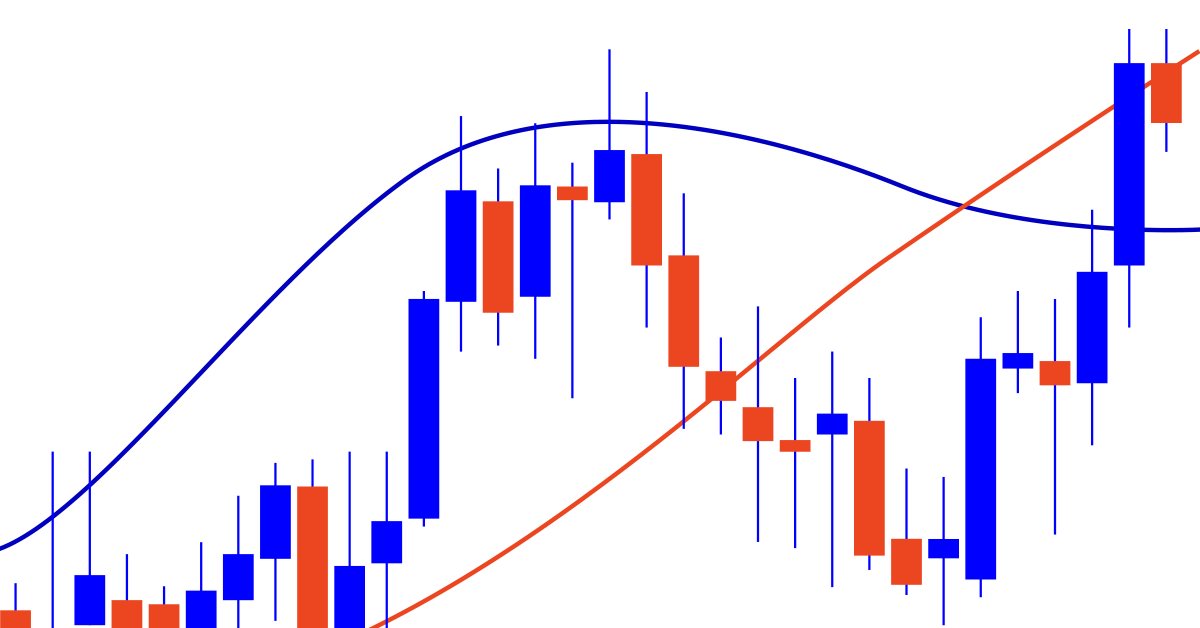
What you can do with Moving Averages
The article considers several methods of applying the Moving Average indicator. Each method involving a curve analysis is accompanied by indicators visualizing the idea. In most cases, the ideas shown here belong to their respected authors. My sole task was to bring them together to let you see the main approaches and, hopefully, make more reasonable trading decisions. MQL5 proficiency level — basic.