
Reimagining Classic Strategies: Crude Oil
Introduction
Oil is the most important commodity on the face of the earth. Crude oil in its original form is useless; however, after it is refined, it is used across industries, from as simple as agriculture to as complex as pharmaceuticals. Oil is one of a handful of commodities that are truly demanded across all industries. The price of oil is a key econometric indicator of global production levels and economic growth levels.
Global crude trade is dominated by two benchmarks, West Texas Intermediate (WTI) which is the North American benchmark and Brent which is used to quote the majority of the world's crude.
In this discussion, we will revisit a classic crude oil spread trading strategy, with the hopes that we will be able to find an optimal machine learning strategy to make this classic strategy more palatable in a modern oil market that is dominated by algorithms.
We will begin our discussion by first highlighting the differences between the two oil benchmarks mentioned above. From there, we will begin visualizing the Brent-WTI spread in MQL5 and discuss the classical spread trading strategy. This will set us up to demonstrate how one may utilize supervised machine learning on the spread between West Texas Intermediate and Brent oil prices to potentially uncover leading indicators of changes in price. After reading this article, you will have a firm grasp of the following:
- The difference between the Brent and the WTI benchmarks, and why they are important.
- How to use MQL5 matrix and vector functions to build compact machine learning models that are easy to maintain and implement from scratch.
- How to employ the pseudo inverse technique to find a least-squares solution to forecast the future price of Brent, using the WTI-Brent spread.
Global Crude Oil Benchmark: Brent
When crude oil is extracted from the ground, it is a mixture of some oxygen, carbon, hydrogen and sulfur impurities. Brent is a classification given to blends of crude oil that are considered light and sweet. To be considered sweet the blend must have low concentrations of sulfur impurities. Moreover it is called light because it has low density. These properties are desirable because they inform us that the blend will be refined easily. The last quality of Brent we will highlight is that Brent is lower quality than WTI. Brent is primarily extracted in the North Sea. After being extracted, it is easily stored in barrels on board large oil tankers.This gives Brent a distinct advantage over WTI, it is very accessible. Brent is currently trading at a premium to WTI.

Fig 1: Historical Price of Brent in MQL5
North American Crude Oil Benchmark: West Texas Intermediate
West Texas Intermediate (WTI) is a classification given to a certain blend of crude oil, it must be a "light sweet" oil. WTI is extracted in across the USA but mainly in Texas. It is sweeter and lighter than Brent, meaning it is easier to refine into finished goods. Historically, it was extracted in landlocked parts of the USA and therefore is was a lot less accessible than Brent. However due to massive investments made in the Gulf Coast and the repeal of the oil export ban in 2015, WTI is now more accessible than it has ever been.
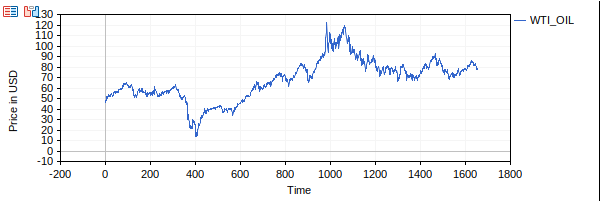
Fig 2: Historical Price of WTI in MQL5
Getting Started: Visualizing The Spread
To get started we can create a handy script to visualize the spread between the two commodities. We can use the MQL5 Graphics library to help us easily plot any function we desire. The graphics library manages scaling for you, which is always helpful to have.After including the graphics library, you will notice a variable defined as 'consumption'. This variable helps us easily select half, a quarter or whatever fraction of the total data that is available.
Given that we are requesting historical data on two different assets, we need to know the total number of bars available on each market. From there we assume the smallest number of bars available are the total number of bars available. We use a ternary operator to select the right number of bars.
After we have determined the right number of bars to use, we can plot the spread.
//+------------------------------------------------------------------+
//|                                             Brent-WTI Spread.mq5 |
//|                                  Copyright 2024, MetaQuotes Ltd. |
//|                                             https://www.mql5.com |
//+------------------------------------------------------------------+
#property copyright "Copyright 2024, MetaQuotes Ltd."
#property link      "https://www.mql5.com"
#property version   "1.00"
#include <Graphics\Graphic.mqh>
//Set this value between 0 and 1 to control how much data is used
double consumption = 1.0;
int brent_bars = (int) NormalizeDouble((iBars("UK Brent Oil",PERIOD_CURRENT) * consumption),0);
int wti_bars = (int) NormalizeDouble((iBars("WTI_OIL",PERIOD_CURRENT) * consumption),0);
//We want to know which symbol has the least number of bars.
int max_bars = (brent_bars < wti_bars) ? brent_bars : wti_bars;

//+------------------------------------------------------------------+
//|This event handler is only triggered when the script launches     |
//+------------------------------------------------------------------+
void OnStart()
  {
   CGraphic graphic;
   double from = 0;
   double to  = max_bars;
   double step = 1;
   graphic.Create(0,"G",0,0,0,600,200);
   CColorGenerator generator;
   uint spread = generator.Next();
   CCurve *curve = graphic.CurveAdd(SpreadFunction,from,to,step,spread,CURVE_LINES,"Blue");
   curve.Name("Spread");
   graphic.XAxis().Name("Time");
   graphic.XAxis().NameSize(12);
   graphic.YAxis().Name("Brent-WTI Spread");
   graphic.YAxis().NameSize(12);
   graphic.CurvePlotAll();
   graphic.Update();
  }
//+------------------------------------------------------------------+

//+------------------------------------------------------------------+
//|This function returns the Brent-WTI spread                        |
//+------------------------------------------------------------------+
double SpreadFunction(double x)
  {
   return(iClose("UK Brent Oil",PERIOD_CURRENT,(max_bars - x)) - iClose("WTI_OIL",PERIOD_CURRENT,(max_bars - x)));
  }
//+------------------------------------------------------------------+

Fig 3: Visualizing the Brent-WTI spread in MQL5.
Overview of Our Trading Strategy: Employing Supervised Machine Learning
The premise of the classic crude oil strategy was that; price equilibrium will always be restored in the long run. The classic oil spread trading strategy would assert that we start by observing the current spread between Brent and WTI. If the spread is above its baseline, for example the baseline could be the 20 moving average, then we would infer that the spread will revert to its mean in the nearby future. Therefore if Brent prices were rising, we would sell. Conversely if Brent prices were falling, we would buy.
However, ever since the time this strategy was developed, the oil market has changed considerably. We need an objective procedure to infer what relationships exist between the spread and the future price of Brent. Machine learning allows the computer to learn its own trading rules from any relationships it can observe analytically.
In order to allow our computer to create its own trading strategy, we start off with a data matrix A.
A symbolizes the historical price data we have available on Brent. We will use the close price, the spread and an intercept that has a constant value of one. We will then build a separate column vector, x, that will have 1 coefficient for each column in A. This value will be calculated directly from the market data, and will be used by our model to forecast future price.
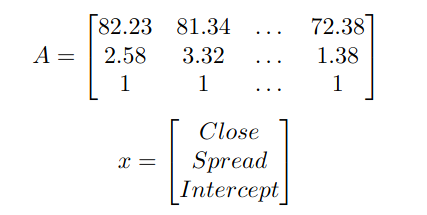
Fig 4: Framing the least-squares problem.
After creating our input matrix A, we need to know what closing prices of Brent were paired with each of the inputs in A. We will store the output price in a vector, y. Our goal is to find a way to map the input data matrix A to the output data vector y whilst approximating the lowest error possible across all the training observations we have. The answer to this problem is called the least-squared solution.
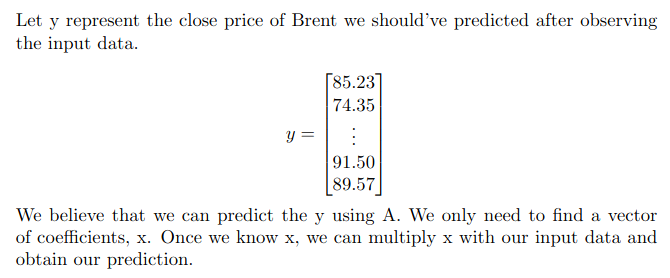
Fig 5: Our output vector y.
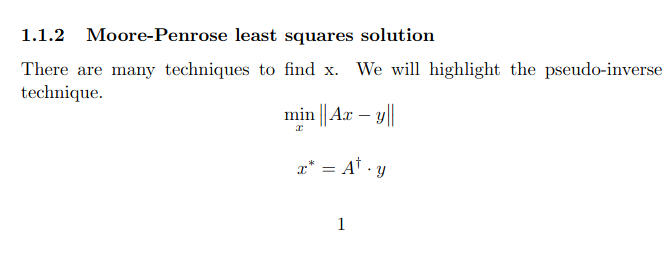
Fig 6: Introducing the pseudo-inverse solution.
The two equations above first tell us that we are looking for a value of x that minimizes the error between our prediction, A * x, and the actual Brent closing price, y. Notice the double vertical lines around Ax-y. These double vertical lines represent the L2 norm. When we are dealing with physical objects in the real world, we can ask "How big is it?". However, when we want to know how big a vector or a matrix is, we ask for its norm.There are different ways we can calculate the norm, most often you will encounter the L1 or L2 norm. For our discussion we shall only consider the L2 norm.
The L2 norm is calculated by squaring each entity in the vector, summing up all the squared values and then calculating the square root of the sum. It is also called the Euclidean norm. In simpler language we would say "We are looking for values of x that reduce the size of all the errors our model makes", and in more technical language we would say "Find optimal values of x that minimize the L2 norm of the residuals".
The value of x that satisfies our constraints is denoted x*. To find x* we calculate the dot product of the pseudo-inverse of A and y. It is highly unlikely that you will ever need to implement the pseudo-inverse function yourself, unless as an exercise in linear algebra. Otherwise, we will rely on the built in function in MQL5.
//+------------------------------------------------------------------+
//|Demonstrating the pseudo-inverse solution in action.              |                                                                |
//+------------------------------------------------------------------+
void OnStart()
  {
//Training and test data
   matrix A; //A is the input data. look at the figure above if you need a reminder.
   matrix y,x; //y is the output data, x is the coefficients.
   A.CopyRates(_Symbol,PERIOD_CURRENT,COPY_RATES_OHLC,20,1000);
   y.CopyRates(_Symbol,PERIOD_CURRENT,COPY_RATES_CLOSE,1,1000);
   A.Reshape(1000,4);
   y.Reshape(1000,1);
   Print("Attempting Psuedoinverse Decomposition");
   Print("Attempting to calculate the Pseudoinverse Coefficients: ");
   x = A.PInv().MatMul(y);
   Print("Coefficients: ");
   Print("Open: ",x[0][0],"\nHigh: ",x[1][0],"\nLow: ",x[3][0],"\nClose: ",x[3][0]);
  }
//+------------------------------------------------------------------+

Fig 7: An example implementation of the pseudo-inverse technique.
The code above provides a straightforward demonstration of utilizing the pseudo-inverse technique. In this example, we aim to predict the closing price of a symbol using its current open, high, low, and close prices. This simple example encapsulates the core principles we need to understand. We begin by defining our input data, which is stored in matrix A. To fetch the data, we use the CopyRates function, which requires the following parameters in the specified order:
- Symbol name: The name of the symbol we wish to trade.
- Timeframe: The timeframe that aligns with our risk levels.
- Rates mask: This specifies which prices to copy, allowing us to select, for instance, only the open prices if desired.
- From: The start date for copying the data, ensuring a gap between the input and output data and that the input data starts from an earlier date.
- Count: The number of candles to be copied.
After setting up the input data matrix A, we repeat the process for the output data matrix y. We then reshape both matrices to ensure they are appropriately sized and compatible for the operations we intend to perform.
Next, we populate the x column vector with values derived from A and y. Fortunately, the MQL5 API supports chaining matrix operations, allowing us to compute the pseudo-inverse solution with a single line of code. Once completed, we can print out the coefficients in our x column vector.
We will use the same steps to develop our trading strategy. The only additional step, not demonstrated here, is using our model to make predictions, which will be explained later in our discussion. With this foundation, we are ready to start building our trading strategy.
Putting it All Together
We are now ready to define the heart of our algorithm. We begin by first including the Trade library necessary for us to open and manage positions.
//+------------------------------------------------------------------+
//|                                                     Brent EA.mq5 |
//|                                  Copyright 2024, MetaQuotes Ltd. |
//|                                             https://www.mql5.com |
//+------------------------------------------------------------------+
#property copyright "Copyright 2024, MetaQuotes Ltd."
#property link      "https://www.mql5.com"
#property version   "1.00"

//Libraries
#include  <Trade\Trade.mqh>
CTrade ExtTrade;
#include <TrailingStop\ATRTrailingStop3.mqh>
ATRTrailingStop ExtATRTrailingStop;
Subsequently, we define our trading position size and risk parameters. The first input determines how many times larger than the minimum lot each position will be. The second input sets the profit level at which all open positions will be closed. It is followed by the input parameter that limits the total draw down we will allow on this account. And lastly, we set how many positions we would like to open each time we place a trade.
//Inputs
input double lot_multiple = 1.0;
input double profit_target = 10;
input double max_loss = 20;
input int position_size = 2;
Moving on, we now need to know how many bars are available in each market so that we make sure we are always trying to copy the right number of bars that will be available in both markets. The "right number" in our case, is the smallest number of bars available. We also defined a variable called "consumption" because it allows us control how much data we want to use, in the code example below we are utilizing 1% of all the available historical data.
//Set this value between 0 and 1 to control how much data is used
double consumption = 0.01;
//We want to know which symbol has the least number of bars.
double brent_bars = (double) NormalizeDouble((iBars("UK Brent Oil",PERIOD_CURRENT) * consumption),0);
double wti_bars = (double) NormalizeDouble((iBars("WTI_OIL",PERIOD_CURRENT) * consumption),0);
Here is where we actually determine which market has fewer bars available, and use that number of bars as our limit. If we skipped this step, the dates between the two markets may not align unless your broker guarantees evenly matched datasets on historical prices for both assets. "Look Ahead" is our forecast horizon, or how many steps into the future we are forecasting.
//Select the lowest
double max_bars = (brent_bars < wti_bars) ? brent_bars : wti_bars;
//How far into the future are we forecasting
double look_ahead = NormalizeDouble((max_bars / 4),0);
//How many bars should we fetch?
int fetch = (int) (max_bars - look_ahead) - 1;
Moving on, we now need to define variables for those that we defined in our notation; I will include a copy of the image so you don't have to scroll up. Remember, A is the matrix that stores our input data, we can choose as many or as few inputs as we desire, in this example I will use 3 inputs. x* represent the value of x that minimizes the L2 norm of our residuals.

Fig 6: A reminder of the notation we defined.
//Matrix A stores our inputs. y is the output. x is the coefficients.
matrix A = matrix::Zeros(fetch,6);
matrix y = matrix::Zeros(fetch,1);
vector wti_price = vector::Zeros(fetch);
vector brent_price = vector::Zeros(fetch);
vector spread;
vector intercept = vector::Ones(fetch);
matrix x = matrix::Zeros(6,1);
double forecast = 0;
double ask = 0;
double bid = 0;
double min_volume = 0;
We will define two string variables to store the names of the symbols we wish to trade.After completing this, we have now arrived at our OnInit function. This function is simple in our case, we just need to know the minimum trading volume allowed on Brent.
string brent = "UK Brent Oil";
string wti = "WTI_OIL";
bool model_initialized = false;
int OnInit()
  {
//Initialise trailing stops
   if(atr_multiple > 0)
      ExtATRTrailingStop.Init(atr_multiple);
   min_volume = SymbolInfoDouble(brent,SYMBOL_VOLUME_MIN);
   return(INIT_SUCCEEDED);
//---
  }
We are now working on our OnTick function. Inside the body, we first update the prices of the bid and ask that we are keeping track of. Then we check if our model has been initialized, if it hasn't it will be trained and fit otherwise if it has we move on to check if we have any open positions. In the event that we have no open positions, we get a forecast from our model and then trade in the direction our model is forecasting. Otherwise, if we have open positions, we will check if our positions have not exceeded the profit target or the maximum draw down level.
//+------------------------------------------------------------------+
//| Expert tick function                                             |
//+------------------------------------------------------------------+
void OnTick()
  {
//---
   ask = SymbolInfoDouble(brent,SYMBOL_ASK);
   bid = SymbolInfoDouble(brent,SYMBOL_BID);
   if(model_initialized)
     {
      if(PositionsTotal() == 0)
        {
         forecast = 0;
         forecast = ModelForecast();
         InterpretForecast();
        }

      else
        {
         ManageTrades();
        }
     }

   else
     {
      model_initialized = InitializeModel();
     }

  }
//+------------------------------------------------------------------+
This is the function responsible for checking if we have breached risk levels or achieved our profit target. It is only called in the OnTick event handler in conditions where we have open trades.
void ManageTrades()
  {
   if(AccountInfoDouble(ACCOUNT_PROFIT) > profit_target)
      CloseAll();
   if(AccountInfoDouble(ACCOUNT_PROFIT) < (-1 * max_loss))
      CloseAll();
  }
Whenever our model has made a forecast, we will call InterpretForecast to make sense of our model's predictions and open the appropriate positions in response.
void InterpretForecast()
  {
   if(forecast != 0)
     {
      if(forecast > iClose(_Symbol,PERIOD_CURRENT,0))
        {
         check_buy();
        }

      else
         if(forecast < iClose(_Symbol,PERIOD_CURRENT,0))
           {
            check_sell();
           }
     }
  }
We have a dedicated procedure for entering into buy positions. Note that the minimum volume we determined earlier is being multiplied by the lot multiple input, giving the user control over the lot size used to enter trades.
void check_buy()
  {
   if(PositionsTotal() == 0)
     {
      for(int i = 0; i < position_size; i++)
        {
         ExtTrade.Buy(lot_multiple * min_volume,brent,ask,0,0,"BUY");
        }
     }
  }
I've also included dedicated procedures for entering into short positions, I did this in case we realize specific rules that apply exclusively to either position side.
void check_sell()
  {
   if(PositionsTotal() == 0)
     {
      for(int i = 0; i < position_size; i++)
        {
         ExtTrade.Sell(lot_multiple * min_volume,brent,bid,0,0,"SELL");
        }
     }
  }
Now we define a function that will close all open positions we have. It loops through the open positions we have and only closes the positions opened under Brent. Note that if you want to be able to trade both Brent and WTI using this EA just remove the safety checks I put to ensure that the symbol is Brent. Remember I only chose Brent for demonstration purposes. You are free to customize the EA.
void CloseAll(void)
  {
   for(int i=PositionsTotal()-1; i>=0; i--)
     {
      if(PositionSelectByTicket(PositionGetTicket(i)))
        {
         if(PositionGetSymbol(i) == brent)
           {
            ulong ticket;
            ticket = PositionGetTicket(i);
            ExtTrade.PositionClose(ticket);
           }
        }
     }
  }
We will now define 2 methods for closing long and short positions respectively. Again as before, we accomplish this by iterating over all positions and getting the respective ticket for each position. Then we validate the the position type matches the type we are looking for. If all is successful, we will close the position.
void close_buy()
  {
   ulong ticket;
   int type;
   if(PositionsTotal() > 0)
     {
      for(int i = 0; i < PositionsTotal(); i++)
        {
         ticket = PositionGetTicket(i);
         type = (int)PositionGetInteger(POSITION_TYPE);
         if(type == POSITION_TYPE_BUY)
           {
            ExtTrade.PositionClose(ticket);
           }
        }
     }
  }

void close_sell()
  {
   ulong ticket;
   int type;
   if(PositionsTotal() > 0)
     {
      for(int i = 0; i < PositionsTotal(); i++)
        {
         ticket = PositionGetTicket(i);
         type = (int)PositionGetInteger(POSITION_TYPE);
         if(type == POSITION_TYPE_SELL)
           {
            ExtTrade.PositionClose(ticket);
           }
        }
     }
  }
We will now define how our model should be initialized:
- Ensure that both symbols are available and added to the market window.
- Copy the output data to matrix y (The close price of Brent, starting from candle 1).
- Copy the input data to matrix A (The close price of Brent, starting at 1 plus our forecast horizon).
- Reshape the data matrix A.
- Calculate the spread between Brent and WTI and add it to A.
- Add a row of 1's into A for the intercept.
- Transpose both A and y.
Once these steps have been completed we will check if our input data is valid, if not we will log an error message. If it is valid, we will move on to calculate the x coefficient matrix.
bool InitializeModel()
  {
//Try select the symbols
   if(SymbolSelect(brent,true) && SymbolSelect(wti,true))
     {
      Print("Symbols Available. Bars: ",max_bars," Fetch: ",fetch," Look ahead: ",look_ahead);
      //Get historical data on Brent , our model output
      y.CopyRates(brent,PERIOD_CURRENT,COPY_RATES_CLOSE,1,fetch);
      //model input
      A.CopyRates(brent,PERIOD_CURRENT,COPY_RATES_CLOSE,(1 + look_ahead),fetch);
      brent_price.CopyRates(brent,PERIOD_CURRENT,COPY_RATES_CLOSE,(1+look_ahead),fetch);
      wti_price.CopyRates(wti,PERIOD_CURRENT,COPY_RATES_CLOSE,(1+look_ahead),fetch);
      //Calculate the spread
      spread = brent_price - wti_price;
      Print("The Current Spread: ",spread);
      A.Reshape(3,fetch);
      //Add the spread to the input matrix
      A.Row(spread,1);
      //Add a column for the intercept
      A.Row(intercept,2);
      //Reshape the matrices
      A = A.Transpose();
      y = y.Transpose();
      //Inspect the matrices
      if((A.Cols() == 0 || y.Cols() == 0))
        {
         Print("Error occured when copying historical data");
         Print("A rows: ",A.Rows()," y rows: ",y.Rows()," A columns: ",A.Cols()," y cols: ",y.Cols());
         Print("A");
         Print(A);
         Print("y");
         Print(y);
         return(false);
        }

      else
        {
         Print("No errors occured when copying historical data");
         x = A.PInv().MatMul(y);
         Print("Finished Fitting The Model");
         Print(x);
         return(true);
        }
     }

   Print("Faield to select symbols");
   return(false);
  }
Lastly, we need to define a function to forecast future values of the Brent closing price.
double ModelForecast()
  {
   if(model_initialized)
     {
      //model input
      A.CopyRates(brent,PERIOD_CURRENT,COPY_RATES_CLOSE,0,1);
      brent_price.CopyRates(brent,PERIOD_CURRENT,COPY_RATES_CLOSE,0,1);
      wti_price.CopyRates(wti,PERIOD_CURRENT,COPY_RATES_CLOSE,0,1);
      //Calculate the spread
      spread = brent_price - wti_price;
      Print("The Spread: ",spread);
      A.Reshape(3,fetch);
      //Add the spread to the input matrix
      A.Row(spread,1);
      //Add a column for the intercept
      A.Row(intercept,2);
      //Reshape the matrices
      A = A.Transpose();
      double _forecast = (A[0][0]*x[0][0]) + (A[1][0]*x[1][0]) + (A[2][0]*x[2][0]);
      return(_forecast);
     }
   return(0);
  }
Putting it all together, this is what our application adds up to.
//+------------------------------------------------------------------+
//|                                                     Brent EA.mq5 |
//|                                  Copyright 2024, MetaQuotes Ltd. |
//|                                             https://www.mql5.com |
//+------------------------------------------------------------------+
#property copyright "Copyright 2024, MetaQuotes Ltd."
#property link      "https://www.mql5.com"
#property version   "1.00"

//Libraries
#include  <Trade\Trade.mqh>
CTrade ExtTrade;
#include <TrailingStop\ATRTrailingStop3.mqh>
ATRTrailingStop ExtATRTrailingStop;

//Inputs
input double atr_multiple = 5.0;
input double lot_multiple = 1.0;
input double profit_target = 10;
input double max_loss = 20;
input int position_size = 2;

//Set this value between 0 and 1 to control how much data is used
double consumption = 0.01;
//We want to know which symbol has the least number of bars.
double brent_bars = (double) NormalizeDouble((iBars("UK Brent Oil",PERIOD_CURRENT) * consumption),0);
double wti_bars = (double) NormalizeDouble((iBars("WTI_OIL",PERIOD_CURRENT) * consumption),0);
//Select the lowest
double max_bars = (brent_bars < wti_bars) ? brent_bars : wti_bars;
//How far into the future are we forecasting
double look_ahead = NormalizeDouble((max_bars / 4),0);
//How many bars should we fetch?
int fetch = (int)(max_bars - look_ahead) - 1;
//Matrix A stores our inputs. y is the output. x is the coefficients.
matrix A = matrix::Zeros(fetch,6);
matrix y = matrix::Zeros(fetch,1);
vector wti_price = vector::Zeros(fetch);
vector brent_price = vector::Zeros(fetch);
vector spread;
vector intercept = vector::Ones(fetch);
matrix x = matrix::Zeros(6,1);
double forecast = 0;
double ask = 0;
double bid = 0;
double min_volume = 0;

string brent = "UK Brent Oil";
string wti = "WTI_OIL";
bool model_initialized = false;
int OnInit()
  {
//Initialise trailing stops
   if(atr_multiple > 0)
      ExtATRTrailingStop.Init(atr_multiple);
   min_volume = SymbolInfoDouble(brent,SYMBOL_VOLUME_MIN);
   return(INIT_SUCCEEDED);
//---
  }
//+------------------------------------------------------------------+
//| Expert deinitialization function                                 |
//+------------------------------------------------------------------+
void OnDeinit(const int reason)
  {
//---

  }
//+------------------------------------------------------------------+
//| Expert tick function                                             |
//+------------------------------------------------------------------+
void OnTick()
  {
//---
   ask = SymbolInfoDouble(brent,SYMBOL_ASK);
   bid = SymbolInfoDouble(brent,SYMBOL_BID);
   if(model_initialized)
     {
      if(PositionsTotal() == 0)
        {
         forecast = 0;
         forecast = ModelForecast();
         InterpretForecast();
        }

      else
        {
         ManageTrades();
        }
     }

   else
     {
      model_initialized = InitializeModel();
     }

  }
//+------------------------------------------------------------------+

//+------------------------------------------------------------------+
//|This function closes trades if we reach our profit or loss limit  |                                                              |
//+------------------------------------------------------------------+
void ManageTrades()
  {
   if(AccountInfoDouble(ACCOUNT_PROFIT) > profit_target)
      CloseAll();
   if(AccountInfoDouble(ACCOUNT_PROFIT) < (-1 * max_loss))
      CloseAll();
  }

//+------------------------------------------------------------------+
//|This function judges if our model is giving a long or short signal|                                                                |
//+------------------------------------------------------------------+
void InterpretForecast()
  {
   if(forecast != 0)
     {
      if(forecast > iClose(_Symbol,PERIOD_CURRENT,0))
        {
         check_buy();
        }

      else
         if(forecast < iClose(_Symbol,PERIOD_CURRENT,0))
           {
            check_sell();
           }
     }
  }

//+------------------------------------------------------------------+
//|This function checks if we can open buy positions                  |
//+------------------------------------------------------------------+
void check_buy()
  {
   if(PositionsTotal() == 0)
     {
      for(int i = 0; i < position_size; i++)
        {
         ExtTrade.Buy(lot_multiple * min_volume,brent,ask,0,0,"BUY");
        }
     }
  }

//+------------------------------------------------------------------+
//|This function checks if we can open sell positions                |
//+------------------------------------------------------------------+
void check_sell()
  {
   if(PositionsTotal() == 0)
     {
      for(int i = 0; i < position_size; i++)
        {
         ExtTrade.Sell(lot_multiple * min_volume,brent,bid,0,0,"SELL");
        }
     }
  }

//+------------------------------------------------------------------+
//|This function will close all open trades                          |
//+------------------------------------------------------------------+
void CloseAll(void)
  {
   for(int i=PositionsTotal()-1; i>=0; i--)
     {
      if(PositionSelectByTicket(PositionGetTicket(i)))
        {
         if(PositionGetSymbol(i) == brent)
           {
            ulong ticket;
            ticket = PositionGetTicket(i);
            ExtTrade.PositionClose(ticket);
           }
        }
     }
  }

//+------------------------------------------------------------------+
//|This function closes any open buy trades                          |
//+------------------------------------------------------------------+
void close_buy()
  {
   ulong ticket;
   int type;
   if(PositionsTotal() > 0)
     {
      for(int i = 0; i < PositionsTotal(); i++)
        {
         ticket = PositionGetTicket(i);
         type = (int)PositionGetInteger(POSITION_TYPE);
         if(type == POSITION_TYPE_BUY)
           {
            ExtTrade.PositionClose(ticket);
           }
        }
     }
  }

//+------------------------------------------------------------------+
//|This function closes any open sell trades                         |
//+------------------------------------------------------------------+
void close_sell()
  {
   ulong ticket;
   int type;
   if(PositionsTotal() > 0)
     {
      for(int i = 0; i < PositionsTotal(); i++)
        {
         ticket = PositionGetTicket(i);
         type = (int)PositionGetInteger(POSITION_TYPE);
         if(type == POSITION_TYPE_SELL)
           {
            ExtTrade.PositionClose(ticket);
           }
        }
     }
  }


//+------------------------------------------------------------------+
//|This function initializes our model and fits it onto the data     |
//+------------------------------------------------------------------+
bool InitializeModel()
  {
//Try select the symbols
   if(SymbolSelect(brent,true) && SymbolSelect(wti,true))
     {
      Print("Symbols Available. Bars: ",max_bars," Fetch: ",fetch," Look ahead: ",look_ahead);
      //Get historical data on Brent , our model output
      y.CopyRates(brent,PERIOD_CURRENT,COPY_RATES_CLOSE,1,fetch);
      //model input
      A.CopyRates(brent,PERIOD_CURRENT,COPY_RATES_CLOSE,(1 + look_ahead),fetch);
      brent_price.CopyRates(brent,PERIOD_CURRENT,COPY_RATES_CLOSE,(1+look_ahead),fetch);
      wti_price.CopyRates(wti,PERIOD_CURRENT,COPY_RATES_CLOSE,(1+look_ahead),fetch);
      //Calculate the spread
      spread = brent_price - wti_price;
      Print("The Current Spread: ",spread);
      A.Reshape(3,fetch);
      //Add the spread to the input matrix
      A.Row(spread,1);
      //Add a column for the intercept
      A.Row(intercept,2);
      //Reshape the matrices
      A = A.Transpose();
      y = y.Transpose();
      //Inspect the matrices
      if((A.Cols() == 0 || y.Cols() == 0))
        {
         Print("Error occured when copying historical data");
         Print("A rows: ",A.Rows()," y rows: ",y.Rows()," A columns: ",A.Cols()," y cols: ",y.Cols());
         Print("A");
         Print(A);
         Print("y");
         Print(y);
         return(false);
        }

      else
        {
         Print("No errors occured when copying historical data");
         x = A.PInv().MatMul(y);
         Print("Finished Fitting The Model");
         Print(x);
         return(true);
        }
     }

   Print("Faield to select symbols");
   return(false);
  }

//+------------------------------------------------------------------+
//|This function makes a prediction once our model has been trained  |
//+------------------------------------------------------------------+
double ModelForecast()
  {
   if(model_initialized)
     {
      //model input
      A.CopyRates(brent,PERIOD_CURRENT,COPY_RATES_CLOSE,0,1);
      brent_price.CopyRates(brent,PERIOD_CURRENT,COPY_RATES_CLOSE,0,1);
      wti_price.CopyRates(wti,PERIOD_CURRENT,COPY_RATES_CLOSE,0,1);
      //Calculate the spread
      spread = brent_price - wti_price;
      Print("The Spread: ",spread);
      A.Reshape(3,fetch);
      //Add the spread to the input matrix
      A.Row(spread,1);
      //Add a column for the intercept
      A.Row(intercept,2);
      //Reshape the matrices
      A = A.Transpose();
      double _forecast = (A[0][0]*x[0][0]) + (A[1][0]*x[1][0]) + (A[2][0]*x[2][0]);
      return(_forecast);
     }
   return(0);
  }
//+------------------------------------------------------------------+
We are now ready to back test our trading algorithm using the built in MetaTrader 5 Strategy Tester.
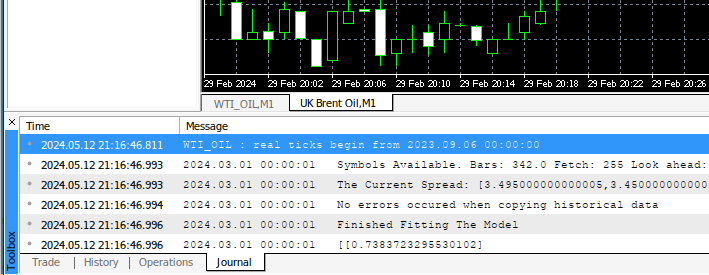
Fig 7: Back testing our quantitative trading algorithm.
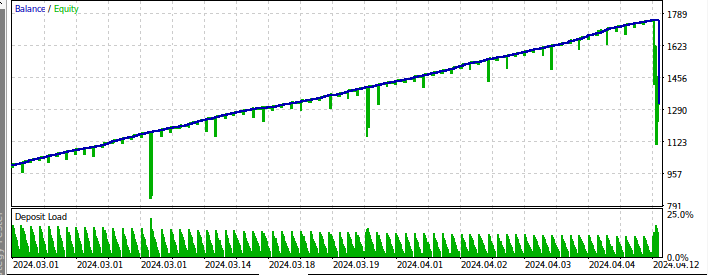
Fig 8: Historical returns from our back test.
Conclusion
There is room for improvement in the strategy we have considered today, for example 67% of all the known oil reserves in the world are located in the middle east but we didn't consider any of the Persian Gulf oil benchmarks. Furthermore there are other insightful spreads that may have predictive qualities that warrant further research, such as the crack spread. The crack spread measures the profitability of the refineries. Historically when crack spreads are high, supply tends to increase and when crack spreads are low, supply tends to fall. If you have read the article this far, then you should right away see the possible implications the crack spread may have on the price of crude oil.
Our strategy is profitable, but it is susceptible to irregular draw down periods.The oil markets are notoriously volatile, and further improvements will be made in strides by applying more robust risk management principles that are still profitable.
Wishing you peace, prosperity and profitable trades.
 News Trading Made Easy (Part 2): Risk Management
 Developing a multi-currency Expert Advisor (Part 2): Transition to virtual positions of trading strategies
 Neural networks made easy (Part 72): Trajectory prediction in noisy environments
 MQL5 Wizard Techniques you should know (Part 21): Testing with Economic Calendar Data
- Free trading apps
- Over 8,000 signals for copying
- Economic news for exploring financial markets
You agree to website policy and terms of use
Thank you again Gamuchirai , yet another very interesting ,clearly written and well thought article , I thought of using the MQL graph Module :) . Great stuff and very interesting thought process . To help other users My broker uses UKBENT and USWTI as symbols so I needed to modify the scripts to suit from (UK Brent Oil and WTI_OIL).
I am looking forward to testing and understanding this in detail
Hey Neil, it's always good to hear from you, man I'm glad I could be of help.
What are the chances that you were also thinking of using the graph module? It's like we're in sync.
I'm looking forward to your feedback and suggestions for improvements, if you have any cross your mind.
P.S. Side note: are you also watching AUD/JPY? I'm looking to go long and play on the yen's fundamental weakness.