
Forex spread trading using seasonality

Introduction
In the previous article, we considered the element of seasonality in the markets. Here we will have a look at the option of representing movements according to seasonal patterns in the form of symbol spread indicators. A trading method is considered, in which one symbol is bought and another is sold, thus, such an entry into the market is considered as a single (spread) position. Pair trading symbols should preferably have a correlation for greater trading efficiency.
1. Pair trading on Forex
I would like to immediately note that the advantage of this trading approach is the absence of explicit stop losses (perhaps for some traders fixing losses has a negative impact on their emotional state). Besides, it is possible to make profit regardless of the market direction, with minimal risk to the deposit. The solution lies in the use of so-called market-neutral strategies. The variant of this trading approach is called statistical arbitrage — pair trading available to all traders.
Here we will consider the search for statistical relationships and available tools, as well as discuss the potential of the pair trading approach compared to more conventional single currency trading.
Neutrality of a strategy in relation to the market means that the profitability of the strategy does not directly depend on the direction of the price movement of an individual symbol. This is achieved by creating a hedging position between two or more symbols, whose profits and losses mitigate each other.
One of the main characteristics of such a strategy is minimal risk, since it exploits low-level market dependencies. However, this trading approach does not imply risk-free profit.
In the context of statistical arbitrage, the main task is to create a market-neutral trading portfolio, which is an extended version of pair trading. To achieve the neutrality effect, the portfolio should consist of highly dependent symbols so that the upward movement of one symbol compensates the fall of another. In other words, we create a closed trading system, in which funds are redistributed between portfolio assets. Pair trading is a special case of statistical arbitrage and the most popular strategy of this type.
Pair trading means opening positions on two related symbols at the same time. The dependence is usually determined by their correlation ratio. The most popular way to assess the relationship between two time series involves calculating Pearson correlation. The stronger the correlation of instruments, the more likely they are to move in the same direction. There are both positive and negative correlations. In the former case, the instruments move in the same direction. For example, GBPUSD and EURUSD.
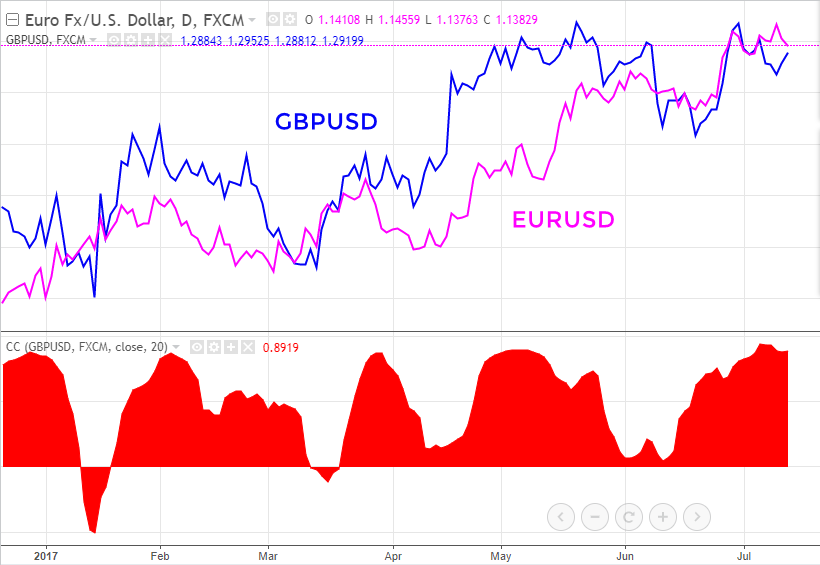
Fig. 1. Positive correlation between GBPUSD and EURUSD
In case of negative correlation, symbols move in opposite directions. For example, EURUSD and USDCHF. Both cases are examples of strong dependence. Notably, the reverse spread symbol is bought or sold in the same direction as the first spread symbol — EURUSD. Spread bought EURUSD in long position, while on USDCHF inverse spread symbol we enter a long position as well. Spread sold: we have a sell position on the first symbol of the spread EURUSD and we have a sell position on USDUCHF as well.
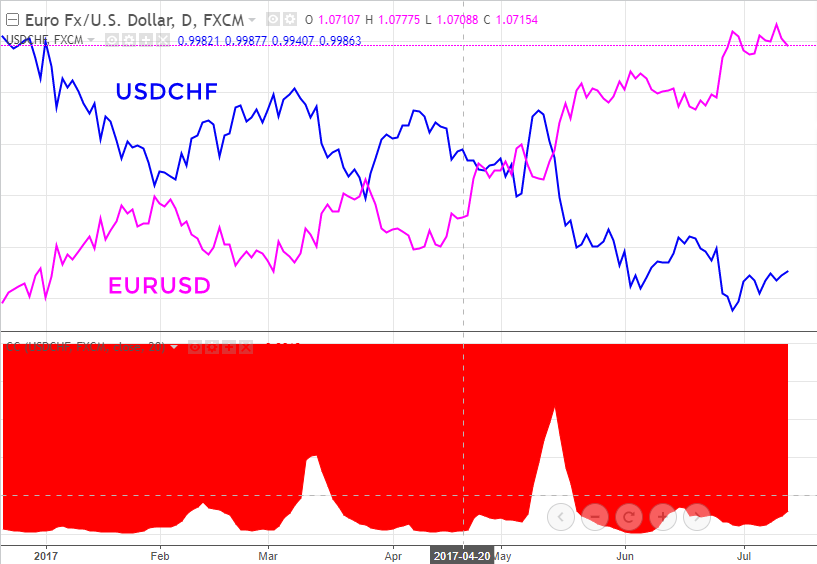
Fig. 2. Negative correlation between EURUSD and USDCHF
In pair trading, the spread of a pair of symbols is traded, that is, the difference between two trading instruments. If it is initially known that these symbols are moving in the same direction, then at the next divergence, they will most likely converge back.
The easiest way to illustrate the pair trading strategy is to use EURUSD and GBPUSD pairs. Thus, when the spread (difference) between two symbols widens to a certain threshold, the lagging instrument is purchased and the leading instrument is sold. When the instruments converge again, profit is fixed.

Fig. 3. The typical movement within the price range of the EURUSD and GBPUSD spread
The magnitude of the threshold divergence is determined by a statistical method — by analyzing past discrepancies. For example, this could be the average discrepancy over the year.
As a result, it does not matter at all to the trader, in which direction a particular trading symbol moves. It is important that the symbols being traded in the spread converge, namely that their spread returns to zero. At this point, a profit is recorded, sometimes equal to the size of the discrepancy.
For such a strategy to be profitable, there must be a relationship between the symbols. EURUSD and GBPUSD have a fairly strong positive correlation. However, this dependence is not constant, which is why the spread can diverge by a large amount and not converge back for some time.
In essence, trading the EURUSD and GBPUSD spread is similar to trading their EURGBP cross.
If the pair had a constant strong correlation, EURGBP would always be in a flat state. However, the dependence is periodically broken, which results in trends.
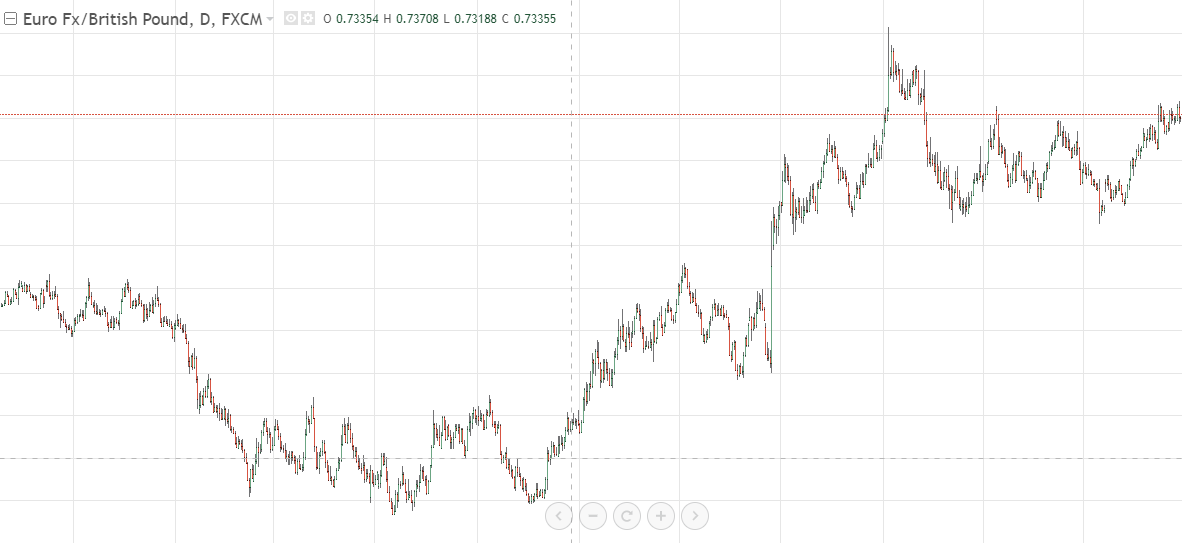
Fig. 4. Trending nature of the EURUSD - GBPUSD spread movement
One of the goals of spread trading is usually to eliminate the trend component in its movement for a more predictable version of its trading from the range boundaries. For this purpose, different volumes or, in the context of this article, weighting ratios of proportionality of spread symbols movement can be used to enter the market by spread symbols based on research.
2. Plotting a spread chart
Now let's move on to the practical part. It is time to construct a spread of two trading symbols.
We will use the custom indicators of the MetaTrader 5 trading platform to calculate the spread between two symbols. There are different ways to calculate the spread, each with slightly different end results. You are free to use whatever you see fit. As a rule, the spread of a pair of symbols is calculated by the difference. In other words, the spread equation for EURUSD and GBPUSD will look like EURUSD - GBPUSD.
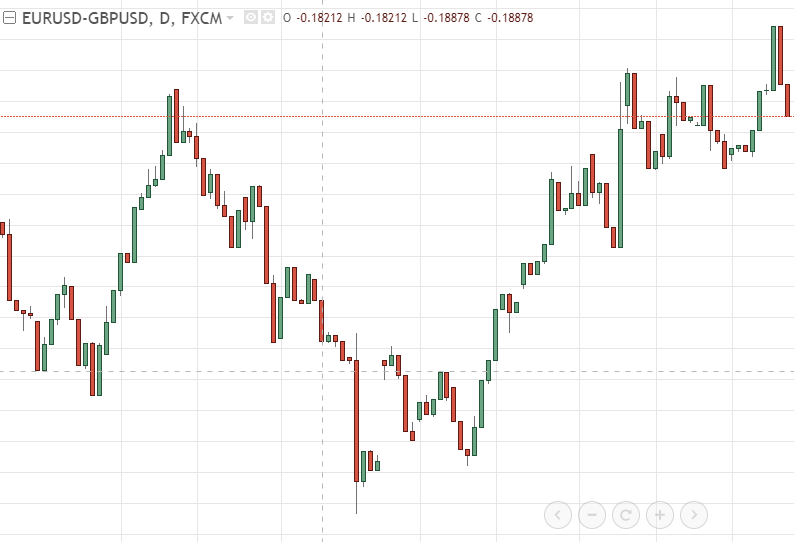
Fig. 5. EURUSD-GBPUSD spread chart
You can also build a spread based on, say, EURUSD/GBPUSD. It is worth considering that the final signals may differ depending on the chosen method of spread calculation, but they do not have any fundamental difference.
The interpretation of the conditions for entering a spread trading position is usually based on its expansion, that is, when the connection between the spread trading symbols is temporarily lost. Strong spread widening means expansion above average. Therefore, the difference between the spread chart and the moving average can be a good indicator of this movement.
Thus, we get a spread oscillator. The interpretation of trading conditions corresponds to the interpretation of trading by the oscillator when the spread is in the overbought or oversold zone (the spread has deviated from its average value).
If a spread purchase occurs — this means buying XAGUSD and selling XAUUSD. When selling a spread, sell XAGUSD and buy XAUUSD.

Fig.6. XAGUSD-XAUUSD spread chart on H1 (range nature of the spread movement)
To build such a chart of the EURUSD-GBPUSD spread with Bollinger Bands channels, we will use the capabilities of MetaQuotes Language 5 (MQL5) for the MetaTrader 5 trading platform, which provides excellent functionality for its implementation as well. In the presented indicator, the ratio values correspond to the ratios of the lots of the traded spread symbols.
The indicator is presented in the attachment below (spread_indicator_v.01).
The names and values of external variables are self-explanatory in MetaEditor:
#property indicator_separate_window
#property indicator_buffers 1
#property indicator_plots   1
//--- plot Current
#property indicator_label1  "Current"
#property indicator_type1   DRAW_LINE
#property indicator_color1  clrLightSlateGray
#property indicator_style1  STYLE_SOLID
#property indicator_width1  1

input string Symbol1_Name = "EURUSD";   //first spread symbol

input string Symbol2_Name = "GBPUSD";   //second spread symbol
input bool   Symbol2_Reverse = false;    //inverse correlation
input double Weighting_coefficients1 = 1;  // proportionality factor (position volume) of the first spread symbol
input double Weighting_coefficients2 = 1;  // proportionality factor (position volume) of the first spread symbol
This is a method of trading a spread from range boundaries. We should simply add the indicator to the spread chart. In this case, crossing the channel boundaries will also indicate a significant deviation of the spread from the average value, which is shown in the chart below:
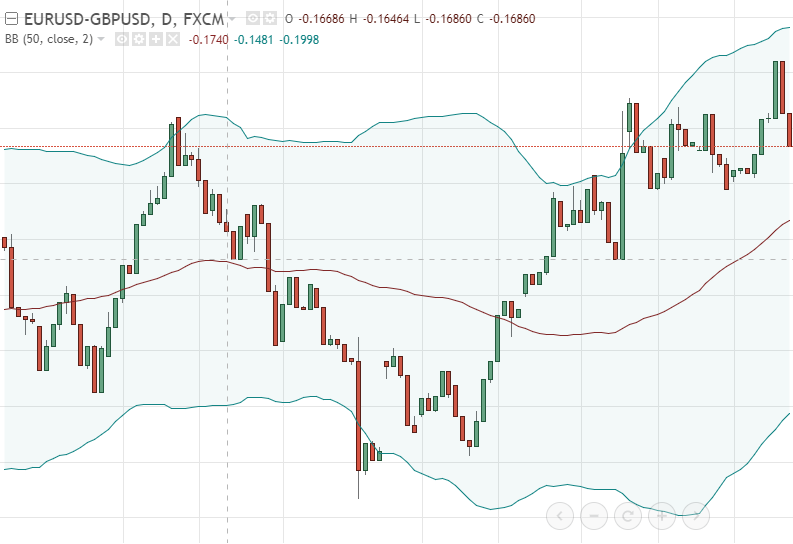
Fig. 7. EURUSD-GBPUSD spread chart with Bollinger Bands
To build such a chart, use Apply to First Indicator's Data in the MetaTrader 5 trading terminal after launching the indicator on the chart:


Fig. 8. Connecting Bollinger Bands to spread_indicator_v.01 spread indicator
3. Calculating the size of spread symbol positions
Another important aspect lies in the correct calculation of the size of positions opened on spread symbols. It would be logical to assume that two positions should be of equal volume, which means it is enough to open two positions with the same number of lots. But it is not that simple. If we calculate the difference between the traded symbols of the spread in points, then we assume that the points are equal for both instruments. In fact, to align positions we need to take into account the different point prices of the two symbols (spread instruments) relative to USD. We can find out the price of a point the following way: when calculating lots for EURUSD and USDJPY.
In the indicator attached below, the alignment of the symbols is done as follows:
kVol1=SymbolInfoDouble(Symbol1_Name,SYMBOL_TRADE_TICK_VALUE)/SymbolInfoDouble(Symbol1_Name,SYMBOL_TRADE_TICK_SIZE);
kVol2=SymbolInfoDouble(Symbol2_Name,SYMBOL_TRADE_TICK_VALUE)/SymbolInfoDouble(Symbol2_Name,SYMBOL_TRADE_TICK_SIZE);
4. Examples of seasonal analysis in spread trading
A well-known website that provides information on seasonal factors Moore Research Center, including spread trading, reports possible patterns of trading symbols movement at the current time.
Seasonal analysis of a symbol movement is no different from its interpretation in the case of a single movement of a financial instrument, namely as an example — this is a trading strategy that involves searching for and working on long-term patterns on the same time interval regardless if their cause. Thus, the principle of seasonal analysis remains the same. Using the seasonal symbol spread movement indicator, which is attached to this article, a time period is identified during which the symbol spread moves predictably over the same time in different years. This movement pattern can be compared with the proposed options from the MRCI website (see the link above) for seasonal trading patterns to be able to make appropriate trading decisions based on these trends.
There are different ways to identify the seasonal component, but a reliable approach involves calculating average trends. In other words, quotes are taken for several years, after which the symbol spread prices are added up and divided by a multiplier corresponding to the number of years(Fig. 9, 10. Charts of plotting symbol spreads by seasonality).
At the stage of seasonal analysis, it is also possible to evaluate the quality of the pattern, that is, to see how many times the movement pattern has been maintained over several years. Thin lines stand for price dynamics of the symbol spread for specific years, while the bold marker stands for the average trend, the value of which is determined by the arithmetic mean equation.
The seasonal trading strategy has its own specific interpretation of the conditions for possible entries/exits:
- if the average indicator increases, demand increases as well. Thus, in theory, only long positions should be considered here;
- if the average price falls (demand falls), we look for opportunities to sell in this area.
At first glance, it seems that there will be very few such trades, because seasonal analysis is applied exclusively on the daily timeframe (D1). Some potential entries are eliminated due to the infrequency of seasonal movements over the number of years (specific years) within the research period. But this drawback is compensated by diversification. In particular, perhaps the best way to see the seasonality of movement is in "agricultural" spreads (predictable influencing factors: the vegetative cycle of plants, weather, infrastructure load, the amount of harvested and stored crops in the off-season). This does not mean that spread trading on currency pairs or metals is not subject to seasonal analysis and does not have seasonal cycles, it is just that pronounced cycles are formed here less frequently compared to the agricultural markets.
The names and values of external variables look as follows:
input string Symbol1_Name = "EURUSD";   //first spread symbol

input string Symbol2_Name = "GBPUSD";   //second spread symbol
input bool   Symbol2_Reverse = false;    //inverse correlation

input double Weighting_coefficients1 = 1;  // proportionality factor (position volume) of the first spread symbol
input double Weighting_coefficients2 = 1;  // proportionality factor (position volume) of the first spread symbol
Graphically, the spread indicator looks like this in the MetaTrader 5 terminal (attached file seasons_spread_indicator_v.02.mq5):

Fig.9. Plotting symbol spread by seasonality: Seasonal features of EURUSD - GBPUSD movement
We can also compare the movement of the crosses through their majors by seasonality and trade the resulting patterns.
Below is a chart showing the seasonality of the silver-gold spread movement :

Fig. 10. Plotting symbol spread by seasonality: Seasonal features of Silver - Gold movement (intermarket spread)
The thin gray line at the very bottom of the chart shows the spread movement in the current year (the period of the previous year is shown) — for a more optimal visual comparison with the average spread movement for past periods, averaged over 2, 3, 5, 8, 10 and 15 years.
A well-known website on seasonality research presents the nature of seasonal price movements of one spread symbol on a general basis — silver.
https://www.mrci.com/web/index.php
Fig. 11. Seasonal patterns of futures contract movement - Silver
5. Providing data in the seasonal analysis of symbol spread movements
Movements in financial markets are not random at all. On the contrary, the prices of many assets depend on fundamental factors that appear almost every year.
Benefits of seasonal spread trading analysis:
- low risks when trading, when setting the position stop loss level;
- in essence, it is pretty simple, since you only need to evaluate the dynamics of several symbols in the spread and average the results over N th number of years on a daily scale;
- seasonal entry points are known in advance, meaning that a trader does not have to research the market every day;
- the probability of the pattern validity is also known long before opening a position, so there is time to assess your risks and opportunities.
Drawbacks of seasonal analysis:
- force majeure events disrupt long-standing patterns;
- a lot of time in the market according to a seasonal pattern that can last a month, a quarter or six months;
- the seasonal peak/trough is often reached before the end of the seasonal time boundary. This drawback is mitigated by setting the profit/loss size limit equal to its average statistical size. In addition, we can split the position size into parts and set the result as the symbol spread price moves in the direction of the forecast.
Conclusion
The most important part of the pair trading strategy is correct selection of spread symbols for trading. It is important to understand that the strategy itself is not a "grail", but with the correct selection of correlating instruments it can bring possible profit with minimal risk. A more expanded concept of statistical arbitrage (pair trading) is trading a portfolio of symbols. Its scenario is built on similar principles described in this article. Also, in addition to the price of a point converted to USD terms, it is possible to calculate spread lots by adding the volatility ratios of the symbols included in the spread.
Seasonal spread analysis has natural limitations. For example, even the most reliable pattern may fail to form due to the influence of random or force majeure factors.
Translated from Russian by MetaQuotes Ltd.
Original article: https://www.mql5.com/ru/articles/14035
- Free trading apps
- Over 8,000 signals for copying
- Economic news for exploring financial markets
You agree to website policy and terms of use
As soon as there are juicy deals either seasonal or short, I'll post them here....
That's great!
Thanks for the article.