
Learn how to design different Moving Average systems
Introduction
I think that whatever your experience period in the trading filed you must hear that quote “Trend is your friend”. And if you didn’t hear about it, here what is meaning as all know that we have different types of market directions or trends of price movement.
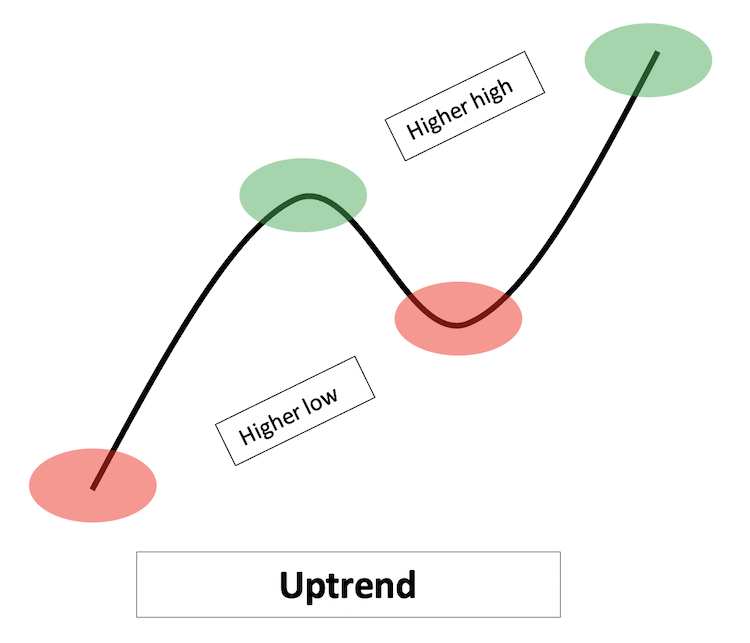
- Uptrend: we can see it when prices make higher lows and higher highs
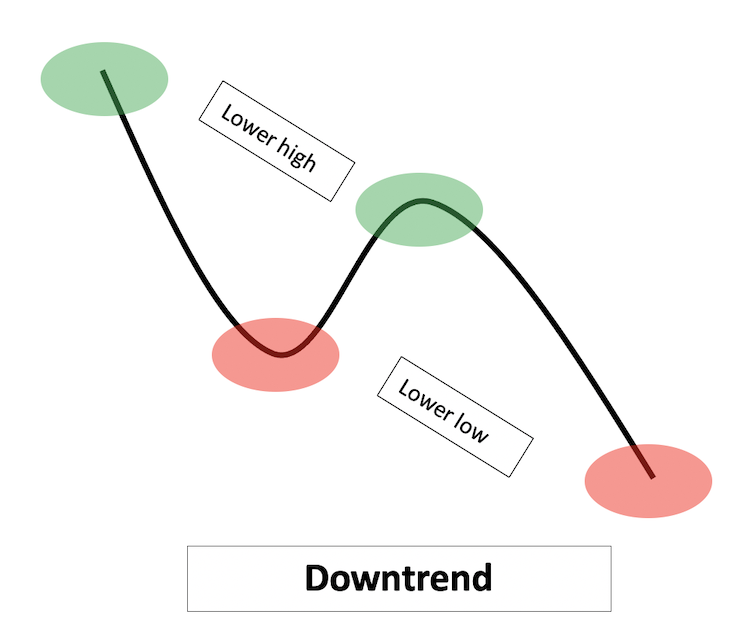
- Downtrend: we can see it when prices make the opposite of Uptrend, Lower highs and lower lows.
- Sideway: is every moving except uptrend or downtrend.
And the following figures can show uptrend and downtrend as a line chart and any movement except them is a sideway:
Now, we identified the trend but why the trend is my friend?
We will talk here about trends, i.e. uptrend and downtrend, as they have a clear movement either up or down. We can see the control of one particular market participant. During the uptrend, we can see that the buyer is the controller as he pushes the prices to up whatever the supply is and here, we call this market as a bull market. And vice versa, during the downtrend, we can see that the seller is the controller as he pushes the prices to down and here. We call this market as a bear market.
But in some cases, we may experience what we call whipsaws or false breakouts. And these false breakouts may harm our trading results, how is that? We will see here ho they can, but first let us identify what are whipsaws or false breakouts.
False breakouts are these signals that give us a trigger to take a decision then and after taking the decision the market goes against that decision. And for sure these kinds of decisions will harm our trading results. These false breakouts or whipsaws can be reduced by filtering them by many strategies. One of the best strategies that can do that for us is using a moving average and this is the subject of this article to learn how we can use some of moving average strategies and how to design an algorithmic trading system for them and make using of them accurate, easy, and systematic.
In this article, we will go through the following topics:
- Moving Average Definition
- Types of Moving Averages
- Strategy 1: One Moving Average Crossover
- Strategy2: Two Moving Averages Crossover
- Strategy3: Three Moving Averages Crossover
Disclaimer: All content of this article is made for the purpose of education only not for anything else. So, any action will be taken based on the content of this article, it will be your responsibility as the content of this article will not guarantee any kind of results. All strategies may need prior testing and optimizations to give better results as like what I mention the main objective from this article is an educational purpose only.
All codes will be written by MQL5 and will be tested on MT5.
Note that there are many strategies that can be used to filter generated signals based on any strategy, even by using the moving average itself which is the subject of this article. So, the objective of this article to share with you some of Moving Average Strategies and how to design an algorithmic trading system to let you know and open your eyes on what you can do and how could you develop your trading strategy. Now, let us go through this subject “Learn How to Design Different Moving Average Systems” as I am very excited to share it with you…
Moving Average Definition
Moving Average is an indicator that is commonly used in technical analysis and it is calculated to give us an average from prices during a specific period of time or in other words it helps us to smooth prices data to mitigate random or fluctuation of short-term movements on the chart.
There are many types of Moving Averages and the differences between them are related to different calculations for each, like what I will mention in details in the next topic. But here what I want you to know till further details is that there are many types and the difference between them because of the calculation to get the best result.
Moving Average is a trend following indicator as it is calculated by the prices. Therefore, if the price moves in a specific trend, the moving average will follow the same trend.
Moving Average is a lagging indicator as it moves after the price, and this is normal as it is calculated by the price so the price must move first. Or, in other words, we must have prices data first, and then we can find the moving average data by make calculations on these data of prices.
According to the nature of moving average, we can understand that the moving average:
- It gives the Mean.
- It works better with trending markets.
- It will confirm that there is a trend or it will help us to identify the trend.
- It will clear noise or random movement from the prices.
- It will help us to avoid whipsaws or false breakouts because of random movements as it will be eliminated.
- And much more…...
Types of Moving Averages
There are many types of Moving Averages that can be used and the most common used are:
- Simple Moving Average.
- Weighted Moving Average.
- Exponential Moving Average.
The main difference between them is connected with different calculations to get a better result the same as I mention before.
So, we will identify now these types of moving averages and will explore the differences between them. We will also see how these moving averages can be used in MQL5 or how we can call them if we want to use a specific kind of them.
Simple Moving Average:
This type is the simplest form or type of the moving average, its commonly used shortcut is SMA.
It is calculated by taking the arithmetic mean of a given set of values over a specific period of time. Or a set of numbers of prices are added together then divided by the number of prices in the set.

Example: We have 5 trading days and the closing prices during these 5 days was as the following:
- Day1 = 10
- Day2 = 15
- Day3 = 20
- Day4 = 30
- Day5 = 35
If we want to get SMA for these 5 Days, it will be calculated as the following:

Weighted Moving Average
The Weighted Moving Average (WMA) as it is commonly used, it gives an average for prices during a specific period of time but the difference here as it gives more weight for recent data. This means that if we calculate 10 trading days, this kind of average will not give the weight for all 10 trading days but it will give more weight to the recent data.
It can be calculated the same as the following formula:

Example:
If we have the same 5 trading days and the closing prices during these 5 days was as the following:
- Day1 = 10
- Day2 = 15
- Day3 = 20
- Day4 = 30
- Day5 = 35
If we want to get WMA for these 5 Days, it will be calculated as the following:


Exponential Moving Average
The Exponential Moving Average or EMA as it is commonly used. It gives an average for prices and the difference here is EMA does not cancel the period before the calculated period at MA, this means that if we need to calculate 10 MA, the period before those 10 trading days will be considered.
It can be calculated the same as the following:
First, we will calculate “K” to refer to exponent to calculate the weight of an interval, and “n” will refer to number of intervals:
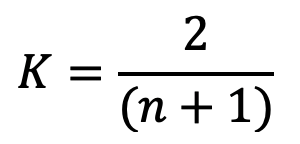
Then,

Example:
If we have the same 5 trading days and the closing prices during these 5 days was as the following:
- Day1 = 10
- Day2 = 15
- Day3 = 20
- Day4 = 30
- Day5 = 35
- Day6 = 40
If we want to get EMA for these 5 Days, it will be calculated as the following:


Note that here EMA of yesterday will be the first time to calculate EMA at Day6, so we will use SMA of 5 days (22).
Now, after identifying what is Moving Average and types of moving averages, we will go through the most interesting part at this article. We will talk about Moving Average strategies and how we can design algorithmic trading systems for them.
Strategy1: One Moving Average Crossover
In this article, we will choose Simple Moving Average. However, you can use any desired Moving Average type in your code.
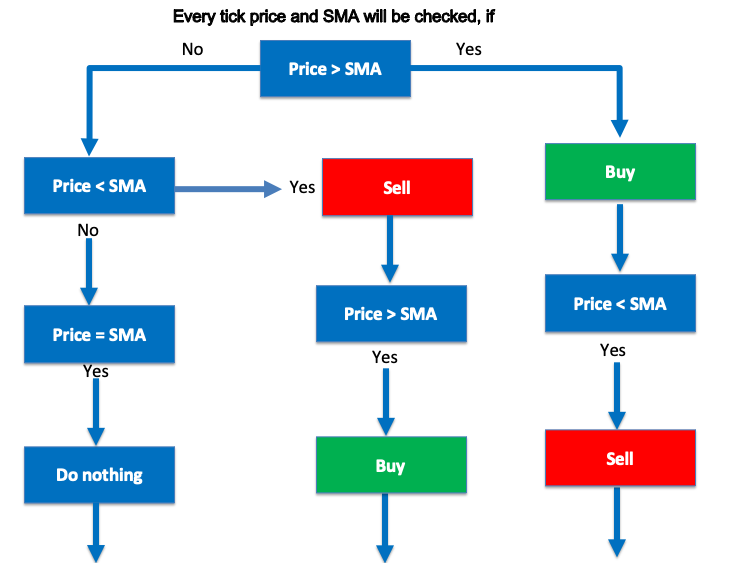
According to the strategy, prices and SMA will be checked at every tick:
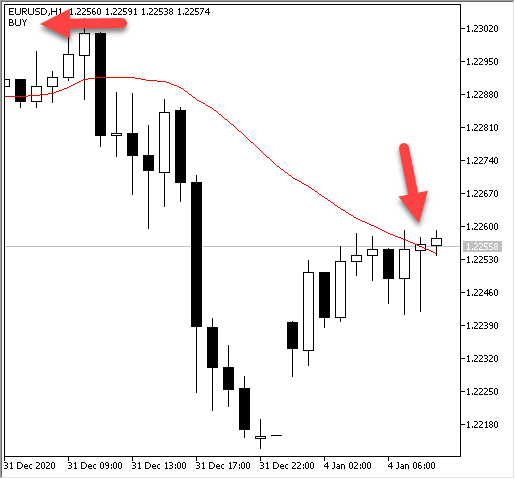
- Price > SMA: signal will be to buy, and we need this signal to be appear as a comment on the chart.
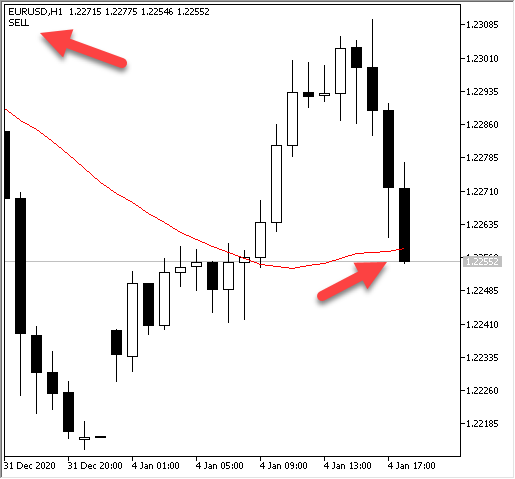
- Price < SMA: signal will be to sell, and we need this signal to be appear as a comment on the chart.
- If anything else, do nothing.
The following screenshot shows One Simple Moving Average Blueprint that we want to design:
The following is the code to design this strategy:
//+------------------------------------------------------------------+
//|                                            One SMA crossover.mq5 |
//|                                  Copyright 2022, MetaQuotes Ltd. |
//|                                             https://www.mql5.com |
//+------------------------------------------------------------------+
#property copyright "Copyright 2022, MetaQuotes Ltd."
#property link      "https://www.mql5.com"
#property version   "1.00"
//+------------------------------------------------------------------+
//| Expert tick function                                             |
//+------------------------------------------------------------------+
void OnTick()
  {
   //create an array for price
   double myMovingAverageArray1[];

   //define Ask, Bid
   double Ask = NormalizeDouble(SymbolInfoDouble(_Symbol,SYMBOL_ASK),_Digits);
   double Bid = NormalizeDouble(SymbolInfoDouble(_Symbol,SYMBOL_BID),_Digits);

   //define the properties of  MAs - simple MA 24
   int movingAverage1 = iMA(_Symbol, _Period, 24, 0, MODE_SMA, PRICE_CLOSE);

   //sort the price arrays current candle
   ArraySetAsSeries(myMovingAverageArray1,true);

   //Defined MA - one line - currentcandle, 3 candles - store result
   CopyBuffer(movingAverage1,0,0,3,myMovingAverageArray1);

   //Check if we have a buy entry signal
   if (
      (Ask>myMovingAverageArray1[0])
      )
         {
         Comment("BUY");
         }

   //check if we have a sell entry signal
   if (
      (Bid<myMovingAverageArray1[0])
      )
         {
         Comment("SELL");
         }
  }
//+------------------------------------------------------------------+
The following screenshots show the generated signals after executing the code:
Strategy2: Two Moving Averages Crossover
In this strategy, we will use two simple moving averages. The shorter simple moving average period is 24 and the longer one period is 50.
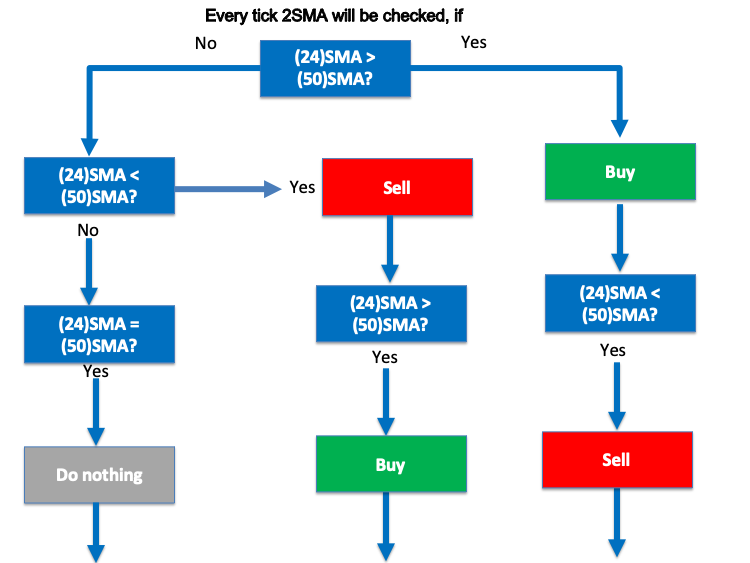
According to this strategy, we need the two simple moving averages to be checked at every tick:
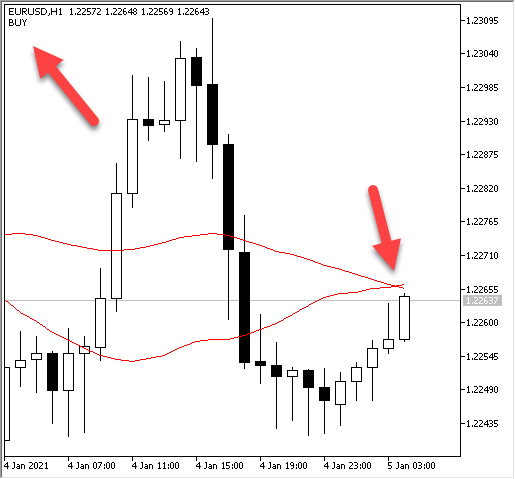
- If 24 SMA > 50 SMA: signal will be to buy, and we need this signal to be appeared as a comment on the chart.
- If 24 SMA < 50 SMA: signal will be to sell, and we need this signal to be appeared as a comment on the chart.
- If anything, else do nothing.
The following screenshot shows the Two Simple Moving Averages Blueprint that we want to design:
The following is the code to design this strategy:
//+------------------------------------------------------------------+
//|                                            Two SMA crossover.mq5 |
//|                                  Copyright 2022, MetaQuotes Ltd. |
//|                                             https://www.mql5.com |
//+------------------------------------------------------------------+
#property copyright "Copyright 2022, MetaQuotes Ltd."
#property link      "https://www.mql5.com"
#property version   "1.00"
//+------------------------------------------------------------------+
//| Expert tick function                                             |
//+------------------------------------------------------------------+
void OnTick()
  {
   //create an array for several prices
   double myMovingAverageArray1[], myMovingAverageArray2[];

   //define the properties of  MAs - simple MA, 1st 24 / 2nd 50
   int movingAverage1 = iMA(_Symbol, _Period, 24, 0, MODE_SMA, PRICE_CLOSE);
   int movingAverage2 = iMA(_Symbol,_Period,50,0,MODE_SMA,PRICE_CLOSE);

   //sort the price arrays 1, 2 from current candle
   ArraySetAsSeries(myMovingAverageArray1,true);
   ArraySetAsSeries(myMovingAverageArray2,true);

   //Defined MA1, MA2 - one line - currentcandle, 3 candles - store result
   CopyBuffer(movingAverage1,0,0,3,myMovingAverageArray1);
   CopyBuffer(movingAverage2,0,0,3,myMovingAverageArray2);

   //Check if we have a buy entry signal
   if (
      (myMovingAverageArray1[0]>myMovingAverageArray2[0])
   && (myMovingAverageArray1[1]<myMovingAverageArray2[1])
      )
         {
         Comment("BUY");
         }

   //check if we have a sell entry signal
   if (
      (myMovingAverageArray1[0]<myMovingAverageArray2[0])
   && (myMovingAverageArray1[1]>myMovingAverageArray2[1])
      )
         {
         Comment("SELL");
         }
  }
//+------------------------------------------------------------------+
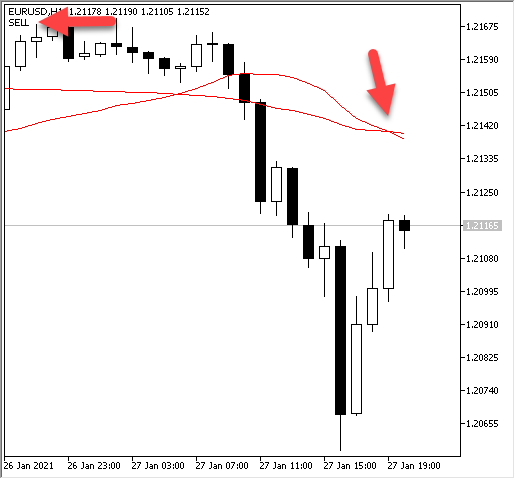
The following screenshots demonstrates the generated signals after executing the code:
Strategy3: Three Moving Averages Crossover
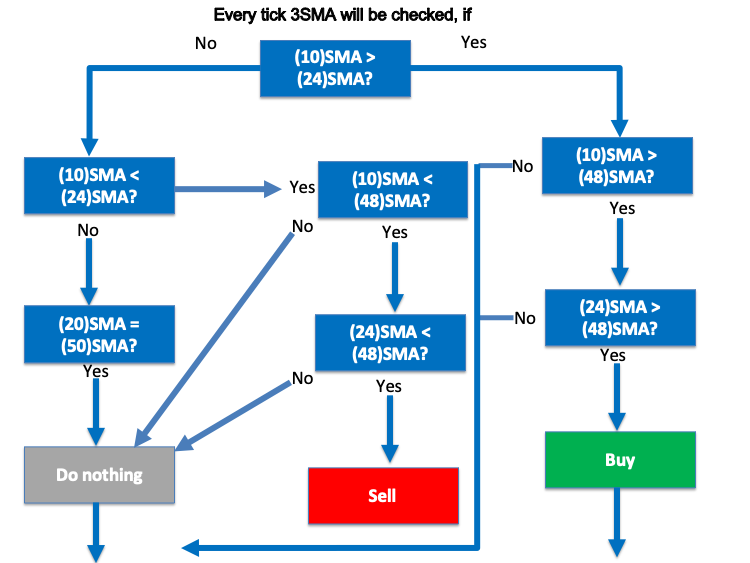
In this strategy, we will use three simple moving averages: the shorter simple moving average period is 10, the longer one period is 48, and in between a period of 24.
According to the strategy, we need the three simple moving averages to be checked at every tick:
- If 10 SMA > 24 SMA, 10 SMA > 48 SMA, and 24 SMA > 48 SMA: the signal will be to buy and we need to be appeared as a comment on the chart.
- If 10 SMA < 24 SMA, 10 SMA < 48 SMA, and 24 SMA < 48 SMA: the signal will be to sell and we need to be appeared as a comment on the chart.
- If anything, else do nothing.
The following screenshot demonstrates the Three Simple Moving Averages Blueprint that we want to design:
The following is the code to design this strategy:
//+------------------------------------------------------------------+
//|                                          Three SMA crossover.mq5 |
//|                                  Copyright 2022, MetaQuotes Ltd. |
//|                                             https://www.mql5.com |
//+------------------------------------------------------------------+
#property copyright "Copyright 2022, MetaQuotes Ltd."
#property link      "https://www.mql5.com"
#property version   "1.00"
//+------------------------------------------------------------------+
//| Expert tick function                                             |
//+------------------------------------------------------------------+
void OnTick()
  {
   //create an array for several prices
   double myMovingAverageArray1[], myMovingAverageArray2[],myMovingAverageArray3[];

   //define the properties of  MAs - simple MA, 1st 10 / 2nd 24, 3rd 48
   int movingAverage1 = iMA(_Symbol, _Period, 10, 0, MODE_SMA, PRICE_CLOSE);
   int movingAverage2 = iMA(_Symbol,_Period,24,0,MODE_SMA,PRICE_CLOSE);
   int movingAverage3 = iMA(_Symbol,_Period,48,0,MODE_SMA,PRICE_CLOSE);

   //sort the price arrays 1, 2, 3 from current candle
   ArraySetAsSeries(myMovingAverageArray1,true);
   ArraySetAsSeries(myMovingAverageArray2,true);
   ArraySetAsSeries(myMovingAverageArray3,true);

   //Defined MA1, MA2, MA3 - one line - currentcandle, 3 candles - store result
   CopyBuffer(movingAverage1,0,0,3,myMovingAverageArray1);
   CopyBuffer(movingAverage2,0,0,3,myMovingAverageArray2);
   CopyBuffer(movingAverage3,0,0,3,myMovingAverageArray3);

   //Check if we have a buy entry signal
   if (
      (myMovingAverageArray1[0]>myMovingAverageArray2[0])
   && (myMovingAverageArray1[1]<myMovingAverageArray2[1])
   && (myMovingAverageArray1[0]>myMovingAverageArray3[0])
   && (myMovingAverageArray1[1]<myMovingAverageArray3[1])
   && (myMovingAverageArray2[0]>myMovingAverageArray3[0])
   && (myMovingAverageArray2[1]<myMovingAverageArray3[1])
      )
         {
         Comment("BUY");
         }

   //check if we have a sell entry signal
   if (
      (myMovingAverageArray1[0]<myMovingAverageArray2[0])
   && (myMovingAverageArray1[1]>myMovingAverageArray2[1])
   && (myMovingAverageArray1[0]<myMovingAverageArray3[0])
   && (myMovingAverageArray1[1]>myMovingAverageArray3[1])
   && (myMovingAverageArray2[0]<myMovingAverageArray3[0])
   && (myMovingAverageArray2[1]>myMovingAverageArray3[1])
      )
         {
         Comment("SELL");
         }
  }
//+------------------------------------------------------------------+
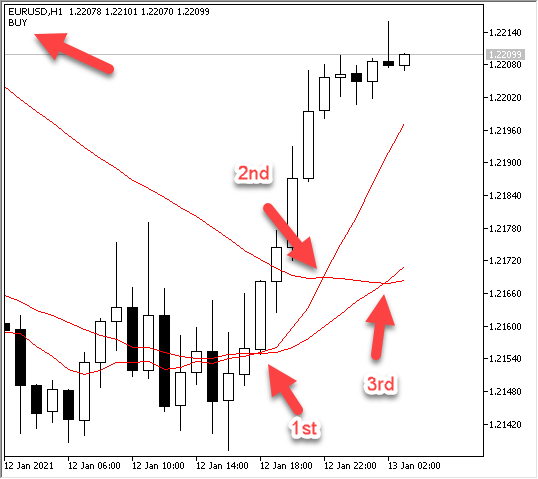
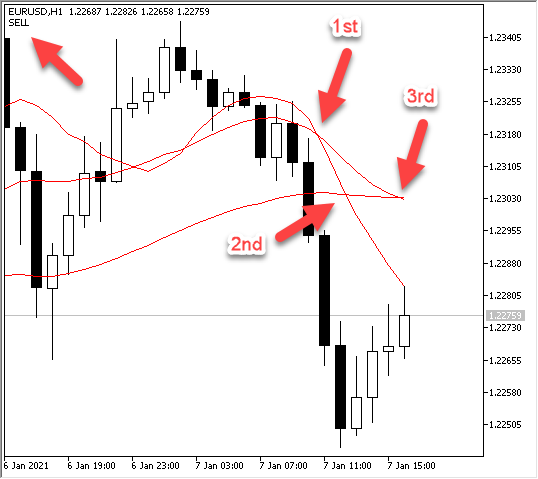
Conclusion
In this article, I mentioned one of the most commonly used and important indicators by sharing three different strategies. I also tried to show how we can use these indicators and how we can design algorithmic trading systems based n each one of them. These strategies can be used accurately and effectively, of course after prior testing and optimizations.Warning: All rights to these materials are reserved by MetaQuotes Ltd. Copying or reprinting of these materials in whole or in part is prohibited.
This article was written by a user of the site and reflects their personal views. MetaQuotes Ltd is not responsible for the accuracy of the information presented, nor for any consequences resulting from the use of the solutions, strategies or recommendations described.
 Combinatorics and probability for trading (Part IV): Bernoulli Logic
 Combinatorics and probability for trading (Part V): Curve analysis
- Free trading apps
- Over 8,000 signals for copying
- Economic news for exploring financial markets
You agree to website policy and terms of use
The Strategy Tester will be useful. By parameterizing uncertain behavior the Strategy tester can reveal unexpected findings that help improve on a strategy.