Nuevos indicadores técnicos para MetaTrader 5 - 2
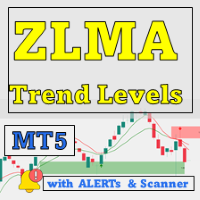
¡Solo quedan 5 copias por $49 – asegura la tuya antes de que el precio suba a $149! El indicador Zero Lag MA Trend Levels MT5 con escáner combina la media móvil de cero retraso (ZLMA) con una media móvil exponencial estándar (EMA), brindando a los traders una visión completa del impulso del mercado y los niveles clave de precios. Además, las funciones de escáner y alertas permiten a los traders rastrear fácilmente señales en múltiples pares y marcos de tiempo, mejorando la capacidad de detectar

Este indicador te permite transformar la apariencia de tu gráfico aplicando una transición suave entre dos colores personalizables para el fondo. Este efecto de degradado llamativo le da a tu gráfico un aspecto fresco y moderno, haciéndolo más atractivo visualmente. El degradado se aplica a todas las ventanas de indicadores que actualmente están en tu gráfico cuando se adjunta el indicador y también afectará a cualquier nueva ventana de indicador que se agregue más tarde. ¡Pruébalo y refresca la
FREE

El Predictor Híbrido Boltzmann-Hopfield es un indicador avanzado de MetaTrader que combina predicción por redes neuronales con análisis de volatilidad para pronosticar movimientos de precios. Muestra flechas verdes para movimientos alcistas previstos y flechas rojas para movimientos bajistas. El indicador solo genera señales cuando se cumplen condiciones específicas de volatilidad, utilizando ATR, volatilidad histórica y reconocimiento de patrones para filtrar predicciones. Características princ

Sperman Scalping Dot será útil para los traders, ya que ayuda a identificar posibles reversiones de precios en el gráfico utilizando una combinación de indicadores de sobrecompra y sobreventa (Overbought y Oversold), así como divergencias entre los precios de cierre y los extremos de precios. El objetivo principal de este indicador es visualizar los momentos en los que es probable una reversión de tendencia, brindando al trader la oportunidad de entrar o salir de una operación a tiempo. Cómo usa
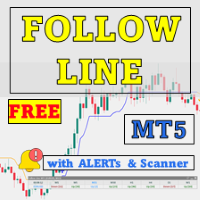
Maximiza tu ventaja comercial con Follow Line MT5 con escáner, un indicador avanzado basado en la volatilidad diseñado para traders serios. Esta herramienta combina el poder de las Bandas de Bollinger con configuraciones personalizables, ofreciendo información precisa sobre los movimientos del precio. See more MT4 version at: Follow Line MT4 with Scanner See more products at: https://www.mql5.com/en/users/ndhsfy/seller La clave de Follow Line es su capacidad para detectar cuando el precio se
FREE
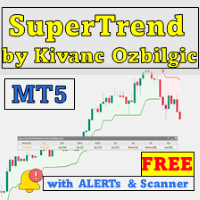
Presentamos SuperTrend ATR Multiplier with Scanner for MT5 – una herramienta versátil y poderosa diseñada para ayudarte a estar siempre un paso adelante de las tendencias del mercado, con funciones personalizables y alertas en tiempo real. Siguiendo la lógica confiable de SuperTrend de Kivanc Ozbilgic , este indicador proporciona señales de tendencia precisas. Puedes ajustar el método de cálculo del ATR entre RMA (media móvil relativa) y SMA (media móvil simple) para obtener la máxima flexibilid
FREE
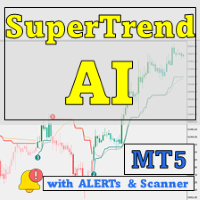
¡Solo 4 copias disponibles por $49 – Asegura la tuya antes de que el precio suba a $149! Descubre el poder de la IA con el SuperTrend AI Clustering MT5 con escáner , una herramienta revolucionaria para MetaTrader 5 (MT5). Este indicador redefine el análisis del mercado combinando el agrupamiento K-means con el popular indicador SuperTrend, brindando a los traders una ventaja para navegar tendencias y señales. See more MT4 version at: SuperTrend AI Clustering MT4 with Scanner See more products

Presentando el Indicador Sniper de Tendencias Definitivo para MetaTrader 5 (MT5) Alcanza entradas precisas y maximiza tus ganancias con nuestro indicador de última generación Lleva tu trading al siguiente nivel con el Indicador Sniper de Tendencias , una herramienta avanzada diseñada para traders que buscan tanto precisión como profundidad en su análisis. Este poderoso indicador utiliza algoritmos matemáticos únicos para identificar las tendencias más fuertes del mercado, ofreciéndote puntos de

El Escáner de Tablero CCI de MT5 El Escáner de Tablero CCI de MT5 es una herramienta que ayuda a rastrear los niveles del Índice de Canal de Materias Primas (CCI) a través de diferentes marcos de tiempo e instrumentos, mientras proporciona alertas en tiempo real cuando se detecta una nueva señal. Es fácil de usar y ligero en potencia computacional, lo que garantiza un rendimiento fluido en cualquier computadora. Características Principales Agrupación Automática de Instrumentos : El escáner recop
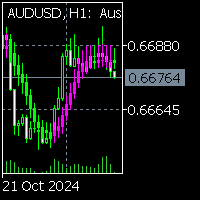
Presentamos el indicador de regresión lineal de velas para MQL5, una potente herramienta diseñada para funcionar sin problemas en todos los instrumentos y marcos temporales.
Este indicador avanzado utiliza la regresión lineal para proporcionar una visualización precisa de la tendencia directamente en su gráfico de velas, ayudando a los operadores a identificar la dirección del precio y los posibles retrocesos con precisión.
Tanto si opera en divisas como en acciones o materias primas, est

Description : In the world of trading, candlestick patterns are a popular technical analysis tool used by many traders. There are numerous candlestick patterns, ranging from reversal patterns to continuation patterns. However, remembering all these patterns can be challenging, especially for novice traders. This often leads to traders having to manually memorize and identify candlestick patterns, which can be time-consuming and prone to errors. Candle Pattern Pro is a powerful indicator desig
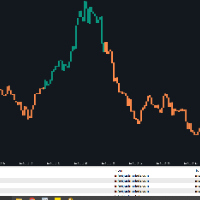
!!! DISCLAIMER THIS INDICATOR SHOULD ACT AS A CONFIRMATION TO UR ANALYSIS DONT USE THIS INDICATOR ALONE !!!!! please leave a feed back on how u found the indicator to use on future projects Elevate your trading experience , a custom indicator designed for MetaTrader 5. This powerful tool employs advanced technical analysis to provide clear, visual signals directly on your chart. i use it to scalp the xauusd market on the 1min timeFrame in newyork session stoploss below the candle and take profi
FREE

This SMT (Smart Money Technique) divergence indicator identifies discrepancies in price movement between two different trading symbols, helping traders detect potential market reversals. This tool compares the price action of two correlated assets, such as two currency pairs or indices, to spot divergences where one asset's price moves in the opposite direction of the other. For example, while one symbol may be making higher highs, the other might be making lower highs, signaling a divergence. T
FREE

Line function - shows on the chart the lines of Opening, Stop Loss, Take Profit. With this function, it is easy to create a new order and see its additional characteristics before opening. TP and SL - sets the relationship of Take Profit to Stop Loss. This allows you to set the size of the profit relative to the loss in pips.
the opening line will appear when all conditions are met TP1, TP2, TP3, TP4 and SL are manually specified in pips. buying or selling is done at the closing price of th
FREE
A Renko Tick chart based on continuously adjusting percentage.
Live Renko bricks formed by tick data
Adjustable brick width expert for indicator attached Scalp with a Renko, get weird.
The settings can and will break the script if you turn them up too high. Turning off outline mode will not look as nice, but can potentially allow for a larger number of bricks.
FREE

This indicator combines weekly session visualization with Volume Weighted Moving Average (VWMA) analysis . It draws vertical lines at session start and horizontal lines spanning each weekly starting session , providing clear visual c ues for trading sessions. The V WMA is calculated an d displayed as a color -changing line, offering insights into price trends weighte d by volume. Users can customize session times , line colors , VWMA perio d, price
FREE

Antabod Genius Indicator—an advanced trading tool designed to give you accurate buy and sell signals directly on your MetaTrader 5 platform. Harnessing the combined power of Moving Averages (MA) and the Stochastic Oscillator, this indicator helps you identify optimal entry and exit points with ease. Key Features: • Precision with Dual Moving Averages: The Genius Indicator uses a fast and slow MA to detect key market momentum shifts. Crossovers between the MAs serve as reliable indicators for pot

Antabod Multiplier , the ultimate trading indicator designed to simplify your decision-making process and maximize your trading potential. Built with a robust combination of moving averages and stochastic oscillators, this tool provides clear, actionable signals for both buy and sell opportunities. The Antabod Multiplier stands out with its dynamic trend detection and precision filtering, giving you real-time visual signals to catch trend reversals and optimal entry/exit points with ease. Whethe
This indicator helps you monitor multiple currency pairs and timeframes all at once. It displays the occurrence of divergences between price and the MACD indicator in a clear and easy-to-read table. Monitoring multiple timeframes and currency pairs in one place helps traders identify a divergence without needing to switch between charts. Divergences can be bullish or bearish. For example, if the price forms a higher high while the MACD forms a lower high, this indicates bearish divergence. On th

This indicator combines session visualization with Volume Weighted Moving Average (VWMA) analysis . It draws vertical lines at session start and horizontal lines spanning each session , providing clear visual c ues for trading sessions. The V WMA is calculated an d displayed as a color -changing line, offering insights into price trends weighte d by volume. Users can customize session times , line colors , VWMA perio d, price type , and volume
FREE

During volatile market conditions brokers tend to increase spread. int OnCalculate ( const int rates_total, const int prev_calculated, const datetime &time[], const double &open[], const double &high[], const double &low[], const double &close[], const long &tick_volume[], const long &volume[], const int &spread[]) { int spread_array[];
FREE

The indicator is a very simple oscillator based on T3
Green and red bars shows bullish or bearish direction
Also above and below the zero line can show sentiment
The T3 value and price can be adjusted according to your trading style
The colors can also be changed as preferred
Please test in tester before purchase
Enjoy!!! ---------------------------------
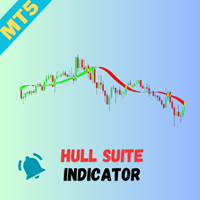
Overview
The Hull Suite is a highly responsive and smooth moving average indicator based on the Hull Moving Average (HMA), developed by Alan Hull in 2005. Known for its minimal lag and clear curves, the HMA has become a widely used technical analysis tool. This script brings together multiple Hull variations into one flexible and customizable indicator, ideal for traders looking for enhanced visual representation and trend analysis. Key Features
The Hull Suite offers three variations of the

Special Fair Value Gap (SFVG) Indicator
Unlock your trading potential with the Special Fair Value Gap (SFVG) Indicator! This innovative tool identifies critical price imbalances in the market, helping you pinpoint potential buying and selling opportunities with precision.
Key Features: - Multi Timeframe - Smart Money Tool - Identifies Key Price Levels: Automatically detects STRONG HIGH PROBABILITY gaps in price action where retracements are likely to occur, allowing you to make informed t
MT5 Drawdown Tracker – Track Your EA’s Performance with Precision! Take your trading analysis to the next level with our MT5 indicator designed to monitor, record, and report the drawdown of any Expert Advisor. Whether you’re fine-tuning your strategies or optimizing risk management, this tool gives you the insights you need. Key Features: Effortless Tracking: Automatically monitors the drawdown levels of your EAs with precision. Comprehensive Data Storage: Accurately logs each drawdown event,

The "Profit and Fee" indicator was developed in MQL5 to help traders clearly visualize the fees involved in operations on the stock exchange (B3). It calculates and displays, in real time, the fees for emoluments and registration, allowing traders to understand the impact of these fees on their profit or loss.
Advantages and Features:
1. Financial Transparency: The indicator shows exactly how much you are paying in fees, providing a clear view of the real value of your operations. This help

The first 100 units are gone for FREE! Now, grab the next 50 units at just $30 each. Act fast, because once they're gone, the price will jump to $99. Don’t wait
The *Rich Scalping* indicator is a powerful tool designed for traders who seek to maximize profits through fast-paced, short-term trading. Specifically tailored for scalping, it accurately identifies entry and exit points by detecting quick price movements and market trends.
With user-friendly signals and real-time alerts, Ric

The Simple Market Sessions Indicator helps traders visualize the current status of major forex market sessions: Asian , London , New York , and Sydney . It shows whether each market is Open , Active (based on volume) , or Closed directly on the chart. With customizable session times and a volume threshold, this tool helps traders monitor session activity and volume strength, making it easier to decide the best times to trade.
Key features: Displays status: Open, Active (High Volume), or Clos

Superior Boom and Crash Spike Alert: Real-Time Market Intelligence at Your Fingertips
Unlock the power of timely trading decisions with our Superior Spike Alert, a cutting-edge trading tool designed to notify you of potential market spikes. This innovative system sends instant alerts to your phone, audible notifications on your laptop, and displays clear arrows on charts for each currency pair, ensuring you stay ahead of the market.
Key Features:
1. Mobile Notifications: Receive instant

Presentamos Quantum TrendPulse , la herramienta de trading definitiva que combina el poder de SuperTrend , RSI y Stochastic en un indicador integral para maximizar su potencial de trading. Diseñado para traders que buscan precisión y eficiencia, este indicador le ayuda a identificar tendencias del mercado, cambios de impulso y puntos de entrada y salida óptimos con confianza. Características principales: Integración con SuperTrend: siga fácilmente la tendencia predominante del

¡Solo quedan 3 copias a $49! – ¡Asegura la tuya antes de que el precio suba a $149! El éxito en los mercados financieros depende de tu capacidad para identificar zonas clave y aprovechar las oportunidades de trading. Precision SMC Zone Finder es una herramienta avanzada que te ayuda a detectar con precisión Order Blocks (OBs), Fair Value Gaps (FVGs) y niveles de precios críticos , brindándote la ventaja de mantenerte por delante del mercado y lograr excelentes resultados. Características clave

¿Tienes una idea comercial o información privilegiada, pero pierdes constantemente el punto de entrada? EasyEntry – el indicador de señal del punto de entrada óptimo ayudará a abrir Correctamente. Señales de alta precisión al comienzo del movimiento. El indicador fue creado por la inteligencia artificial única ForexAI. El principio de apertura de posiciones se basa en un algoritmo adaptativo único para reconocer patrones de velas. Analiza simultáneamente los datos de 7 pares de divisas principal
FREE
¡Solo 5 copias disponibles por $49 – Asegura la tuya antes de que el precio suba a $149! Presentamos el revolucionario RSI Kernel Optimized with Scanner para MT5, una herramienta de vanguardia que redefine el análisis tradicional de RSI al integrar el poderoso algoritmo de Estimación de Densidad de Núcleo (KDE). Este avanzado indicador no solo proporciona información en tiempo real sobre las tendencias del mercado, sino que también incluye un panel de control para escanear múltiples pares de di

El Indicador de zona FVG MT5 es una poderosa herramienta diseñada para identificar brechas de valor justo (FVG) en el mercado, destacando los desequilibrios de precios entre el valor justo y el precio de mercado. Esta identificación precisa de brechas permite a los operadores detectar posibles puntos de entrada y salida del mercado, mejorando significativamente su capacidad para tomar decisiones comerciales informadas. Con su interfaz intuitiva y fácil de usar, el indicador de zona F

Indicador de Rango de Precios Diario El Indicador de Rango de Precios Diario es una poderosa herramienta diseñada para mostrar los niveles clave de precios de cada día de negociación, ayudando a los traders a tomar decisiones informadas basadas en la dinámica del mercado. Este indicador dibuja automáticamente rectángulos en el gráfico, destacando visualmente tres puntos de precio importantes: Precio de Apertura Diario : Marcado con un color distintivo para identificar fácilmente el punto de aper

Indicador de Entrada Sniper para MT5 Desbloquea el potencial del análisis de múltiples marcos temporales con nuestro innovador Indicador de Entrada Sniper para MetaTrader 5 (MT5). Esta poderosa herramienta está diseñada para ayudar a los traders a identificar puntos de entrada óptimos basados en las tendencias predominantes de marcos temporales más altos, asegurando así una estrategia de trading bien fundamentada. Características Clave: Análisis de Múltiples Marcos Temporales:
Analiza sin esfu
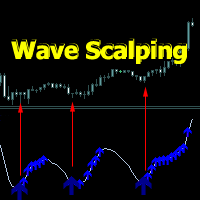
El indicador Wave Scalping es una estrategia comercial a corto plazo basada en el sistema de ondas. Incluye una línea de onda, puntos de entrada y seguimiento de posición.
Las flechas de señal aparecen cuando se cierra la vela.
Consiste en una línea de onda a lo largo de la cual se construyen las flechas de señal y una flecha que confirma las direcciones después de las flechas de señal.
Las flechas de señal se construyen teniendo en cuenta la dirección de la tendencia. Al confirmar las fle
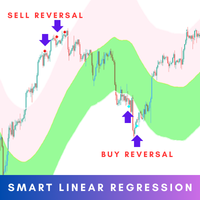
The Smart Linear Regression indicator is a powerful, non-repainting tool designed for traders looking for enhanced accuracy in market analysis. Unlike the typical linear regression channels that often repaint, this indicator provides reliable insights without changing past values, making it more trustworthy for forecasting future price movements. MT4 Version - https://www.mql5.com/en/market/product/124893/ Overview: The Smart Linear Regression Indicator goes beyond the basic linear regr

Adecuado para el indicador de tendencia EurTrendSniper. Por favor, descárguelo y colóquelo en la carpeta Indicators de MT5.
Un elemento clave en el trading es identificar las áreas o niveles donde se toman decisiones para comprar o vender instrumentos financieros. Aunque los principales participantes intentan ocultar su presencia en el mercado, inevitablemente dejan huellas. Nuestra tarea es aprender a identificar estas huellas e interpretarlas correctamente.
Señal alcista:
El precio (vela
FREE

YOU CAN NOW DOWNLOAD FREE VERSIONS OF OUR PAID INDICATORS . IT'S OUR WAY OF GIVING BACK TO THE COMMUNITY ! >>> GO HERE TO DOWNLOAD
This system is an Heiken Ashi system based on RSI calculations . The system is a free open source script originally published on TradingView by JayRogers . We have taken the liberty of converting the pine script to Mq4 indicator . We have also added a new feature which enables to filter signals and reduces noise on the arrow signals.
Background
HEIKEN ASHI
FREE

Advanced Dynamic RSI – The Evolution of the Classic RSI Advanced Dynamic RSI is based on the work of technical analyst J. Welles Wilder and has been further developed. This improved indicator combines Wilder's proven RSI calculation with modern features and a dynamic smoothing method, which delivers more precise and flexibly adjustable signals, allowing traders to analyze market volatility and price movements with greater accuracy.
Features and Key Characteristics Dynamic Levels: The Advanced
FREE
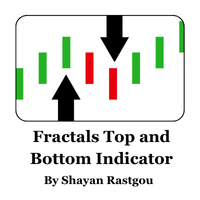
Discover the power of fractals to uncover significant market reversals! This custom Fractals Indicator for MetaTrader 5 is designed to help traders quickly and effectively spot potential swing highs and lows, providing visual cues that make trading decisions easier. Key Features: Clear Buy & Sell Signals: Green and red arrows highlight bullish and bearish fractals, helping you effortlessly identify significant price pivots. Customizable Analysis Depth: Choose the number of bars to evaluate for f
FREE

The Accumulation/Distribution (AD) Technical Indicator is a tool used in technical analysis to determine whether an asset is being accumulated (bought) or distributed (sold) in the market. Key Characteristics of the AD Indicator: Purpose: The AD indicator is used to assess the balance between buying (accumulation) and selling (distribution) of an asset. This helps traders and investors evaluate the strength of the current trend and potential reversals. Interpretation: Rising Indicator: Whe

The Accelerator Oscillator (AC) technical indicator measures the acceleration or deceleration of the current market strength. It is designed to identify potential trend reversal points and is used to determine the moment of buying or selling assets. The indicator helps traders make decisions based on changes in market dynamics. This implementation of the indicator is its creative version. Since the standard version is very limited by its built-in settings, this implementation has significantly

The AO (Accumulation/Distribution) technical indicator is a successful indicator for measuring market dynamics, which reflects specific changes in the market's driving force, which helps determine the strength of a trend, including its formation and reversal points. The AO indicator is a technical analysis tool that will help you trade more effectively. Main characteristics of the AO indicator: Purpose: The AO indicator is used to assess the balance between purchases (accumulation) and sales (di

Detector de Patrones Martillo MT5: Tu guía hacia operaciones más rentables ¿Cansado de buscar las mejores oportunidades de trading? Nuestro innovador indicador te ofrece una ventaja competitiva al identificar automáticamente los patrones de martillo en tus gráficos. Conocido por su alta probabilidad de éxito, el patrón de martillo ha sido durante décadas una herramienta fundamental en el arsenal de los traders experimentados. Nuestro indicador, diseñado para detectar con precisión este patrón cl
FREE

Detector de Patrones Envolventes MT5: Tu ventaja competitiva en el trading ¿Buscas una herramienta que te ayude a identificar con precisión las mejores oportunidades de trading en el mercado de divisas? Nuestro Detector de Patrones Envolventes te proporciona una señal de compra o venta altamente confiable, basada en uno de los patrones de velas japonesas más reconocidos y efectivos: el patrón envolvente. Con un porcentaje de acierto promedio del 70%, este indicador te permitirá tomar decisiones
FREE
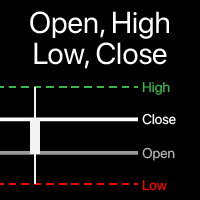
Visualization of Open, High, Low, Close levels on the chart You can choose any timeframe , not just the current one. The offset of the calculated bar can be adjusted : the current (floating) bar , or a set number of bars back . My #1 Utility : includes 65+ functions | Contact me if you have any questions | MT4 version In the settings of the indicator, you can configure: Offset of the calculated bar: 0 = current bar, 1 = previous bar, 2 = 2 bars back... "Include multiple bars " opti

Trading Session Indicator for MT5 This Session Indicator for MT5 visually highlights key trading sessions directly on your chart with customized colors, making it easier to track market movements during different time zones. The indicator automatically detects and displays the Asian, European, and US trading sessions, offering clear visual separation for each session using user-defined color schemes. Key Features: Automatically plots the major trading sessions (Asian, European, and US) on the ch
FREE

This non-repainting indicator, inspired by Larry Williams’ renowned "VIX Fix", replicates the power of the VIX (Volatility Index) but works across all asset classes—making it a versatile tool for traders. Originally designed for stock indices, this version adapts to any market, including forex, commodities, and crypto, providing valuable insights into potential market bottoms.
For more details, check out this pdf: https://www.ireallytrade.com/newsletters/VIXFix.pdf
Key Features: Based on the

Tyr Bands Indicator (IC MARKETS GOLD). Just drag and drop. This indicators gets you entry points for the market. it is for gold, but you can configure for any other currency. Tyr Band works with BB and 3 different deviations, plus the Stochastic confirmation. So when the price closes below/above the BB Reversal Band (Red) and the Stochcastic is in the confirmation zone, then the arrow (buy/sell) appears. This arrow indicates that we can entry to the market up/down on the next opening. Since it i
FREE
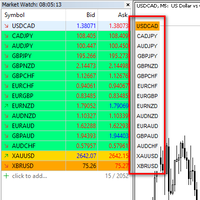
I want to quickly view the chart, so I created a small tool. I hope it can help you. Functions:
Use up/down arrow keys or mouse clicks to quickly open charts for currency pairs. Use left/right arrow keys to change the timeframe of the current chart. Automatically update the order based on the Market Watch
If you have any request or errors please tell me to help it better.
FREE

Overview The Time Trading Indicator AWT is designed for traders who often miss or overlook their trading opportunities. This tool helps users stay on top of their trading windows by providing timely alerts. Key Features User-friendly interface: Simple and intuitive design for easy navigation. Easy to use: Set it up quickly and start receiving notifications instantly. Alert and Push Notifications: Stay informed with real-time alerts and push notifications. Customizable Objects: Adjust the i
FREE

This is a very simple multiple moving average indicator.
It can display 12 moving averages. The time axis of the moving averages can be changed in the input field of the indicator. The process is faster than the 12 moving averages included with MT5.
We also have a buffer set up so you can access it from an Expert Advisor. *For advanced users.
If you have any questions or requests, please message me.
Thank you.
MT4 Version: https://www.mql5.com/en/market/product/122857
FREE
This indicator is the mql version of the SSLHybrid indicator. Description of TradingView version: This script is designed for the NNFX Method, so it is recommended for Daily charts only.
Tried to implement a few VP NNFX Rules
This script has a SSL / Baseline (you can choose between the SSL or MA), a secondary SSL for continiuation trades and a third SSL for exit trades.
Alerts added for Baseline entries, SSL2 continuations, Exits.
Baseline has a Keltner Channel setting for "in zone"
To get access to MT4 version please click here . This is the exact conversion from TradingView: "VolATR" by "barrettdenning" This is a light-load processing. This is a non-repaint indicator. All input options are available. Buffers are available for processing in EAs. You can message in private chat for further changes you need. Here is the source code of a sample EA operating based on signals from indicator: #include <Trade\Trade.mqh> CTrade trade; int handle_volatr= 0 ; input group "EA Setti

Vice Daily Opening Indicator for MQL5 Overview:
Introducing the Vice Daily Opening Indicator for MQL5, a powerful tool designed for traders who want to enhance their daily trading strategies. This intuitive indicator provides clear visual cues on your trading chart by marking the opening price of each day with a prominent horizontal line. Key Features: Daily Opening Price Line: Automatically draws a horizontal line at the opening price of each day, giving traders a clear reference point for th

Automatic Fibonacci Levels Indicator The Automatic Fibonacci Levels Indicator is an essential tool for traders seeking to incorporate Fibonacci retracement and extension levels into their technical analysis seamlessly. This innovative indicator automatically identifies significant price movements and calculates key Fibonacci levels, providing traders with valuable insights into potential support and resistance areas. Key features: Automatic Calculation : Effortlessly plots Fibonacci levels base

Automatic Trendline Indicator The Automatic Trendline Indicator is a powerful tool designed to simplify technical analysis by automatically identifying and drawing trendlines on a price chart. It analyzes price movements to detect key support and resistance levels, plotting ascending and descending trendlines based on historical price action. This indicator helps traders identify market trends, potential breakout points, and reversal areas with minimal effort. Key features: Automatic Detection

About indicator > The indicator is a function based on one value (open/high prices up to now) and then it is a mathematical representation of the whole function that is totally independent from any else values. So, if you ask yourself will the future be as it is on the graph... I can tell you - as it was the same as the trading function up to the moment "now"... In conclusion, the point of the indicator is to try to show the future of the trading function into eternity.
The graphic is sometim

Tout d'abord, il convient de souligner ici que cet indicateur de trading est un indicateur non repeint , non redessiné et non retardé, ce qui le rend idéal pour le trading manuel et robotisé.
Viking Strategy Signal Indicator - est un indicateur de tendance qui analyse automatiquement le marché et fournit des informations sur la tendance et chacun de ses changements, ainsi que des signaux pour entrer dans des transactions sans redessiner ! . Points d'entrée exacts dans les transactio

Introducing Order Blocks Breaker , a brand-new way to identify and leverage order blocks in your trading strategy. After developing multiple order block tools with unique concepts, I’m proud to present this tool that takes things to the next level. Unlike previous tools, Order Blocks Breaker not only identifies order blocks but also highlights Breaker Order Blocks —key areas where the price is likely to retest after a breakout. MT4 - https://www.mql5.com/en/market/product/124101/ This t

El Soporte Resistencia Whisperer MT5 es una poderosa herramienta diseñada para ayudar a los traders a identificar niveles cruciales de soporte y resistencia en el mercado. Este indicador utiliza la acción del precio para dibujar dinámicamente líneas de resistencia rojas y líneas de soporte verdes en su gráfico, ofreciendo una representación clara y visual de las zonas de precios clave donde pueden ocurrir posibles reversiones o rupturas del mercado. A diferencia de los métodos tradic

The Area of Interest (AOI) Indicator is a powerful tool designed to help traders identify key market zones where price reactions are highly probable. This indicator specifically highlights two critical zones: Seller AOI (Area of Interest) : This zone represents areas where sellers are likely to enter the market, often acting as resistance. When the price approaches or touches this zone, it signals that a potential sell-off could occur. Buyer A OI (Area of Interest) : The BOI zone identifie
FREE

An indicator based on time-tested trading methods that gives a signal that the market is overbought or oversold in a certain period of time
The indicator does not disappear when it appears, easy to use
Suitable for any trade
It can be used on any currency pair or crypto
He performed best in the period H1,H4,daily
After the purchase, you will also receive a seller's template with settings
The seller uses it more for trading on cryptocurrency
After the purchase, I also keep in touch

For support, visit cc.inni.cc where you will also find our Knowledge library and FAQ. PATHFINDER TREND is a complex, yet easy to manage trend indicator. It has various features that can aid in your decision making and boost your performance accuracy. Patfhinder Trend is a visually comfortable and user friendly tool that you should keep on your trading desk.
Key features Signal Detection & Trend Analysis Visually clear and decisive Early indication of signal direction with arrows Confirmed s

El Indicador Neuro Trend utiliza tecnología moderna para proporcionar señales tempranas de cambios de tendencia en los mercados. A través de una codificación de colores precisa, el indicador muestra la dirección actual de la tendencia: el verde señala precios al alza (tendencia alcista), mientras que el rojo indica precios a la baja (tendencia bajista). Cuanto más se aleja el indicador del punto cero, más fuerte es la tendencia. Los valores por encima de cero indican una fuerte tendencia alcista

Detailed Description: The Pivot Points Indicator is designed for traders who rely on pivot points, midpoints and support/resistance levels for their trading strategies. By automatically calculating and plotting these levels (based on the previous period's high, low, and close prices) , the indicator provides a clear, visual representation of critical price areas where the market may reverse or break out.The tool is particularly useful for day traders and swing traders looking to base the
FREE
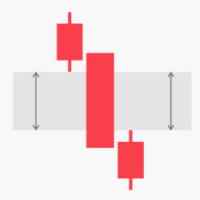
The Fair Value Gap (FVG) indicator is designed to help traders identify price imbalances in the market. It automatically identifies and visualizes areas where the price deviates significantly from its fair value, which can indicate potential trading opportunities. Automatic FVG detection: The indicator automatically finds and marks areas on the chart where price leaves “gaps” between candles, indicating possible market imbalances.
FREE
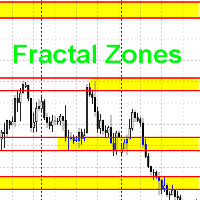
Данный индикатор рисует торговые зоны по фракталам со старших периодов, что упрощает торговлю по уровням.
На одном графике данный индикатор рисует два типа торговых зон. Например если текущий период - H1, то торговые зоны будут искаться по фракталам с H4 и с D1. В стандартных настройках фрактальные зоны с H4 будут рисоваться желтым цветом, а с D1 - зеленым. При наложении зон, происходит смешивание цветов в месте пересечения зон. Как данную вещь поправить, я не знаю в данный момент.
Принцип п
FREE
¿Sabe usted por qué MetaTrader Market es el mejor lugar para vender estrategias comerciales e indicadores técnicos? Con nosotros, el desarrollador no tiene que perder tiempo y fuerzas en publicidad, protección del programa y ajustes de cuentas con los compradores. Todo eso ya está hecho.
Está perdiendo oportunidades comerciales:
- Aplicaciones de trading gratuitas
- 8 000+ señales para copiar
- Noticias económicas para analizar los mercados financieros
Registro
Entrada
Si no tiene cuenta de usuario, regístrese
Para iniciar sesión y usar el sitio web MQL5.com es necesario permitir el uso de Сookies.
Por favor, active este ajuste en su navegador, de lo contrario, no podrá iniciar sesión.