
Grafiken in der Bibliothek DoEasy (Teil 98): Verschieben von Angelpunkten erweiterter grafischer Standardobjekte

Inhalt
Konzept
Im Artikel 93 begann ich mit der Entwicklung von zusammengesetzten grafischen Objekten in der Bibliothek. Dann wurde ich von der Notwendigkeit abgelenkt, die Funktionsweisen von Formularobjekten auf der Basis der CCanvas-Klasse zu verbessern. Wir verwenden die Formularobjekte in den zusammengesetzten grafischen Objekten zur Erstellung der Steuerung von Angelpunkten (pivot points) eines grafischen Objekts, das in ein erweitertes grafisches Standardobjekt eingebunden ist. Daher benötigen wir die neue Formularobjektfunktionalität.
Im letzten Artikel habe ich die Verbesserung von Objekten auf Basis der CCanvas-Klasse abgeschlossen. Heute werde ich die Entwicklung von erweiterten grafischen Standardobjekten fortsetzen, aus denen die zusammengesetzten grafischen Objekte bestehen.
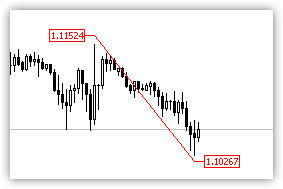
Das Ziel des Artikels ist nicht die Entwicklung neuer Klassen. Vielmehr geht es um die Verbesserung der bereits vorbereiteten Funktionsweisen zur Erstellung von komfortablen Werkzeugen zum Verschieben von Angelpunkten von grafischen Standardobjekten. Der Artikel wird die Entwicklung eines Prototyps für ein zusammengesetztes grafisches Objekt beschreiben. Wir haben ihn bereits in den vorherigen Artikeln erstellt. Es handelt sich dabei um eine gewöhnliche Trendlinie mit zusätzlichen Preisschildobjekten an ihren Enden:
Heute werde ich mich mit dem Thema der beweglichen Angelpunkte der Trendlinie zusammen mit den Preiskennzeichnungen beschäftigen, die an der verschobenen Seite der Trendlinie angebracht sind. Die Angelpunkte der Linie enthalten Formularobjekte für die Verschiebung. Wenn Sie das Objekt anfassen und verschieben, wird auch die entsprechende Seite der Trendlinie verschoben. Solange der Cursor vom Angelpunkt der Trendlinie entfernt ist, bleibt das Formularobjekt unsichtbar. Nähert sich der Cursor jedoch dem Angelpunkt in einer bestimmten Entfernung (beim Eintritt in den Bereich eines vollständig transparenten Formulars), erscheinen Punkte mit Kreisen auf dem Formular:

So sieht das Trendlinien-Angelpunkt-Steuerelement im Chart aus. Das Formular ist größer als sein aktiver Bereich. Der aktive Bereich eines Formulars ist der Bereich, der zum Verschieben des Formulars gezogen werden kann. Im Gegensatz dazu kann der Bereich des Formulars selbst verwendet werden, um andere Arten der Interaktion mit dem Formular mithilfe von Maustasten und Mausrad zu ermöglichen.
Befindet sich der Mauszeiger innerhalb des Formulars, aber außerhalb des aktiven Bereichs, können wir zum Beispiel die Aktivierung des Kontextmenüs eines zusammengesetzten grafischen Objekts durch Drücken der rechten Maustaste realisieren. Befindet sich der Mauszeiger im aktiven Bereich, so können wir zusätzlich zum Kontextmenü dieses Formular mit der Maus anfassen und verschieben. In diesem Fall bewegt sich auch das Ende der Zeile, an die das Formular angehängt ist.
Natürlich handelt es sich hierbei nur um ein zusammengesetztes grafisches Testobjekt, mit dem die neuen Funktionen ausprobiert werden kann. Nachdem alle notwendigen Werkzeuge für die Erstellung von zusammengesetzten grafischen Objekten und für die Verarbeitung von Formularobjekten erstellt wurden, werde ich eine kleine Gruppe von zusammengesetzten grafischen Objekten aus der Standardbibliothek erstellen, die für die Entwicklung benutzerdefinierter Objekte verwendet werden können. Die Erstellung dieser Objekte dient als Beispiel und Beschreibung, wie Sie Ihre eigenen Objekte dieser Art erstellen können.
Im Moment entwickle ich nur die Funktionsweise der Bibliothek und erstelle die notwendigen "Bausteine", um daraus eigene Objekte zu erstellen. Die in meinen Artikeln beschriebenen, analysierten und implementierten Schritte werden als Grundlage dienen, um "so wie sie sind" verwendet zu werden, ohne dass alles von Grund auf neu implementiert werden muss.
Verbesserung der Klassenbibliothek
Wir öffnen \MQL5\Include\DoEasy\Defines.mqh und implementieren einige Änderungen.
Die Formen der Angelpunkt-Steuerung sollen einen Punkt und einen Kreis enthalten. Die verwendete Farbe wurde bereits im Code festgelegt. Fügen wir die Makro-Substitution mit der Standardfarbe hinzu:
//--- Pending request type IDs
#define PENDING_REQUEST_ID_TYPE_ERR    (1)                        // Type of a pending request created based on the server return code
#define PENDING_REQUEST_ID_TYPE_REQ    (2)                        // Type of a pending request created by request
//--- Timeseries parameters
#define SERIES_DEFAULT_BARS_COUNT      (1000)                     // Required default amount of timeseries data
#define PAUSE_FOR_SYNC_ATTEMPTS        (16)                       // Amount of pause milliseconds between synchronization attempts
#define ATTEMPTS_FOR_SYNC              (5)                        // Number of attempts to receive synchronization with the server
//--- Tick series parameters
#define TICKSERIES_DEFAULT_DAYS_COUNT  (1)                        // Required number of days for tick data in default series
#define TICKSERIES_MAX_DATA_TOTAL      (200000)                   // Maximum number of stored tick data of a single symbol
//--- Parameters of the DOM snapshot series
#define MBOOKSERIES_DEFAULT_DAYS_COUNT (1)                        // The default required number of days for DOM snapshots in the series
#define MBOOKSERIES_MAX_DATA_TOTAL     (200000)                   // Maximum number of stored DOM snapshots of a single symbol
//--- Canvas parameters
#define PAUSE_FOR_CANV_UPDATE          (16)                       // Canvas update frequency
#define CLR_CANV_NULL                  (0x00FFFFFF)               // Zero for the canvas with the alpha channel
#define OUTER_AREA_SIZE                (16)                       // Size of one side of the outer area around the form workspace
//--- Graphical object parameters
#define PROGRAM_OBJ_MAX_ID             (10000)                    // Maximum value of an ID of a graphical object belonging to a program
#define CTRL_POINT_RADIUS              (5)                        // Radius of the control point on the form for managing graphical object pivot points
#define CTRL_POINT_COLOR               (clrDodgerBlue)            // Radius of the control point on the form for managing graphical object pivot points
#define CTRL_FORM_SIZE                 (40)                       // Size of the control point form for managing graphical object pivot points
//+------------------------------------------------------------------+
//| Enumerations                                                     |
//+------------------------------------------------------------------+
Die Makrosubstitution CTRL_POINT_SIZE wird umbenannt in CTRL_POINT_RADIUS, da dies nicht die volle Größe des Kreises ist, sondern sein Radius. Der Name der Makrosubstitution war bei der Berechnung der aktiven Fläche des Formularobjekts etwas irreführend.
In der Datei der grafischen Elementobjektklasse \MQL5\Include\DoEasy\Objects\Graph\GCnvElement.mqh wurde die Methode zur Erstellung eines grafischen Elementobjekts leicht verbessert. Leider wird beim Aufruf der Methode CreateBitmapLabel() der Klasse CCanvas der Fehlercode nicht zurückgegeben. Deshalb wird der letzte Fehlercode vor dem Aufruf der Methode zurückgesetzt. Wenn die Erstellung eines grafischen Labels fehlgeschlagen ist, zeigen wir den Fehlercode im Journal an. Dadurch wird die Fehlersuche etwas verbessert.
//+------------------------------------------------------------------+
//| Create the graphical element object                              |
//+------------------------------------------------------------------+
bool CGCnvElement::Create(const long chart_id,     // Chart ID
                          const int wnd_num,       // Chart subwindow
                          const string name,       // Element name
                          const int x,             // X coordinate
                          const int y,             // Y coordinate
                          const int w,             // Width
                          const int h,             // Height
                          const color colour,      // Background color
                          const uchar opacity,     // Opacity
                          const bool redraw=false) // Flag indicating the need to redraw

  {
   ::ResetLastError();
   if(this.m_canvas.CreateBitmapLabel(chart_id,wnd_num,name,x,y,w,h,COLOR_FORMAT_ARGB_NORMALIZE))
     {
      this.Erase(CLR_CANV_NULL);
      this.m_canvas.Update(redraw);
      this.m_shift_y=(int)::ChartGetInteger(chart_id,CHART_WINDOW_YDISTANCE,wnd_num);
      return true;
     }
   CMessage::ToLog(DFUN,::GetLastError(),true);
   return false;
  }
//+------------------------------------------------------------------+
Warum war das nötig? Bei der Erstellung von Formularobjekten habe ich viel Zeit damit verbracht, herauszufinden, warum ich nicht in der Lage bin, eine grafische Ressource zu erstellen. Schließlich stellte sich heraus, dass der erstellte Name einer grafischen Ressource 63 Zeichen überschreitet. Wenn die Methode zum Erstellen einer grafischen Beschriftung der Klasse CCanvas den Fehler melden würde, müssten wir nicht nach etwas suchen. Stattdessen würden wir sofort den Fehlercode erhalten, und ich müsste nicht alle Schleifen des Aufrufs verschiedener Methoden in unterschiedlichen Klassen weitergeben.
Allerdings bringt diese Verbesserung nichts, wenn der Name der Ressource mehr als 63 Zeichen lang ist:
ERR_RESOURCE_NAME_IS_TOO_LONG 4018 The resource name exceeds 63 characters
und gibt den Fehlercode
ERR_RESOURCE_NOT_FOUND 4016 Resource with such a name is not found in EX5
aber das ist immer noch besser, da dies sofort die Frage provoziert: "Warum wird die grafische Ressource nicht erstellt?"...
Nehmen wir Verbesserungen in der Datei der erweiterten grafischen Standardobjekt-Toolkit-Klasse in der Datei \MQL5\Include\DoEasy\Objects\Graph\Extend\CGStdGraphObjExtToolkit.mqh vor.
Jedes grafische Objekt verfügt über einen oder mehrere Angelpunkte, die zur Positionierung des Objekts in einem Chart dienen. Jedem dieser Punkte ist ein Formularobjekt zugeordnet. Grafische Standardobjekte haben ihre eigenen Punkte für die Verschiebung. Sie erscheinen bei der Auswahl eines grafischen Objekts. Wir werden keine erweiterten grafischen Standardobjekte in der Bibliothek verwalten. Um die Funktionsweise zu implementieren, wird es für uns bequemer sein, Formularobjekte zu verwenden, um Angelpunkte von grafischen Objekten zu verschieben. Es kann mehr solcher Formularobjekte als Kontrollpunkte geben. Daher können wir die Anzahl der Formularobjekte nicht durch die Anzahl der Angelpunkte eines grafischen Objekts bestimmen. Wir müssen diese Zahl jedoch kennen. Fügen wir daher im öffentlichen Teil der Klasse die Methode hinzu, die die Anzahl der erstellten Formularobjekte für die Verwaltung der Angelpunkte zurückgibt und deklarieren wir die Methode, die die Punkte der Verwaltung der Angelpunkte auf vollständig transparenten Formularobjekten zeichnet:
//--- (1) Set and (2) return the size of the form of pivot point management control points
   void              SetControlFormSize(const int size);
   int               GetControlFormSize(void)                           const { return this.m_ctrl_form_size;                 }
//--- Return the pointer to the pivot point form by (1) index and (2) name
   CForm            *GetControlPointForm(const int index)                     { return this.m_list_forms.At(index);           }
   CForm            *GetControlPointForm(const string name,int &index);
//--- Return the number of (1) base object pivot points and (2) newly created form objects for managing reference points
   int               GetNumPivotsBaseObj(void)                          const { return this.m_base_pivots;                    }
   int               GetNumControlPointForms(void)                      const { return this.m_list_forms.Total();             }
//--- Create form objects on the base object pivot points
   bool              CreateAllControlPointForm(void);
//--- Draw a reference point on the form
   void              DrawControlPoint(CForm *form,const uchar opacity,const color clr);
//--- Remove all form objects from the list
   void              DeleteAllControlPointForm(void);
In der Methode, die ein Formularobjekt auf dem Basisobjekt Angelpunkt erstellt, kürzen wir den Namen eines erstellten Objekts - ersetzen Sie "_TKPP_" mit "_CP_":
//+------------------------------------------------------------------+
//| Create a form object on a base object reference point            |
//+------------------------------------------------------------------+
CForm *CGStdGraphObjExtToolkit::CreateNewControlPointForm(const int index)
  {
   string name=this.m_base_name+"_CP_"+(index<this.m_base_pivots ? (string)index : "X");
   CForm *form=this.GetControlPointForm(index);
   if(form!=NULL)
      return NULL;
   int x=0, y=0;
   if(!this.GetControlPointCoordXY(index,x,y))
      return NULL;
   return new CForm(this.m_base_chart_id,this.m_base_subwindow,name,x-this.m_shift,y-this.m_shift,this.GetControlFormSize(),this.GetControlFormSize());
  }
//+------------------------------------------------------------------+
Hier (und in der Test-EA-Datei) musste ich den Namen des erstellten Formularobjekts kürzen, da der Name der grafischen Ressource 63 Zeichen überschritt und kein Objekt erstellt wurde. Der Grund liegt in der dynamischen Ressourcenerstellungsmethode in der CCanvas-Klasse, wo der Name der erstellten Ressource aus "::"-Symbolen + dem an die Methode übergebenen (und in der oben beschriebenen Methode angegebenen) Namen + Chart-ID + Anzahl der seit dem Systemstart verstrichenen Millisekunden + Pseudozufallszahl:
//+------------------------------------------------------------------+
//| Create dynamic resource                                          |
//+------------------------------------------------------------------+
bool CCanvas::Create(const string name,const int width,const int height,ENUM_COLOR_FORMAT clrfmt)
  {
   Destroy();
//--- prepare data array
   if(width>0 && height>0 && ArrayResize(m_pixels,width*height)>0)
     {
      //--- generate resource name
      m_rcname="::"+name+(string)ChartID()+(string)(GetTickCount()+MathRand());
      //--- initialize data with zeros
      ArrayInitialize(m_pixels,0);
      //--- create dynamic resource
      if(ResourceCreate(m_rcname,m_pixels,width,height,0,0,0,clrfmt))
        {
         //--- successfully created
         //--- complete initialization
         m_width =width;
         m_height=height;
         m_format=clrfmt;
         //--- succeed
         return(true);
        }
     }
//--- error - destroy object
   Destroy();
   return(false);
  }
//+------------------------------------------------------------------+
Leider schränkt all dies die Wahl eines verständlichen Namens für das erstellte Objekt stark ein.
In der Methode zur Erstellung von Formularobjekten auf den Angelpunkten des Basisobjekts wird der Einzug von jeder Seite des Formularobjekts berechnet, um die Position und Größe des aktiven Bereichs des Formulars festzulegen, der sich in der Mitte des Formulars befinden soll, wobei seine Größe gleich den beiden Werten sein sollte, die in der Makrosubstitution CTRL_POINT_RADIUS festgelegt wurden. Da es sich um einen Radius handelt, müssen wir zwei Radiuswerte verwenden, sie von der Breite des Formulars abziehen (die Höhe des Formulars ist gleich seiner Breite) und den erhaltenen Wert durch zwei teilen, sodass die aktive Fläche des Formulars gleich dem in seinem Zentrum gezeichneten Kreis ist.
Mit der Methode SetActiveAreaShift() legen wir den Abstand des aktiven Bereichs vom Formularrand fest:
//+------------------------------------------------------------------+
//| Create form objects on the base object pivot points              |
//+------------------------------------------------------------------+
bool CGStdGraphObjExtToolkit::CreateAllControlPointForm(void)
  {
   bool res=true;
   //--- In the loop by the number of base object pivot points
   for(int i=0;i<this.m_base_pivots;i++)
     {
      //--- Create a new form object on the current pivot point corresponding to the loop index
      CForm *form=this.CreateNewControlPointForm(i);
      //--- If failed to create the form, inform of that and add 'false' to the final result
      if(form==NULL)
        {
         CMessage::ToLog(DFUN,MSG_GRAPH_OBJ_EXT_FAILED_CREATE_CTRL_POINT_FORM);
         res &=false;
        }
      //--- If failed to add the form to the list, inform of that, remove the created form and add 'false' to the final result
      if(!this.m_list_forms.Add(form))
        {
         CMessage::ToLog(DFUN,MSG_LIB_SYS_FAILED_OBJ_ADD_TO_LIST);
         delete form;
         res &=false;
        }
      //--- Set all the necessary properties for the created form object
      form.SetBelong(GRAPH_OBJ_BELONG_PROGRAM);                // Object is created programmatically
      form.SetActive(true);                                    // Form object is active
      form.SetMovable(true);                                   // Movable object
      int x=(int)::floor((form.Width()-CTRL_POINT_RADIUS*2)/2);// Active area shift from the form edge
      form.SetActiveAreaShift(x,x,x,x);                        // Object active area is located in the center of the form, its size is equal to the two CTRL_POINT_RADIUS values
      form.SetFlagSelected(false,false);                       // Object is not selected
      form.SetFlagSelectable(false,false);                     // Object cannot be selected by mouse
      form.Erase(CLR_CANV_NULL,0);                             // Fill in the form with transparent color and set the full transparency
      //form.DrawRectangle(0,0,form.Width()-1,form.Height()-1,clrSilver);    // Draw an outlining rectangle for visual display of the form location
      //form.DrawRectangle(x,x,form.Width()-x-1,form.Height()-x-1,clrSilver);// Draw an outlining rectangle for visual display of the form active area location
      this.DrawControlPoint(form,0,CTRL_POINT_COLOR);          // Draw a circle and a point in the form center
      form.Done();                                             // Save the initial form object state (its appearance)
     }
   //--- Redraw the chart for displaying changes (if successful) and return the final result
   if(res)
      ::ChartRedraw(this.m_base_chart_id);
   return res;
  }
//+------------------------------------------------------------------+
Bei der Erstellung des Formulars können wir Rechtecke zeichnen, die die Größe des Formulars und seinen aktiven Bereich für die Fehlersuche anzeigen — diese Zeichenfolgen wurden auskommentiert. Wir verwenden die neue Methode, die unten betrachtet wird, um die vollständig transparenten Kreise in der Mitte des Formulars zu zeichnen (aber ist es überhaupt eine gute Idee, sie zu zeichnen?).
Die Methode zeichnet einen Referenzpunkt auf dem Formular:
//+------------------------------------------------------------------+
//| Draw a reference point on the form                               |
//+------------------------------------------------------------------+
void CGStdGraphObjExtToolkit::DrawControlPoint(CForm *form,const uchar opacity,const color clr)
  {
   if(form==NULL)
      return;
   form.DrawCircle((int)::floor(form.Width()/2),(int)::floor(form.Height()/2),CTRL_POINT_RADIUS,clr,opacity);// Draw a circle at the center of the form
   form.DrawCircleFill((int)::floor(form.Width()/2),(int)::floor(form.Height()/2),2,clr,opacity);            // Draw a point at the center of the form
  }
//+------------------------------------------------------------------+
Die Methode enthält zwei Zeichenketten aus der oben genannten Methode. Warum wohl? Wir müssen einen Punkt mit einem Kreis in der Mitte des Formulars zu verschiedenen Zeitpunkten entweder ein- oder ausblenden. Um dies zu erreichen, rufen wir die Methode auf, indem wir die erforderliche Undurchsichtigkeit und Farbe der gezeichneten Formen angeben.
Wir entfernen die Behandlung der Mauszeigerbewegung aus der Ereignisbehandlung, da sie nicht mehr benötigt wird:
//+------------------------------------------------------------------+
//| Event handler                                                    |
//+------------------------------------------------------------------+
void CGStdGraphObjExtToolkit::OnChartEvent(const int id,const long& lparam,const double& dparam,const string& sparam)
  {
   if(id==CHARTEVENT_CHART_CHANGE)
     {
      for(int i=0;i<this.m_list_forms.Total();i++)
        {
         CForm *form=this.m_list_forms.At(i);
         if(form==NULL)
            continue;
         int x=0, y=0;
         if(!this.GetControlPointCoordXY(i,x,y))
            continue;
         form.SetCoordX(x-this.m_shift);
         form.SetCoordY(y-this.m_shift);
         form.Update();
        }
      ::ChartRedraw(this.m_base_chart_id);
     }
   if(id==CHARTEVENT_MOUSE_MOVE)
     {
      for(int i=0;i<this.m_list_forms.Total();i++)
        {
         CForm *form=this.m_list_forms.At(i);
         if(form==NULL)
            continue;
         form.OnChartEvent(id,lparam,dparam,sparam);
        }
      ::ChartRedraw(this.m_base_chart_id);
     }
  }
//+------------------------------------------------------------------+
Wir verbessern noch die abstrakte grafische Standardobjektklasse in \MQL5\Include\DoEasy\Objects\Graph\Standard\GStdGraphObj.mqh.
Im öffentlichen Teil der Klasse deklarieren wir die Methode, die es erlaubt, die Koordinaten der Angelpunkte des grafischen Objekts und der daran gebundenen Objekte gleichzeitig zu ändern:
//--- Return (1) the list of dependent objects, (2) dependent graphical object by index and (3) the number of dependent objects
   CArrayObj        *GetListDependentObj(void)        { return &this.m_list;           }
   CGStdGraphObj    *GetDependentObj(const int index) { return this.m_list.At(index);  }
   int               GetNumDependentObj(void)         { return this.m_list.Total();    }
//--- Return the name of the dependent object by index
   string            NameDependent(const int index);
//--- Add the dependent graphical object to the list
   bool              AddDependentObj(CGStdGraphObj *obj);
//--- Change X and Y coordinates of the current and all dependent objects
   bool              ChangeCoordsExtendedObj(const int x,const int y,const int modifier,bool redraw=false);
//--- Return the object of data on pivot points
   CLinkedPivotPoint*GetLinkedPivotPoint(void)        { return &this.m_linked_pivots;  }
Deklarieren wir drei Methoden für den Zugriff auf das Formular zur Verwaltung der Angelpunkte grafischer Objekte:
//--- Return the number of base object pivot points for calculating the coordinates in the (1) current and (2) specified object
   int               GetLinkedCoordsNum(void)               const { return this.m_linked_pivots.GetNumLinkedCoords();      }
   int               GetLinkedPivotsNum(CGStdGraphObj *obj) const { return(obj!=NULL ? obj.GetLinkedCoordsNum() : 0);      }
//--- Return the form for managing an object pivot point
   CForm            *GetControlPointForm(const int index);
//--- Return the number of form objects for managing reference points
   int               GetNumControlPointForms(void);
//--- Redraw the form for managing a reference point of an extended standard graphical object
   void              RedrawControlPointForms(const uchar opacity,const color clr);

private:
Hinzufügen der Methode, die die Zeit und den Preis durch Bildschirmkoordinaten festlegt:
//--- Symbol for the Chart object
   string            ChartObjSymbol(void)          const { return this.GetProperty(GRAPH_OBJ_PROP_CHART_OBJ_SYMBOL,0);                    }
   bool              SetChartObjSymbol(const string symbol)
                       {
                        if(!::ObjectSetString(CGBaseObj::ChartID(),CGBaseObj::Name(),OBJPROP_SYMBOL,symbol))
                           return false;
                        this.SetProperty(GRAPH_OBJ_PROP_CHART_OBJ_SYMBOL,0,symbol);
                        return true;
                       }
//--- Set the time and price by screen coordinates
   bool              SetTimePrice(const int x,const int y,const int modifier)
                       {
                        bool res=true;
                        ENUM_OBJECT type=this.GraphObjectType();
                        if(type==OBJ_LABEL || type==OBJ_BUTTON || type==OBJ_BITMAP_LABEL || type==OBJ_EDIT || type==OBJ_RECTANGLE_LABEL)
                          {
                           res &=this.SetXDistance(x);
                           res &=this.SetYDistance(y);
                          }
                        else
                          {
                           int subwnd=0;
                           datetime time=0;
                           double price=0;
                           if(::ChartXYToTimePrice(this.ChartID(),x,y,subwnd,time,price))
                             {
                              res &=this.SetTime(time,modifier);
                              res &=this.SetPrice(price,modifier);
                             }
                          }
                        return res;
                       }

//--- Return the flags indicating object visibility on timeframes
Wir müssen die Bildschirmkoordinaten in Zeit-/Preiskoordinaten umrechnen, um grafische Objekte in X- und Y-Bildschirmkoordinaten behandeln zu können. Die Methode prüft zunächst den aktuellen Objekttyp. Wenn es auf der Grundlage der Bildschirmkoordinaten konstruiert ist, ändern sich seine Bildschirmkoordinaten sofort. Basiert das grafische Objekt auf Zeit-/Preiskoordinaten, müssen die der Methode übergebenen Bildschirmkoordinaten zunächst in Zeit- und Preiswerte umgewandelt werden. Die so erhaltenen Werte werden dann in die Parameter des grafischen Objekts eingesetzt.
Die Methode gibt das Formular zur Verwaltung des Angelpunkts des Objekts zurück:
//+------------------------------------------------------------------+
//| Return the form for managing an object pivot point               |
//+------------------------------------------------------------------+
CForm *CGStdGraphObj::GetControlPointForm(const int index)
  {
   return(this.ExtToolkit!=NULL ? this.ExtToolkit.GetControlPointForm(index) : NULL);
  }
//+------------------------------------------------------------------+
Hier ist alles einfach: Wenn das Objekt des erweiterten Standard-Grafikobjekt-Toolkits existiert, wird das Formularobjekt nach Index zurückgegeben. Andernfalls wird NULL zurückgegeben.
Die Methode, die die Anzahl der Formularobjekte zur Verwaltung der Referenzpunkte zurückgibt:
//+------------------------------------------------------------------+
//| Return the number of form objects                                |
//| for managing control points                                      |
//+------------------------------------------------------------------+
int CGStdGraphObj::GetNumControlPointForms(void)
  {
   return(this.ExtToolkit!=NULL ? this.ExtToolkit.GetNumControlPointForms() : 0);
  }
//+------------------------------------------------------------------+
Die Methode ist ähnlich wie die oben beschriebene: wenn das Objekt des erweiterten Standard-Grafikobjekt-Toolkits existiert, wird die Anzahl der Formularobjekte zurückgegeben. Andernfalls wird 0 zurückgegeben.
Die Methode zeichnet das Formular zur Verwaltung eines Referenzpunktes eines erweiterten grafischen Standardobjekts neu:
//+------------------------------------------------------------------+
//| Redraw the form for managing the control point                   |
//| of the extended standard graphical object                        |
//+------------------------------------------------------------------+
void CGStdGraphObj::RedrawControlPointForms(const uchar opacity,const color clr)
  {
//--- If the object has no extended standard graphical object toolkit, exit
   if(this.ExtToolkit==NULL)
      return;
//--- Get the number of pivot point handling forms
   int total_form=this.GetNumControlPointForms();
//--- In the loop by the number of pivot point management forms
   for(int i=0;i<total_form;i++)
     {
      //--- get the next form object
      CForm *form=this.ExtToolkit.GetControlPointForm(i);
      if(form==NULL)
         continue;
      //--- draw a point and a circle with the specified non-transparency and color
      this.ExtToolkit.DrawControlPoint(form,opacity,clr);
     }

//--- Get the total number of bound graphical objects
   int total_dep=this.GetNumDependentObj();
//--- In the loop by all bound graphical objects,
   for(int i=0;i<total_dep;i++)
     {
      //--- get the next graphical object from the list
      CGStdGraphObj *dep=this.GetDependentObj(i);
      if(dep==NULL)
         continue;
      //--- call the method for it
      dep.RedrawControlPointForms(opacity,clr);
     }
  }
//+------------------------------------------------------------------+
Die Methode wird von ausführlichen Kommentaren begleitet. Kurz gesagt, die Idee ist folgende: Zuerst werden alle Formularobjekte, die an das aktuelle Objekt gebunden sind, neu gezeichnet. Wie wir wissen, können abhängige grafische Objekte an das Objekt gebunden sein. Diese abhängigen Objekte haben auch eigene Formularobjekte. Rufen wir also diese Methode für jedes der abhängigen Objekte in der Schleife durch alle abhängigen Objekte auf. Die abhängigen Objekte wiederum durchlaufen eine Schleife über die Liste ihrer eigenen abhängigen Objekte und rufen dieselbe Methode für sie auf. Dies wird so lange gemacht, bis alle Formularobjekte für alle verknüpften grafischen Objekte neu gezeichnet sind.
Die Methode ändert die X- und Y-Koordinaten des aktuellen und aller abhängigen Objekte:
//+----------------------------------------------------------------------+
//| Change X and Y coordinates of the current and all dependent objects  |
//+----------------------------------------------------------------------+
bool CGStdGraphObj::ChangeCoordsExtendedObj(const int x,const int y,const int modifier,bool redraw=false)
  {
//--- Set the new coordinates for the pivot point set in 'modifier'
   if(!this.SetTimePrice(x,y,modifier))
      return false;
//--- If the object is not a composite graphical object
//--- or dependent graphical objects are not attached to the object,
//--- there is nothing we can do here, return 'true'
   if(this.ExtToolkit==NULL || this.m_list.Total()==0)
      return true;
//--- Get the graphical object bound to the 'modifier' point
   CGStdGraphObj *dep=this.GetDependentObj(modifier);
   if(dep==NULL)
      return false;
//--- Get the object of the pivot point data of the attached graphical object
   CLinkedPivotPoint *pp=dep.GetLinkedPivotPoint();
   if(pp==NULL)
      return false;
//--- get the number of coordinate points the object is attached to
   int num=pp.GetNumLinkedCoords();
//--- In the loop by the object coordinate points,
   for(int j=0;j<num;j++)
     {
      //--- get the number of coordinate points of the base object for setting the X coordinate
      int numx=pp.GetBasePivotsNumX(j);
      //--- In the loop by each coordinate point for setting the X coordinate,
      for(int nx=0;nx<numx;nx++)
        {
         //--- get the property for setting the X coordinate, its modifier
         //--- and set it to the dependent graphical object attached to the 'modifier' point
         int prop_from=pp.GetPropertyX(j,nx);
         int modifier_from=pp.GetPropertyModifierX(j,nx);
         this.SetCoordXToDependentObj(dep,prop_from,modifier_from,nx);
        }
      //--- Get the number of coordinate points of the base object for setting the Y coordinate
      int numy=pp.GetBasePivotsNumY(j);
      //--- In the loop by each coordinate point for setting the Y coordinate,
      for(int ny=0;ny<numy;ny++)
        {
         //--- get the property for setting the Y coordinate, its modifier
         //--- and set it to the dependent graphical object attached to the 'modifier' point
         int prop_from=pp.GetPropertyY(j,ny);
         int modifier_from=pp.GetPropertyModifierY(j,ny);
         this.SetCoordYToDependentObj(dep,prop_from,modifier_from,ny);
        }
     }
//--- Save the current properties of the dependent graphical object as the previous ones
   dep.PropertiesCopyToPrevData();
//--- Move the management control point to new coordinates
   this.ExtToolkit.SetBaseObjTimePrice(this.Time(modifier),this.Price(modifier),modifier);
   this.ExtToolkit.SetBaseObjCoordXY(this.XDistance(),this.YDistance());
//--- Redraw the chart, if the flag is enabled
   if(redraw)
      ::ChartRedraw(m_chart_id);
//--- If all is successful, return 'true'
   return true;
  }
//+------------------------------------------------------------------+
Die Methode wird von ausführlichen Kommentaren begleitet. Kurz gesagt, wir ändern zunächst die Koordinaten des angegebenen Angelpunkts des aktuellen Objekts. Wenn an das Objekt abhängige grafische Objekte gebunden sind, sollten diese zu den neuen Koordinaten verschoben werden. Genau das geschieht in der Methode.
Wir entfernen die Behandlung von Mausbewegungen aus der Ereignisbehandlung, da sie nicht mehr benötigt wird:
//+------------------------------------------------------------------+
//| Event handler                                                    |
//+------------------------------------------------------------------+
void CGStdGraphObj::OnChartEvent(const int id,const long &lparam,const double &dparam,const string &sparam)
  {
   if(GraphElementType()!=GRAPH_ELEMENT_TYPE_STANDARD_EXTENDED)
      return;
   string name=this.Name();
   if(id==CHARTEVENT_CHART_CHANGE)
     {
      if(ExtToolkit==NULL)
         return;
      for(int i=0;i<this.Pivots();i++)
        {
         ExtToolkit.SetBaseObjTimePrice(this.Time(i),this.Price(i),i);
        }
      ExtToolkit.SetBaseObjCoordXY(this.XDistance(),this.YDistance());
      ExtToolkit.OnChartEvent(id,lparam,dparam,name);
     }
   if(id==CHARTEVENT_MOUSE_MOVE)
     {
      if(ExtToolkit!=NULL)
         ExtToolkit.OnChartEvent(id,lparam,dparam,name);
     }
  }
//+------------------------------------------------------------------+
Verbessern wir die Sammelklasse für grafische Objekte in \MQL5\Include\DoEasy\Collections\GraphElementsCollection.mqh.
Wenn wir den Mauszeiger über das Chart bewegen, während das Chart Objekte enthält, wird das Objekt, über dem der Mauszeiger schwebt, im Event-Handler definiert. Die Ereignisbehandlung des Mausstatus in Bezug auf das Objekt wird dann gestartet. Wenn wir mit dem Mauszeiger über das Objekt für die Handhabung von Angelpunkten des erweiterten grafischen Standardobjekts fahren, werden das Formular selbst, sein Index und das grafische Objekt, an das das Formular angehängt ist, im Handler angezeigt. Um dieses Formular und das grafische Objekt nicht erneut außerhalb des Handlers suchen zu müssen, müssen wir einfach die ID des grafischen Objekts, an das das Formular angehängt ist, und den Index des Formulars, über dem der Cursor schwebt, in den Variablen speichern. Anhand dieser Daten können wir schnell die erforderlichen Objekte aus den Listen auswählen und — anhand des Wertes dieser Variablen — erkennen, dass sich der Cursor über dem Formular befindet.
Wir fügen diese Variablen in die Deklaration der Methode ein, die den Zeiger auf das Formular zurückgibt, das sich unter dem Cursor befindet:
//--- Return the pointer to the form located under the cursor
   CForm            *GetFormUnderCursor(const int id,
                                        const long &lparam,
                                        const double &dparam,
                                        const string &sparam,
                                        ENUM_MOUSE_FORM_STATE &mouse_state,
                                        long &obj_ext_id,
                                        int &form_index);
Die Variablen sollen über eine Verknüpfung an die Methode übergeben werden. Mit anderen Worten, wir werden einfach die notwendigen Werte innerhalb der Methode setzen, und sie werden in den entsprechenden Variablen zur späteren Verwendung gespeichert.
Im öffentlichen Teil der Klasse deklarieren wir zwei Methoden, die die erweiterten und Standard-Grafikobjekte nach ID zurückgeben:
//--- Return an (1) existing and (2) removed graphical object by chart name and ID
   CGStdGraphObj    *GetStdGraphObject(const string name,const long chart_id);
   CGStdGraphObj    *GetStdDelGraphObject(const string name,const long chart_id);
//--- Return the existing (1) extended and (2) standard graphical object by its ID
   CGStdGraphObj    *GetStdGraphObjectExt(const long id,const long chart_id);
   CGStdGraphObj    *GetStdGraphObject(const long id,const long chart_id);
//--- Return the list of (1) chart management objects and (2) removed graphical objects
   CArrayObj        *GetListChartsControl(void)                                                          { return &this.m_list_charts_control;  }
   CArrayObj        *GetListDeletedObj(void)                                                             { return &this.m_list_deleted_obj;     }
Wir benötigen diese Methoden, um den Zeiger auf das grafische Objekt über seine ID zu erhalten. Werfen wir einen Blick auf die Implementierung dieser Methoden.
Die Methode, die das vorhandene erweiterte grafische Standardobjekt anhand seiner ID zurückgibt:
//+------------------------------------------------------------------+
//| Return the existing extended standard                            |
//| graphical object by its ID                                       |
//+------------------------------------------------------------------+
CGStdGraphObj *CGraphElementsCollection::GetStdGraphObjectExt(const long id,const long chart_id)
  {
   CArrayObj *list=this.GetListStdGraphObjectExt();
   list=CSelect::ByGraphicStdObjectProperty(list,GRAPH_OBJ_PROP_CHART_ID,0,chart_id,EQUAL);
   list=CSelect::ByGraphicStdObjectProperty(list,GRAPH_OBJ_PROP_ID,0,id,EQUAL);
   return(list!=NULL && list.Total()>0 ? list.At(0) : NULL);
  }
//+------------------------------------------------------------------+
Hier erhalten wir die Liste der erweiterten Standard-Grafikobjekte. Nur Objekte mit der angegebenen Chart ID bleiben in der Liste.
Aus der erhaltenen Liste wird ein Objekt mit der angegebenen Objekt-ID ausgewählt. Wenn die erhaltene Liste gültig und nicht leer ist, gibt den Zeiger auf das notwendige Objekt in der Liste zurück. Andernfalls wird NULLzurückgegeben.
Die Methode gibt das vorhandene grafische Standardobjekt anhand seiner ID zurück:
//+------------------------------------------------------------------+
//| Return the existing standard                                     |
//| graphical object by its ID                                       |
//+------------------------------------------------------------------+
CGStdGraphObj *CGraphElementsCollection::GetStdGraphObject(const long id,const long chart_id)
  {
   CArrayObj *list=this.GetList(GRAPH_OBJ_PROP_CHART_ID,0,chart_id);
   list=CSelect::ByGraphicStdObjectProperty(list,GRAPH_OBJ_PROP_ID,0,id,EQUAL);
   return(list!=NULL && list.Total()>0 ? list.At(0) : NULL);
  }
//+------------------------------------------------------------------+
Hier erhalten wir die Liste der grafischen Objekte nach Chart ID. In der erhaltenen Liste, lassen Sie das Objekt mit der angegebenen Objekt-ID.
Wenn die erhaltene Liste gültig und nicht leer ist, geben wir den Zeiger auf das erforderliche Objekt in der Liste zurück.Andernfalls wird NULL zurückgegeben.
Verbessern wir noch die Methode, die den Zeiger auf das unter dem Cursor befindliche Formular zurückgibt. Wir müssen zwei neue Variablen hinzufügen und initialisieren, um die ID des erweiterten grafischen Standardobjekts und den Index des Ankerpunkts, den das Formular behandelt, zu speichern, sowie den Block für die Behandlung erweiterter grafischer Standardobjekte einfügen - die Suche nach Formularen, die an diese Objekte angehängt sind (und über denen der Mauszeiger schwebt):
//+------------------------------------------------------------------+
//| Return the pointer to the form located under the cursor          |
//+------------------------------------------------------------------+
CForm *CGraphElementsCollection::GetFormUnderCursor(const int id,
                                                    const long &lparam,
                                                    const double &dparam,
                                                    const string &sparam,
                                                    ENUM_MOUSE_FORM_STATE &mouse_state,
                                                    long &obj_ext_id,
                                                    int &form_index)
  {
//--- Set the ID of the extended standard graphical object to -1
//--- and the index of the anchor point managed by the form to -1
   obj_ext_id=WRONG_VALUE;
   form_index=WRONG_VALUE;
//--- Initialize the mouse status relative to the form
   mouse_state=MOUSE_FORM_STATE_NONE;
//--- Declare the pointers to graphical element collection class objects
   CGCnvElement *elm=NULL;
   CForm *form=NULL;
//--- Get the list of objects the interaction flag is set for (there should be only one object)
   CArrayObj *list=CSelect::ByGraphCanvElementProperty(GetListCanvElm(),CANV_ELEMENT_PROP_INTERACTION,true,EQUAL);
//--- If managed to obtain the list and it is not empty
   if(list!=NULL && list.Total()>0)
     {
      //--- Get the only graphical element there
      elm=list.At(0);
      //--- If the element is a form object
      if(elm.TypeGraphElement()==GRAPH_ELEMENT_TYPE_FORM)
        {
         //--- Assign the pointer to the element for the form object pointer
         form=elm;
         //--- Get the mouse status relative to the form
         mouse_state=form.MouseFormState(id,lparam,dparam,sparam);
         //--- If the cursor is within the form, return the pointer to the form
         if(mouse_state>MOUSE_FORM_STATE_OUTSIDE_FORM_WHEEL)
            return form;
        }
     }
//--- If there is no a single form object with a specified interaction flag,
//--- in the loop by all graphical element collection class objects
   int total=this.m_list_all_canv_elm_obj.Total();
   for(int i=0;i<total;i++)
     {
      //--- get the next element
      elm=this.m_list_all_canv_elm_obj.At(i);
      if(elm==NULL)
         continue;
      //--- if the obtained element is a form object
      if(elm.TypeGraphElement()==GRAPH_ELEMENT_TYPE_FORM)
        {
         //--- Assign the pointer to the element for the form object pointer
         form=elm;
         //--- Get the mouse status relative to the form
         mouse_state=form.MouseFormState(id,lparam,dparam,sparam);
         //--- If the cursor is within the form, return the pointer to the form
         if(mouse_state>MOUSE_FORM_STATE_OUTSIDE_FORM_WHEEL)
            return form;
        }
     }
//--- If there is no a single form object from the collection list
//--- Get the list of extended standard graphical objects
   list=this.GetListStdGraphObjectExt();
   if(list!=NULL)
     {
      //--- in the loop by all extended standard graphical objects
      for(int i=0;i<list.Total();i++)
        {
         //--- get the next graphical object,
         CGStdGraphObj *obj_ext=list.At(i);
         if(obj_ext==NULL)
            continue;
         //--- get the object of its toolkit,
         CGStdGraphObjExtToolkit *toolkit=obj_ext.GetExtToolkit();
         if(toolkit==NULL)
            continue;
         //--- handle the event of changing the chart for the current graphical object
         obj_ext.OnChartEvent(CHARTEVENT_CHART_CHANGE,lparam,dparam,sparam);
         //--- Get the total number of form objects created for the current graphical object
         total=toolkit.GetNumControlPointForms();
         //--- In the loop by all form objects
         for(int j=0;j<total;j++)
           {
            //--- get the next form object,
            form=toolkit.GetControlPointForm(j);
            if(form==NULL)
               continue;
            //--- get the mouse status relative to the form
            mouse_state=form.MouseFormState(id,lparam,dparam,sparam);
            //--- If the cursor is inside the form,
            if(mouse_state>MOUSE_FORM_STATE_OUTSIDE_FORM_WHEEL)
              {
               //--- set the object ID and form index
               //--- and return the pointer to the form
               obj_ext_id=obj_ext.ObjectID();
               form_index=j;
               return form;
              }
           }
        }
     }
//--- Nothing is found - return NULL
   return NULL;
  }
//+------------------------------------------------------------------+
Die gesamte Logik des hinzugefügten Codeblocks ist in den Kommentaren beschrieben. Kurz gesagt, wir müssen ein Formularobjekt finden, über dem der Mauszeiger schwebt. Zunächst wird nach Formularobjekten gesucht, die in der Liste der grafischen Elemente der Kollektionsklasse gespeichert sind. Wenn kein einziges Formular gefunden wird, sollten wir alle erweiterten grafischen Standardobjekte bei der Suche nach ihren Formularen weitergeben — der Mauszeiger kann sich über einem von ihnen befinden. Wenn dies der Fall ist, wird die ID des erweiterten grafischen Standardobjekts, an das das Formular angehängt ist, in den Variablen gesetzt, die der Methode durch den Link übergeben werden. Der Formularindex wird ebenfalls gesetzt, sodass wir in der Lage sind den Angelpunkt und das vom Formular verwaltete grafische Objekt zu kennen.
Nun sollten wir die Interaktion des Mauszeigers mit Formularobjekten von erweiterten grafischen Standardobjekten in der Ereignisbehandlung verarbeiten. Außerdem müssen wir die Kontrolle über die Verschiebung von Formularobjekten implementieren, damit sie nicht in die obere rechte Ecke des Charts eindringen können, wo sich die Schaltfläche zur Aktivierung des Handelsmodus mit einem Klick befindet. Diese Schaltfläche bleibt immer über allen Objekten, sodass das verschobene Formular nicht in seinen Bereich eindringen sollte, um versehentliche Schaltflächenklicks zu vermeiden. Wenn das Ein-Klick-Bedienfeld bereits aktiviert ist, sollte das Formular auch nicht in seinen Bereich gelangen, da dies zu Unannehmlichkeiten bei der Handhabung des Formulars führen kann.
Werfen wir einen Blick auf die Verbesserungen und Änderungen in der Ereignisbehandlung:
//+------------------------------------------------------------------+
//| Event handler                                                    |
//+------------------------------------------------------------------+
void CGraphElementsCollection::OnChartEvent(const int id, const long &lparam, const double &dparam, const string &sparam)
  {
   CGStdGraphObj *obj_std=NULL;  // Pointer to the standard graphical object
   CGCnvElement  *obj_cnv=NULL;  // Pointer to the graphical element object on canvas
   ushort idx=ushort(id-CHARTEVENT_CUSTOM);
   if(id==CHARTEVENT_OBJECT_CHANGE  || id==CHARTEVENT_OBJECT_DRAG    || id==CHARTEVENT_OBJECT_CLICK   ||
      idx==CHARTEVENT_OBJECT_CHANGE || idx==CHARTEVENT_OBJECT_DRAG   || idx==CHARTEVENT_OBJECT_CLICK)
     {
      //--- Calculate the chart ID
      //--- If the event ID corresponds to an event from the current chart, the chart ID is received from ChartID
      //--- If the event ID corresponds to a user event, the chart ID is received from lparam
      //--- Otherwise, the chart ID is assigned to -1
      long param=(id==CHARTEVENT_OBJECT_CLICK ? ::ChartID() : idx==CHARTEVENT_OBJECT_CLICK ? lparam : WRONG_VALUE);
      long chart_id=(param==WRONG_VALUE ? (lparam==0 ? ::ChartID() : lparam) : param);
      //--- Get the object, whose properties were changed or which was relocated,
      //--- from the collection list by its name set in sparam
      obj_std=this.GetStdGraphObject(sparam,chart_id);
      //--- If failed to get the object by its name, it is not on the list,
      //--- which means its name has been changed
      if(obj_std==NULL)
        {
         //--- Let's search the list for the object that is not on the chart
         obj_std=this.FindMissingObj(chart_id);
         //--- If failed to find the object here as well, exit
         if(obj_std==NULL)
            return;
         //--- Get the name of the renamed graphical object on the chart, which is not in the collection list
         string name_new=this.FindExtraObj(chart_id);
         //--- set a new name for the collection list object, which does not correspond to any graphical object on the chart,
         //--- and send an event with the new name of the object to the control program chart
         if(obj_std.SetNamePrev(obj_std.Name()) && obj_std.SetName(name_new))
            ::EventChartCustom(this.m_chart_id_main,GRAPH_OBJ_EVENT_RENAME,obj_std.ChartID(),obj_std.TimeCreate(),obj_std.Name());
        }
      //--- Update the properties of the obtained object
      //--- and check their change
      obj_std.PropertiesRefresh();
      obj_std.PropertiesCheckChanged();
     }

//--- Handle standard graphical object events in the collection list
   for(int i=0;i<this.m_list_all_graph_obj.Total();i++)
     {
      //--- Get the next graphical object and
      obj_std=this.m_list_all_graph_obj.At(i);
      if(obj_std==NULL)
         continue;
      //--- call its event handler
      obj_std.OnChartEvent((id<CHARTEVENT_CUSTOM ? id : idx),lparam,dparam,sparam);
     }

//--- Handle chart changes for extended standard objects
   if(id==CHARTEVENT_CHART_CHANGE || idx==CHARTEVENT_CHART_CHANGE)
     {
      CArrayObj *list=this.GetListStdGraphObjectExt();
      if(list!=NULL)
        {
         for(int i=0;i<list.Total();i++)
           {
            obj_std=list.At(i);
            if(obj_std==NULL)
               continue;
            obj_std.OnChartEvent(CHARTEVENT_CHART_CHANGE,lparam,dparam,sparam);
           }
        }
     }
//--- Handling mouse events of graphical objects on canvas
//--- If the event is not a chart change
   else
     {
      //--- Check whether the mouse button is pressed
      bool pressed=(this.m_mouse.ButtonKeyState(id,lparam,dparam,sparam)==MOUSE_BUTT_KEY_STATE_LEFT ? true : false);
      ENUM_MOUSE_FORM_STATE mouse_state=MOUSE_FORM_STATE_NONE;
      //--- Declare static variables for the active form and status flags
      static CForm *form=NULL;
      static bool pressed_chart=false;
      static bool pressed_form=false;
      static bool move=false;
      //--- Declare static variables for the form index of managing an extended standard graphical object and its ID
      static int  form_index=WRONG_VALUE;
      static long graph_obj_id=WRONG_VALUE;

      //--- If the button is not pressed on the chart and the movement flag is not set, get the form, above which the cursor is located
      if(!pressed_chart && !move)
         form=this.GetFormUnderCursor(id,lparam,dparam,sparam,mouse_state,graph_obj_id,form_index);

      //--- If the button is not pressed, reset all flags and enable the chart tools
      if(!pressed)
        {
         pressed_chart=false;
         pressed_form=false;
         move=false;
         this.SetChartTools(::ChartID(),true);
        }

      //--- If this is a mouse movement event and the movement flag is active, move the form, above which the cursor is located (if the pointer to it is valid)
      if(id==CHARTEVENT_MOUSE_MOVE && move)
        {
         if(form!=NULL)
           {
            //--- calculate the cursor movement relative to the form coordinate origin
            int x=this.m_mouse.CoordX()-form.OffsetX();
            int y=this.m_mouse.CoordY()-form.OffsetY();
            //--- get the width and height of the chart the form is located at
            int chart_width=(int)::ChartGetInteger(form.ChartID(),CHART_WIDTH_IN_PIXELS,form.SubWindow());
            int chart_height=(int)::ChartGetInteger(form.ChartID(),CHART_HEIGHT_IN_PIXELS,form.SubWindow());
            //--- If the form is outside the extended standard graphical object
            if(form_index==WRONG_VALUE)
              {
               //--- Adjust the calculated form coordinates if the form is out of the chart range
               if(x<0) x=0;
               if(x>chart_width-form.Width()) x=chart_width-form.Width();
               if(y<0) y=0;
               if(y>chart_height-form.Height()) y=chart_height-form.Height();
               //--- If the chart has no one-click trading panel,
               if(!::ChartGetInteger(form.ChartID(),CHART_SHOW_ONE_CLICK))
                 {
                  //--- calculate the form coordinate so that the form does not enter the one-click trading button during relocation
                  if(y<17 && x<41)
                     y=17;
                 }
               //--- If the chart has the one-click trading panel enabled,
               else
                 {
                  //--- calculate the form coordinate so that the form does not enter the one-click trading panel area during relocation
                  if(y<80 && x<192)
                     y=80;
                 }
              }
            //--- If the form is included into the extended standard graphical object
            else
              {
               if(graph_obj_id>WRONG_VALUE)
                 {
                  //--- Get the list of objects by the object ID (there should be one object)
                  CArrayObj *list_ext=CSelect::ByGraphicStdObjectProperty(GetListStdGraphObjectExt(),GRAPH_OBJ_PROP_ID,0,graph_obj_id,EQUAL);
                  //--- If managed to obtain the list and it is not empty,
                  if(list_ext!=NULL && list_ext.Total()>0)
                    {
                     //--- get the graphical object from the list
                     CGStdGraphObj *ext=list_ext.At(0);
                     //--- If the pointer to the object is received,
                     if(ext!=NULL)
                       {
                        //--- get the object type
                        ENUM_OBJECT type=ext.GraphObjectType();
                        //--- If the object is constructed based on screen coordinates, set the coordinates to the object
                        if(type==OBJ_LABEL || type==OBJ_BUTTON || type==OBJ_BITMAP_LABEL || type==OBJ_EDIT || type==OBJ_RECTANGLE_LABEL)
                          {
                           ext.SetXDistance(x);
                           ext.SetYDistance(y);
                          }
                        //--- otherwise, if the object is based on time/price coordinates
                        else
                          {
                           //--- calculate the coordinate shift and limit the coordinates so that they are not out of the chart range
                           int shift=(int)::ceil(form.Width()/2)+1;
                           if(x+shift<0)
                              x=-shift;
                           if(x+shift>chart_width)
                              x=chart_width-shift;
                           if(y+shift<0)
                              y=-shift;
                           if(y+shift>chart_height)
                              y=chart_height-shift;
                           //--- set calculated coordinates in the object
                           ext.ChangeCoordsExtendedObj(x+shift,y+shift,form_index);
                          }
                       }
                    }
                 }
              }
            //--- Move the form by the obtained coordinates
            form.Move(x,y,true);
           }
        }

      //--- Display debugging comments on the chart
      Comment
        (
         (form!=NULL ? form.Name()+":" : ""),"\n",
         EnumToString((ENUM_CHART_EVENT)id),"\n",
         EnumToString(this.m_mouse.ButtonKeyState(id,lparam,dparam,sparam)),
         "\n",EnumToString(mouse_state),
         "\npressed=",pressed,", move=",move,(form!=NULL ? ", Interaction="+(string)form.Interaction() : ""),
         "\npressed_chart=",pressed_chart,", pressed_form=",pressed_form,
         "\nform_index=",form_index,", graph_obj_id=",graph_obj_id
        );

      //--- If the cursor is not above the form
      if(form==NULL)
        {
         //--- If the mouse button is pressed
         if(pressed)
           {
            //--- If the button is still pressed and held on the form, exit
            if(pressed_form)
              {
               return;
              }
            //--- If the button hold flag is not enabled yet, set the flags and enable chart tools
            if(!pressed_chart)
              {
               pressed_chart=true;  // Button is held on the chart
               pressed_form=false;  // Cursor is not above the form
               move=false;          // movement disabled
               this.SetChartTools(::ChartID(),true);
              }
           }
         //--- If the mouse button is not pressed
         else
           {
            //--- Get the list of extended standard graphical objects
            CArrayObj *list_ext=GetListStdGraphObjectExt();
            //--- In the loop by all extended graphical objects,
            int total=list_ext.Total();
            for(int i=0;i<total;i++)
              {
               //--- get the next graphical object
               CGStdGraphObj *obj=list_ext.At(i);
               if(obj==NULL)
                  continue;
               //--- and redraw it without a point and a circle
               obj.RedrawControlPointForms(0,CTRL_POINT_COLOR);
              }
           }
        }
      //--- If the cursor is above the form
      else
        {
         //--- If the button is still pressed and held on the chart, exit
         if(pressed_chart)
           {
            return;
           }

         //--- If the flag of holding the button on the form is not set yet
         if(!pressed_form)
           {
            pressed_chart=false;    // The button is not pressed on the chart
            this.SetChartTools(::ChartID(),false);

            //--- 'The cursor is inside the form, no mouse buttons are clicked' event handler
            if(mouse_state==MOUSE_FORM_STATE_INSIDE_FORM_NOT_PRESSED)
              {
               //--- If the cursor is above the extended graphical object pivot point control form,
               if(graph_obj_id>WRONG_VALUE)
                 {
                  //--- get the object by the object and chart IDs
                  CGStdGraphObj *graph_obj=this.GetStdGraphObjectExt(graph_obj_id,form.ChartID());
                  if(graph_obj!=NULL)
                    {
                     //--- Get the toolkit of the extended standard graphical object
                     CGStdGraphObjExtToolkit *toolkit=graph_obj.GetExtToolkit();
                     if(toolkit!=NULL)
                       {
                        //--- Draw a circle with a point on the form
                        toolkit.DrawControlPoint(form,255,CTRL_POINT_COLOR);
                       }
                    }
                 }
              }
            //--- 'The cursor is inside the form, a mouse button is clicked (any)' event handler
            if(mouse_state==MOUSE_FORM_STATE_INSIDE_FORM_PRESSED)
              {
               this.SetChartTools(::ChartID(),false);
               //--- If the flag of holding the form is not set yet
               if(!pressed_form)
                 {
                  pressed_form=true;      // set the flag of pressing on the form
                  pressed_chart=false;    // remove the flag of pressing on the chart
                 }
              }
            //--- 'The cursor is inside the form, the mouse wheel is being scrolled' event handler workpiece
            if(mouse_state==MOUSE_FORM_STATE_INSIDE_FORM_WHEEL)
              {

              }


            //--- 'The cursor is inside the active area, the mouse buttons are not clicked' event handler
            if(mouse_state==MOUSE_FORM_STATE_INSIDE_ACTIVE_AREA_NOT_PRESSED)
              {
               //--- Set the cursor shift relative to the form initial coordinates
               form.SetOffsetX(this.m_mouse.CoordX()-form.CoordX());
               form.SetOffsetY(this.m_mouse.CoordY()-form.CoordY());
               //--- If the cursor is above the active area of the extended graphical object pivot point control form
               if(graph_obj_id>WRONG_VALUE)
                 {
                  //--- get the object by the object and chart IDs
                  CGStdGraphObj *graph_obj=this.GetStdGraphObjectExt(graph_obj_id,form.ChartID());
                  if(graph_obj!=NULL)
                    {
                     //--- Get the toolkit of the extended standard graphical object
                     CGStdGraphObjExtToolkit *toolkit=graph_obj.GetExtToolkit();
                     if(toolkit!=NULL)
                       {
                        //--- Draw a circle with a point on the form
                        toolkit.DrawControlPoint(form,255,CTRL_POINT_COLOR);
                       }
                    }
                 }
              }
            //--- 'The cursor is inside the active area,  any mouse button is clicked' event handler
            if(mouse_state==MOUSE_FORM_STATE_INSIDE_ACTIVE_AREA_PRESSED && !move)
              {
               pressed_form=true;   // the flag of holding the mouse button on the form
               //--- If the left mouse button is pressed
               if(this.m_mouse.IsPressedButtonLeft())
                 {
                  //--- Set flags and form parameters
                  move=true;                                            // movement flag
                  form.SetInteraction(true);                            // flag of the form interaction with the environment
                  form.BringToTop();                                    // form on the background - above all others
                  this.ResetAllInteractionExeptOne(form);               // Reset interaction flags for all forms except the current one
                  form.SetOffsetX(this.m_mouse.CoordX()-form.CoordX()); // Cursor shift relative to the X coordinate
                  form.SetOffsetY(this.m_mouse.CoordY()-form.CoordY()); // Cursor shift relative to the Y coordinate
                 }
              }
            //--- 'The cursor is inside the active area, the mouse wheel is being scrolled' event handler workpiece
            if(mouse_state==MOUSE_FORM_STATE_INSIDE_ACTIVE_AREA_WHEEL)
              {

              }


            //--- 'The cursor is inside the window scrolling area, no mouse buttons are clicked' event handler workpiece
            if(mouse_state==MOUSE_FORM_STATE_INSIDE_SCROLL_AREA_NOT_PRESSED)
              {

              }
            //--- 'The cursor is inside the window scrolling area, a mouse button is clicked (any)' event handler workpiece
            if(mouse_state==MOUSE_FORM_STATE_INSIDE_SCROLL_AREA_PRESSED)
              {

              }
            //--- 'The cursor is inside the window scrolling area, the mouse wheel is being scrolled' event handler workpiece
            if(mouse_state==MOUSE_FORM_STATE_INSIDE_SCROLL_AREA_WHEEL)
              {

              }
           }
        }
     }
  }
//+------------------------------------------------------------------+
Alle Verbesserungen an der Methode werden durch ausführliche Kommentare im Code begleitet. Wenn Sie Fragen haben, können Sie diese gerne im Kommentarteil unten stellen.
Wenn Sie Fragen haben, können Sie diese gerne im Kommentarteil unten stellen.
Test
Um den Test durchzuführen, verwenden wir den EA aus dem vorherigen Artikel und speichern ihn in \MQL5\Experts\TestDoEasy\Part98\ als TestDoEasyPart98.mq5.
Die einzige zu implementierende Änderung ist die Erstellung von drei Formularobjekten:
//+------------------------------------------------------------------+
//|                                             TestDoEasyPart98.mq5 |
//|                                  Copyright 2021, MetaQuotes Ltd. |
//|                             https://mql5.com/en/users/artmedia70 |
//+------------------------------------------------------------------+
#property copyright "Copyright 2021, MetaQuotes Ltd."
#property link      "https://mql5.com/en/users/artmedia70"
#property version   "1.00"
//--- includes
#include <DoEasy\Engine.mqh>
//--- defines
#define        FORMS_TOTAL (3)   // Number of created forms
#define        START_X     (4)   // Initial X coordinate of the shape
#define        START_Y     (4)   // Initial Y coordinate of the shape
#define KEY_LEFT           (188) // Left
#define KEY_RIGHT          (190) // Right
#define KEY_ORIGIN         (191) // Initial properties
//--- input parameters
sinput   bool              InpMovable     =  true;          // Movable forms flag
sinput   ENUM_INPUT_YES_NO InpUseColorBG  =  INPUT_YES;     // Use chart background color to calculate shadow color
sinput   color             InpColorForm3  =  clrCadetBlue;  // Third form shadow color (if not background color)
//--- global variables
CEngine        engine;
color          array_clr[];
//+------------------------------------------------------------------+
In diesem Zusammenhang sollten wir die Berechnung der Koordinaten für jedes erstellte Formular leicht anpassen.
Das Formularobjekt wird außerhalb der Schleife deklariert.
Das erste Formular soll auf der Y-Koordinate von 100 erstellt werden, die übrigen mit dem Abstand von 20 Pixeln vom unteren Rand des vorherigen Formulars:
//+------------------------------------------------------------------+
//| Expert initialization function                                   |
//+------------------------------------------------------------------+
int OnInit()
  {
//--- Set EA global variables
   ArrayResize(array_clr,2);        // Array of gradient filling colors
   array_clr[0]=C'26,100,128';      // Original ≈Dark-azure color
   array_clr[1]=C'35,133,169';      // Lightened original color
//--- Create the array with the current symbol and set it to be used in the library
   string array[1]={Symbol()};
   engine.SetUsedSymbols(array);
   //--- Create the timeseries object for the current symbol and period, and show its description in the journal
   engine.SeriesCreate(Symbol(),Period());
   engine.GetTimeSeriesCollection().PrintShort(false); // Short descriptions
//--- Create form objects
   CForm *form=NULL;
   for(int i=0;i<FORMS_TOTAL;i++)
     {
      //--- When creating an object, pass all the required parameters to it
      form=new CForm("Form_0"+string(i+1),30,(form==NULL ? 100 : form.BottomEdge()+20),100,30);
      if(form==NULL)
         continue;
      //--- Set activity and moveability flags for the form
      form.SetActive(true);
      form.SetMovable(true);
      //--- Set the form ID and the index in the list of objects
      form.SetID(i);
      form.SetNumber(0);   // (0 - main form object) Auxiliary objects may be attached to the main one. The main object is able to manage them
      //--- Set the opacity of 200
      form.SetOpacity(245);
      //--- The form background color is set as the first color from the color array
      form.SetColorBackground(array_clr[0]);
      //--- Form outlining frame color
      form.SetColorFrame(clrDarkBlue);
      //--- Draw the shadow drawing flag
      form.SetShadow(false);
      //--- Calculate the shadow color as the chart background color converted to the monochrome one
      color clrS=form.ChangeColorSaturation(form.ColorBackground(),-100);
      //--- If the settings specify the usage of the chart background color, replace the monochrome color with 20 units
      //--- Otherwise, use the color specified in the settings for drawing the shadow
      color clr=(InpUseColorBG ? form.ChangeColorLightness(clrS,-20) : InpColorForm3);
      //--- Draw the form shadow with the right-downwards offset from the form by three pixels along all axes
      //--- Set the shadow opacity to 200, while the blur radius is equal to 4
      form.DrawShadow(3,3,clr,200,4);
      //--- Fill the form background with a vertical gradient
      form.Erase(array_clr,form.Opacity(),true);
      //--- Draw an outlining rectangle at the edges of the form
      form.DrawRectangle(0,0,form.Width()-1,form.Height()-1,form.ColorFrame(),form.Opacity());
      form.Done();

      //--- Display the text describing the gradient type and update the form
      //--- Text parameters: the text coordinates and the anchor point in the form center
      //--- Create a new text animation frame with the ID of 0 and display the text on the form
      form.TextOnBG(0,TextByLanguage("Тест 0","Test 0")+string(i+1),form.Width()/2,form.Height()/2,FRAME_ANCHOR_CENTER,C'211,233,149',255,true,true);
      //--- Add the form to the list
      if(!engine.GraphAddCanvElmToCollection(form))
         delete form;
     }
//---
   return(INIT_SUCCEEDED);
  }
//+------------------------------------------------------------------+
In OnChartEvent() kürzen wir die Länge des grafischen Objektnamens, der durch Mausklicks erzeugt wird (der vorherige war "TrendLineExt"), um zu vermeiden, dass beim Erstellen einer grafischen Ressource 63 Zeichen überschritten werden:
   if(id==CHARTEVENT_CLICK)
     {
      if(!IsCtrlKeyPressed())
         return;
      //--- Get the chart click coordinates
      datetime time=0;
      double price=0;
      int sw=0;
      if(ChartXYToTimePrice(ChartID(),(int)lparam,(int)dparam,sw,time,price))
        {
         //--- Get the right point coordinates for a trend line
         datetime time2=iTime(Symbol(),PERIOD_CURRENT,1);
         double price2=iOpen(Symbol(),PERIOD_CURRENT,1);

         //--- Create the "Trend line" object
         string name_base="TLineExt";
         engine.CreateLineTrend(name_base,0,true,time,price,time2,price2);
         //--- Get the object from the list of graphical objects by chart name and ID
         CGStdGraphObj *obj=engine.GraphGetStdGraphObjectExt(name_base,ChartID());

         //--- Create the "Left price label" object
         string name_dep="PriceLeftExt";
         engine.CreatePriceLabelLeft(name_dep,0,false,time,price);
         //--- Get the object from the list of graphical objects by chart name and ID and
         CGStdGraphObj *dep=engine.GraphGetStdGraphObject(name_dep,ChartID());
         //--- add it to the list of graphical objects bound to the "Trend line" object
         obj.AddDependentObj(dep);
         //--- Set its pivot point by X and Y axis to the trend line left point
         dep.AddNewLinkedCoord(GRAPH_OBJ_PROP_TIME,0,GRAPH_OBJ_PROP_PRICE,0);

         //--- Create the "Right price label" object
         name_dep="PriceRightExt";
         engine.CreatePriceLabelRight(name_dep,0,false,time2,price2);
         //--- Get the object from the list of graphical objects by chart name and ID and
         dep=engine.GraphGetStdGraphObject(name_dep,ChartID());
         //--- add it to the list of graphical objects bound to the "Trend line" object
         obj.AddDependentObj(dep);
         //--- Set its pivot point by X and Y axis to the trend line right point
         dep.AddNewLinkedCoord(GRAPH_OBJ_PROP_TIME,1,GRAPH_OBJ_PROP_PRICE,1);
        }
     }

//--- Handling graphical element collection events
Kompilieren Sie den EA und starten Sie ihn auf dem Chart:
Wie man sieht, tritt das Formular nicht in den Bereich ein, in dem sich die Schaltfläche für das One-Click-Trading-Panel befindet, und es tritt auch nicht in den Panel-Bereich ein, wenn es aktiviert wurde. Die Formulare für die Handhabung von Angelpunkten eines erweiterten grafischen Standardobjekts funktionieren wie vorgesehen und verlassen nicht die Grenzen des Charts.
Allerdings gibt es auch Nachteile. Nach dem Erstellen eines zusammengesetzten grafischen Objekts und dem Verschieben seiner Angelpunkte befinden sich diese oberhalb der Formularobjekte. In einigen Fällen kann sich dies als falsch erweisen. Wenn wir z. B. ein Bedienfeld haben, sollte die vom Cursor gezogene Linie unter dem Bedienfeld verlaufen und nicht über ihm gezeichnet werden. Wenn wir die Formulare einzeln anklicken, werden sie über das zusammengesetzte grafische Objekt gesetzt und es wird bei einer Verschiebung nicht über diese Formulare gezeichnet. Wenn wir drei Formulare teilweise übereinanderlegen, wird das erste aktiv, wenn wir den Mauszeiger über das zweite Formular bewegen. Ich werde dies beheben. Hier müssen wir die "Tiefe" der Position aller Formulare relativ zueinander und zu anderen Objekten auf dem Chart verwenden.
Was kommt als Nächstes?
Im nächsten Artikel werde ich meine Arbeit an zusammengesetzten grafischen Objekten und ihrer Funktionsweisen fortsetzen.
*Frühere Artikel dieser Serie:
Grafiken in der Bibliothek DoEasy (Teil 93): Vorbereiten der Funktionen zur Erstellung zusammengesetzter grafischer Objekte
Grafiken in der Bibliothek DoEasy (Teil 94): Bewegen und Löschen zusammengesetzter grafischer Objekte
Grafiken in der DoEasy-Bibliothek (Teil 95): Steuerelemente für zusammengesetzte grafische Objekte
Grafiken in der DoEasy-Bibliothek (Teil 96): Grafiken in Formularobjekten und Behandlung von Mausereignissen
Grafiken in der DoEasy-Bibliothek (Teil 97): Unabhängige Handhabung der Bewegung von Formularobjekten
Übersetzt aus dem Russischen von MetaQuotes Ltd.
Originalartikel: https://www.mql5.com/ru/articles/10521
 Lernen Sie, wie Sie ein Handelssystem mit Hilfe von ADX entwickeln
 Tipps von einem professionellen Programmierer (Teil III): Protokollierung. Anbindung an das Seq-Log-Sammel- und Analysesystem
 Lernen Sie, wie Sie ein Handelssystem mit Hilfe des ATR entwickeln
 Mehrere Indikatoren in einem Chart (Teil 03): Entwicklung von Definitionen für die Nutzer
- Freie Handelsapplikationen
- Über 8.000 Signale zum Kopieren
- Wirtschaftsnachrichten für die Lage an den Finanzmärkte
Sie stimmen der Website-Richtlinie und den Nutzungsbedingungen zu.