
This indicator shows both GMT time and your broker's time on the chart.
Simply attach the indicator to a chart, and you will see the GMT time and your broker's time displayed in the top left corner, as shown in the screenshot. By using this indicator, you can always stay informed about your broker's time, which is especially useful during daylight saving changes.
You won't have to worry about whether your broker follows the US or EU schedule, as the indicator automatically adjusts to reflect any
FREE

TrendFollowing is an multi-currency scanner that just indicates where to buy/sell: Abilities: Opens up the chart automatically with and arrow indicating where to take action. Send the signal to a telegram channel, see @fx_signal_com channel to get the idea. Configuration: No need to configure "Market Watch". Open a chart and attach the scanner to it. Trading Rules: Use only buystop/sellstop orders above/below arrow on the chart. Delete the pending order if price retraces below/above the moving
FREE

TrendFollowing is an multi-currency scanner that just indicates where to buy/sell: Abilities: Opens up the chart automatically with and arrow indicating where to take action. Send the signal to a telegram channel, see @fx_signal_com channel to get the idea. Configuration: Configure "Market Watch" with all the symbol you like to trade. Open a chart and attach the scanner to it. Trading Rules: Use only buystop/sellstop orders above/below arrow on the chart Delete the pending order if price retrac
Trading assistant that offers advanced management of your trades with optimization features. It automatically calculates the risk per trade, makes it easy to set up new orders, and offers advanced management tools such as automatic trade closing in 5 different ways. It also has other useful features that will improve your control and decision making. And best of all, you can use it in the strategy tester to perfect your tactics before trading live!
Our trading assistant is a trading tool that

Here is a powerful trading tool that will allow you to trade manually or automatically in any market, but is especially useful in markets with high volatility and liquidity.
This system has two EAs (Expert Advisors): one for Buy and one for Sell, which work independently. The operation is based on the hedging strategy and the increase in lots based on the Fibonacci sequence, which will allow you to always add the two previous lots: 1, 2, 3, 5, 8, 13...
You decide how you want to trade: you ca

It contains four major utilities: ZeroRisk Trade Pad to open and manage trades, ZeroRisk Manual Trader , a ssistant for manual traders to control the trading plan and prop firm rules, ZeroRisk Algo Trader , assistant for algo traders to control and monitor EAs and ZeroRisk Telegram Signal Provider to send manual or EA signal to telegram. This assistant supports news filter from top 3 trusted news website ( Investing.com, Daily FX , Forex Factory ) and auto GMT offset from Worl

Copy trades with ease using the MetaTrader5 trade copier - the quickest and easiest way to copy transactions between different MetaTrader 5 accounts! This innovative tool allows you to locally copy trades in any direction and quantity, giving you full control over your investments. Designed to work on both Windows PC and Windows VPS, this program is versatile and adaptable to your trading preferences. Whether you prefer to work from your desktop or a virtual private server, the MetaTrader5 trade
FREE

Copy trades with ease using the MetaTrader5 trade copier - the quickest and easiest way to copy transactions between different MetaTrader 5 accounts! This innovative tool allows you to locally copy trades in any direction and quantity, giving you full control over your investments.
Attention!
You need to download the Trade Copier Slave mq5 file as well to run this EA. Download it from here https://www.mql5.com/en/market/product/96541
Designed to work on both Windows PC and Windows VPS, this
FREE
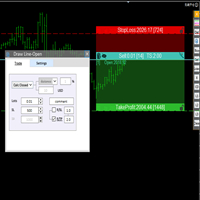
交易者的最佳伙伴! 基本使用设置 基本: 支持语言的选择切换(目前支持中文和英文) 自动识别语言 划线交易
支持英文中文自动选择,自动识别.
1.划线交易 ( 支持拖拉,支持多个订单线 ) 2.手数管理: 两种手数计算模式 ①资金的风险比例,例如设置风险百分比为1的时候,1万美金可交易1手. 计算手数 = 资金(净值或者余额或者剩余保证金) * RISK /10000 ②按亏损金额计算,本设置需要配合止损设置, 计算手数 = ( 当订单被初始下单设置的止损所止损的时候所亏损金额 计算得到的手数,小于最低手数会等于最小手数) ; 3.盈亏比等设置,
设置部分 1. 自动吸附最近高低点 2.高低点偏移 3.自动选择订单习惯 4.SL TP设置方式 5.语言设置

Bot to attach to any different chart than the one using to get the orders and send them to telegram Inputs: Telegram Bot Token, Telegram Chat ID Sends Open Price, Order Type, Lots, Take Profit and Stop Loss instantly after the trade is executed. Easy to SetUp and to use My other Bot for XAUUSD and USDCHF: https://www.mql5.com/en/market/product/94001 Just remember to go to Tolls->Options->ExpertAdvisors->Allow Web Request for listed URL: https://api.telegram.org/

该工具在您的头寸上设置止损
通过 Metatrade 策略测试器快速测试。 如果多头头寸,您的止损将在最后一个底部 或者在空头头寸的情况下,您的止损将在最后一个顶部
此外,该工具还管理您未平仓头寸的尾随。 始终将止损设置在最后形成的高点或最后形成的底部
要创建顶部和底部,我使用免费指标“支撑线和阻力线”,可通过此链接下载: 下载 metatrade 5 的免费顶部和底部指标
该工具移动资产上所有未平仓头寸的止损位置 gāi gōngjù zài nín de tóucùn shàng shèzhì zhǐ sǔn
tōngguò Metatrade cèlüè cèshì qì kuàisù cèshì. rúguǒ duōtóu tóucùn, nín de zhǐ sǔn jiàng zài zuìhòu yīgè dǐbù huòzhě zài kōngtóu tóucùn de qíngkuàng xià, nín de zhǐ sǔn jiàng zài zuìhòu yīgè dǐngbù
cǐwài, gāi gōngjù hái guǎnlǐ nín wèi

我们中的大多数人使用VPS来运行我们的交易EA,24/7,但如何监控这些终端是否正常运行?
如果他们崩溃了,或者因为更新而关闭了怎么办?我如何得到这方面的通知?
这就是我们的心跳监测发挥作用的地方。
它为您的所有终端和VPS提供24/7的监控。
那么,我们需要什么呢?
1.一个 在Cronitor 的免费用户 账户 ,一个专业的监控服务。
2.2. 这个工具在您的VPS上的图表上运行。 在MT5或连接问题的情况下,您会收到邮件通知(有更多的通知方式)。
我们使用这个技术方案来监控我们关键的后台基础设施,所以它被证明是可靠和有用的。
请 阅读完整的教程 ,在我合作伙伴的博客:Daniel Stein。
如果你愿意,你也可以使用 Nodeping服务 (付费)。
通过我们 在mql5 和 Telegram 上 的 晨间简报,获得每日市场更新的细节和截图!
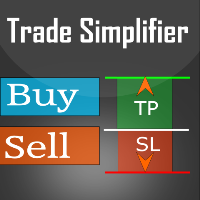
Trade simplifier is a trade panel that simplifies trade opening. It is simple and easy to understand, with key features to ease trading. Features include:
Order type selection Fixed lot entry from the chart user interface Easy Take profit entry field on the chart user interface Visual take profit selection and adjustment via the line that appears when you click the Take Profit button Easy Stop loss entry field in points on the chart user interface Visual Stop Loss selection and adjustment via
FREE

All in one Multipurpose Telegram Trade Management , Manage and Copy Trades on the go From Telegram Pro Version MT5: www.mql5.com/en/market/product/95742 Pro Version MT4: www.mql5.com/en/market/product/85691
Execute Trades on mobile with fast execution When away from desktop MT5, or scalping the market with mobile device, or needed to copy trades from telegram groups while away, or doing some other activities, Telegram EA Manager is an effective tool to perform any trade operation with swift
FREE

Market Break Lines is an utility tool to create a partition line at market openings/closings of Tokyo/London/NewYork sessions. This will help you to compare the market movements, volatility variations between the different markets.
Inputs: Inputs are simple to feed the time of Tokyo/London/NewYork sessions as per your broker server time Change Color and width of partition lines You can enable or disable any line (Hide/Show).
Please don't forget to support by giving handsome reviews/rating MT
FREE

IMPORTANT: Blocks&Levels Alerts MT5 indicador.
Gives you the ability to easy draw Blocks and Levels (support and resistance) using key shortcuts and Alerts when price touch them. Please use it and give me feedback!! It really helps! Thank you very much! DESCRIPTION:
Blocks&Levels Indicator, has useful key shortcuts for draw Levels, Blocks Zones, change chart Time Frames, Select or Deselect all drew objects. SETUP: Just install the Indicator on the Chart
Open and navigate Indicator properties
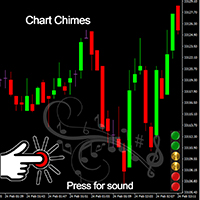
Chart Chimes 简介 - 让交易成为交响乐的 MT4/MT5 指标! 厌倦了整天盯着图表看? 交易时需要提神来保持精神振奋吗? 好吧,Chart Chimes 已经为您准备好了!
使用 Chart Chimes,每次按下该按钮时,您都会听到有趣的声音,让您的脸上露出笑容并跳到您的脚步。 想象一下在胜利的喇叭声或轻柔的竖琴声的背景下进行交易——就像拥有自己的私人管弦乐队为您加油一样!
但 Chart Chimes 不仅仅是一个有趣的消遣 - 它是一个强大的工具,可以帮助您在交易时保持专注和参与。 通过自定义声音的能力,您可以创建适合您的交易风格和偏好的独特声音环境。 需要一点提醒来坚持止损吗? 为什么不设置模仿裁判哨子的声音! 或者,也许您想用烟花的声音来庆祝成功的交易 - 可能性是无限的!
那么,当您可以拥有 Chart Chimes 时,为什么还要选择无聊、安静的图表呢? 对于想要为他们的交易程序注入一点乐趣和个性的交易者来说,这是一个完美的补充。 使用 Chart Chimes,每笔交易都可以成为您耳边的音乐!
FREE

Blind Broker System 的唯一目的是隐藏您的交易计划并使它们对您的经纪人不可见。 如果您真的想让他“失明”并确保他事先不知道您的止损水平、获利水平、交易量 - 只需使用此交易机器人。
特别鸣谢先生 Henryk Kardas 感谢这个项目的发起和想法。 请记住,MQL 提供的免费演示无法让您测试此 EA 的功能。 如需真实测试,请下载真实的演示版。
演示版链接 https://www.mql5.com/en/market/product/94192
Blind Broker System 是另一种管理订单的系统。 在某种意义上,它与 Meta Trader Terminal 内的系统相同。
不同之处在于,所有通过 Blind Broker System 提交的订单不是写入经纪人的服务器,而是写入程序的内存。
经纪人仅在市场订单发生时收到市场订单请求 - 仅此而已。
笔记! 正确操作需要不间断电源,建议使用 VPS(虚拟专用服务器)。
您可以将此系统视为您自己坐在屏幕前进行交易的副本。 在那种情况下,没有人能读懂你的想法。 您做出交易决定并执行

"Terminator Trades " EA robot, built on the powerful MQ5 code, is designed to simplify the process of closing your positions and pending orders. You can adjust if you want close all the trades or by specific symbols. With just a single click on a button, you can efficiently manage your current positions, ensuring that you never miss an opportunity to terminate a trade. Close Trades , Delete Pending Orders with Terminator Trades.
FREE

ขอบคุณ แรงบันดาลใจ จากโค้ชแพม ที่ทำให้เริ่มทำ Close all ตัวนี้ และขอขอบคุณทุกคนที่ให้ความรู็มาโดยตลอด ไม่ว่าจะทางตรงทางอ้อม ขอบคุณทุกคนที่ให้ความรู้เพื่อนร่วมเทรด ทั้งนี้เพื่อให้นักเทรดทุกคนได้มีเครื่องมือในการควบคุมการปิดการซื้อขาย จึงขอพัฒนาโปรแกรม close all version 5 ได้ใช้ทุกคน Close all and update profit Version 1.00 (MT5) Full version Give you free
For MT4 Click https://www.mql5.com/en/market/product/79252
Fix TPSL calculate
Program function
Tab 1 Close order function and show br
FREE

Introducing the "Auto Timed Close Operations", a useful utility for MetaTrader 5 traders! This utility has been developed to help traders of all levels automatically close their open positions at the exact moment they desire. With the "Auto Timed Close Operations", you gain the required control over your trades and can avoid unwanted surprises at the end of the day or at any other predefined time. We know how important it is to protect your profits and limit your losses, and that's exactly what
This EA will set breakeven or breakeven-plus for your trades, whether you have manually or automatically set stop loss or not. If your broker charges commissions per trade, you need to set breakeven plus, not just breakeven, in order to cover up those charges and properly let your trades run at zero risk. Inputs:
In the inputs section , set BEPoffsetPips to 0, to use it as a "breakeven" EA. Or set BEPoffsetPips to any amount of pips you want, to use it as a "breakeven-plus" EA. "OnProf

Customize your charts with this simple utility. Choose in the 24 pre-built color sets, or use your own colors, save them to re-use them later. You can also add a text label on your chart.
--- Chart Colors-- Color Set : 24 prebuilt color sets (select "Custom" to use colors below) Background color Foreground color Grid color Chart Up color Chart Down color Candle Bull color Candle Bear color Line color Volumes color --- Label--- Text Label : Type the text you want to appear on the chart Label P
FREE

OR One-Click - Exiting EA on OsMA and RSI
This utility will not create a new position for you nor will it find a new opportunity. It will help you exit a trade. It allows you to use the "One-Click" feature on your cellphone MT5 APP to place a trade; then the utility will modify and manage the position until it is closed. This utility will work on the following 16 symbols. USDJPY, EURJPY, AUDJPY, CADJPY, GBPJPY, EURUSD, EURGBP, EURCAD, EURAUD, AUDCHF, AUDCAD, USDCAD, USDCHF, AUDUSD, GBPUSD, N
FREE

Trade Mate is the trading tool for manual traders who want to take their trading to the next level. Packed with advanced features like automatic trailing stop loss, lot size calculation, pending orders, partial close, open trade management, and daily drawdown protection(makes it easier to stick to your daily equity risk). Trade Mate offers everything you need to trade with precision and confidence. Don't settle for less - try Trade Mate today and see the difference for yourself! Check it on You

“ 多交易品种尾随 ”实用程序为所有当前未平仓头寸移动止损(多交易品种尾随)。它主要用于协助手动交易。实用程序没有货币对名称或个人标识符(幻数)的限制 - 该实用程序绝对处理所有当前未平仓头寸。 “ Trailing Stop ”和“ Trailing Step ”参数的计量单位是点(1.00055 的价格与 1.00045 的价格之间的差值为 10 点)。 使用该实用程序的典型场景(观看视频): 起初,市场上没有未平仓头寸。该实用程序附加到最活跃的图表(例如,“EURUSD”)。然后用户手动开仓(视频中的示例:在“GBPUSD”、“XAUUSD”、“NZDUSD”和“AUDCAD”上开仓)。一旦开仓,“ 多品种尾随 ”实用程序会立即设置止损。 注意 :止损是从距离“ 经典追踪止损” 的头寸开盘价开始设置的! 随着价格朝着有利的方向移动,实用程序会移动该位置的止损。
额外: * 现在在策略测试器中(仅在策略测试器中),以最小手数开立“买入”仓位。这允许用户测试该实用程序。 * 现在提供一种新的追踪类型:“盈亏平衡追踪”。如果仓位已达到盈利,则第一次将止损移至“盈亏平
Multi Chart Sync MT5 is a tool that synchronizes the chart symbol it is placed on to other charts, it can also be customized to exclude/skip some pairs from being synchronized to other charts, It also supports prefixes and suffixes that can be set from the input parameters for brokers with none-standard symbol formats, Synchronisation can be done once or continuously where if a synchronized chart symbol changes it will be reverted to the original/master symbol. This tool comes in handy for mult
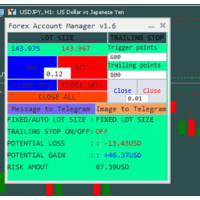
The "Lot Size" button toggles between fixed and auto lot size modes. Fixed mode uses a predetermined lot size, while auto mode calculates lot size based on a customizable percentage of the account balance, displayed at the bottom. The "Trailing Stop" button enables the activation or deactivation of the trailing stop feature. Initially set to "No Trailing," clicking the button changes it to "Trailing ON" when the trailing stop is active, and "Trailing OFF" when it is inactive. Below the button,

基于Goodtrade/GoodX 券商推出的黄金双仓对冲套利的交易模型/策略/系统,在日常的操作遇到的问题: 1、B账户跟随A账户即刻下单。 2:A账户 下单后 B账户 自动抄写止损止盈。 3:A账户平仓B账户同时平仓。 4:B账户平仓A账户也平仓。 5:不利点差下拒绝下单。 6:增加有利点值因子。 通过解决以上问题,改变了熬夜、手工出错、长期盯盘、紧张、恐慌、担心、睡眠不足、饮食不规律、精力不足等问题 目前解决这些问题后,有效提升了工作效率和盈利比例,由原来月10%盈利率提升到月45%的最佳盈利率。 原来的一名交易员只能管理操作两组账户,通过此EA提高到操作管理高达16组交易账户,或许你可以超越我们的记录,期待你的经验交流。 此EA分为: GoodtradeGoodX Tradercropy A GoodtradeGoodX Tradercropy B 是一个组合EA,假设您购买的额 GoodtradeGoodX Tradercropy A 必须同时购买 GoodtradeGoodX Tradercropy B 两个组合使用会到最佳效果。

Close it All is the EA that most of traders want because it help them did not miss their profit or protect them from the loss. Why you need the Close It All ? the EA work to close all open positions and the pending orders in the account when its reached to specified profit or loss. Input Parameters : ProfitInMoney : the number of profit in USD. LossInMoney : the number of loss in USD.
the upcoming versions including more helpful tools.

Blind Broker System 的唯一目的是隐藏您的交易计划并让您的经纪人看不到它们。如果您真的想让他“盲目”并确保他对您的止损水平、交易量、获利水平一无所知提前,只需使用此交易机器人。
Blind Broker System 是另一种管理订单的系统。
不同之处在于,所有通过 Blind Broker System 提交的订单不是写入经纪人的服务器,而是写入程序的内存。
经纪人仅在市场订单发生时收到市场订单请求 - 仅此而已。
注意! 正确操作需要不间断电源,建议使用 VPS(虚拟专用服务器)。
您可能会认为这个系统是您自己坐在屏幕前进行交易的副本。
如果您手动交易,系统将与您的行为完全相同。
演示版允许您测试机器人的几乎所有功能,但没有真正交易的可能性,但是工具上的关闭所有交易按钮将起作用。
交易水平是可见的,您可以看到它们在实际订单执行的那一刻被删除,但是机器人不会在模拟账户或真实账户中采取任何实际行动。
DEMO VERSION就像一辆汽车,但里面没有引擎。你可以上车,触摸方向盘,测试内饰的舒适度——但你不能开车。
如果您喜欢该演示版并且有兴趣
FREE

Copy Trade EA(Expert Advisor)是一种自动交易软件,可以帮助投资者自动复制其他交易者的交易策略和操作,从而获得类似于其它交易者的交易结果。该软件基于MetaTrader平台,具有易于使用、高效、灵活和自适应的特点,为投资者提供了自动化交易的一站式解决方案。
该软件支持多种交易品种,包括外汇、商品、股票和指数。其主要功能包括:
复制交易:该软件可以在实时模式下复制其他交易者的交易操作,自动将交易操作应用到您的账户中。您可以根据其他交易者的历史表现选择要跟随的交易者,并设置复制比例和风险管理策略,以满足您的投资需求。
风险管理:该软件支持多种风险管理策略,如止损、追踪止损和限价订单,可以帮助投资者最大限度地降低风险和保护资金。此外,该软件还提供了实时的交易报告和交易统计信息,以便投资者对其交易行为进行分析和调整。
自定义设置:该软件支持用户自定义设置,包括复制比例、交易量、止损和追踪止损距离、交易时间和其他参数。这些自定义设置可以根据投资者的偏好和风险承受能力进行调整。
高效运行:该软件基于MetaTrader平台,具有高效、灵活和自适应的特点。该软件支
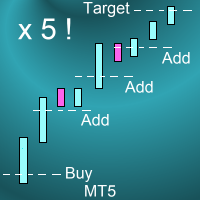
Introduction This powerful MT4 trade mangement EA offers a way potentially to aggressively multiply trade profits in a riskfree manner. Once a trade has been entered with a defined stoploss and take profit target then the EA will add three pyramid add-on trades in order to increase the overall level of profit. The user sets the total combined profit target to be gained if everything works out. This can be specified either as a multiple of the original trade profit or as a total dollar amount. Fo

In trading, losses are inevitable, but they can be managed effectively with the right tools. Lock Guard can be used for insuring positions in manual trading or as an addition to another robot. It is a powerful tool for saving a trader's main positions because it can prevent losses from getting out of hand. Lock Guard is a trading tool that helps manage losses by automatically placing pending stop orders, which act as counter orders that become market orders when the price moves against t
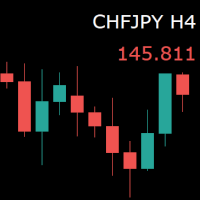
For those who monitor charts from afar, this utility is essential. It displays the chart symbol, time frame, and bid price as text. Users can adjust the text position, color, and font size. It’s also a useful tool for forex video publishers. There will be no more complaints about which symbol and time frame are displayed on the screen, even if the content is viewed on a phone. Symbol prefixes such as “_ecn” or “_stp” can be removed from the displayed symbol.
FREE
This EA Trails your stops for both manually and auto-opened trades. This EA will work whether you have manually or automatically set stop loss or not. However, for percentage based trailing. take profit must be set by the user. Trailing stop is a more flexible variation of a normal exit order. T railing stop is the practice of moving the stop-loss level closer to the current price when the price moves in your favor. Trailing the stop-loss allows traders to limit their losses and safeguard th
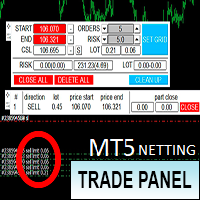
Торговая панель предназначена для установки сетки ордеров с различными параметрами. Предназначена для торговли акциями, где в одном лоте будет одна акция, на неттинговых видах счетов. Панель не дает дает открывать сетки на продажу, если уже стоят ордера на покупку и наоборот, есть возможность только управления текущей сеткой. Имеет несколько основных функций по установке ордеров в заданном диапазоне и с заданным риском, закрытию части ордеров из сетки, переносом в безубыток, закрытие части по п

此EA讓您永遠不用再計算交易量。而這也意味著您可以 更專注於分析 更專注於交易心態 做出更好的決定 得到更穩定持續的盈利 除此之外,我們還增加了兩個功能---自動盈利價格計算與每日虧損控制系統,幫助使用者更輕鬆且有紀律地執行每筆交易 可使用貨幣: 貨幣對 加密貨幣 金屬 指數 股票 使用方式: 打開MT5並點擊「演算法交易」 打開任意圖表,並將EA拖移至圖表中
視窗欄位介紹: Select_Protect_Type: 提供兩種選擇方式: DailyBalanceAndEquity InitBalanceAndEquity 此處不詳細介紹兩種保護方式。如果您想了解更多,請查看FTMO和TFT對於每日Drawdown的規則。 InitBalanceAndEquity適用於FTMO,DailyBalanceAndEquity適用於TFT。 InitBalance: 如果Select_Protect_Type選擇InitBalanceAndEquity,那麼帳戶會查看每日虧損是否達到InitBalanceAndEquity*DailyMaxDDPercentage 如果Select_Pro

Connector Solutions Binance是一个在Binance交易所复制交易的实用程序。
如果您在MetaTrader 5中进行交易,但希望您的交易放在像Binance这样的加密货币交易所,这将是有帮助的。
Connector Solutions Binance复制通过MetaTrader 5进行的模拟账户的交易(该模拟账户上必须有您想使用的加密货币)。
这个版本的Connector Solutions Binance是免费的,因此只适用于AAVEUSDT,以便你可以测试其功能度。 此外,在网站上,你可以下载复制器交易到交易所KUCOIN , KRAKEN 。
完全访问的版本可以从 https://connector.solutions 下载。 正在开始: 要想开始,您需要在Binance获得API密钥 (API keys) https://www.mql5.com/ru/blogs/post/752065
FREE

r -2aw+9 521q-
5f2 a 13r faw+ 2r 1faw +1 rf5a2- 5123r-fa 96 *123+faw1*rfa--
A FAD+6 FQ139 ,FW*+ADS,1134+* ,G1 S+ *,AS12FV *123AG*9,
24*,G A*-CVC, D*2, 2FG S,A5* 2Q,5TF DSZ/5*2,GA3S, FD,+8 AFSDV-*/5,Q21FE A/DBGEA-GT453,WS -V/A,42-*4 * S F 5 G BA 522
G E
A +
DS 9 2G -2/*Q2G+SBZD5, 2+*V 21Q4G25W2AGB+ *522G+AS5DZ2F+G FA9BD 01 -Q2*1GGSDZ+ 52/ 521Q2FWAV92+2A,5/GEB+ F3,DV *-2Q 4WG-A+* W4*25,+*ADF 5,VA, 2, A V+, D, T24 AFED* AW*GR 85*2 45*DFA B2DA*+ 254W9BDF+A 5ZSB*AG5 2*452W 5GAEFD29G+2
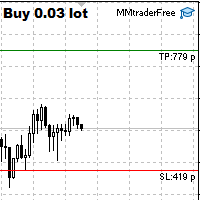
This tool is designed to quickly calculate the lot depending on the Stop Loss.
The control is done by hot keys
By default:
1 - Limit order price level
2 - Stop Loss Level
3 - Take Profit Level
Space Bar - Open an order
Escape - Cancel All 9 - Open 2 orders
Market Order
To open a Market order, click (2) and set up Stop Loss with the mouse If you want to put Take Profit - click (3) and set up Take Profit with the mouse
FREE
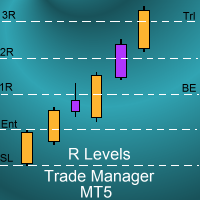
Introduction
The SDS_TradeManager EA is a powerful EA designed to manage your positions once you have been filled. It basically works a break-even stop and also a trailing stop where the trigger levels and trail levels are all specified in "R's", that is to say multiples of the initial trade risk. Many successful professional traders think about all their trades and profit taking in terms of multiples of the initial risk R. So for example, if your initial risk on your trade is 50 pips and you wa

M ulti Cross Alert! on your smartphone. Use multiple indicators to get a crossover signal on chart as well as on MetaTrader app. You can use all crossovers at the same time but it is not recommended cause your chart will look messy. Instead use combination of two indicators which will be better. IMP NOTE:- More indicators will be added in future updates. Any suggestions regarding indicators are welcome! Indicators List: 1. MA (Cross) 2. RSI (OB/OS) 3. MACD Lines (Main Line & Signal Line Cross)
FREE
Introducing the ATR EA Position Manager, a comprehensive tool designed for traders seeking advanced control. With this manager, you can effortlessly set ATR sizes for stop loss and take profit and conveniently determine Breakeven and Trailing sizes. Enjoy the flexibility of trailing on candle close or real-time, utilizing trailing distances based on ATR. Adjust Preview SL and TP lines based on % or lot size before position entry and secure profits with the automated ATR Breakeven or manual brea

Meditation Seed:
Meditation is a practice in which an individual uses a technique – such as mindfulness, or focusing the mind on a particular object, thought, or activity – to train attention and awareness, and achieve a mentally clear and emotionally calm and stable state.[1][2][3][4][web 1][web 2] Meditation is practiced in numerous religious traditions. The earliest records of meditation (dhyana) are found in the Upanishads, and meditation plays a salient role in the contemplative repertoire
FREE

OrderHelper script is super easy and trader friendly to use. It would boost your trading experience. Because it is designed to open one to multiple orders quickly with just one click. Besides using the OrderHelper script, traders can define various parameters for open orders such as the symbol, order type, lot size, stoploss, takeprofit and more. Basically, with this script traders can manage their open orders more efficiently and save their trading time. OrderHelper manages:
Open the number of

Hello Partial N Trail Ea exists to make your trader life easier. How? Well.. With this ea you can be sure that your positions are safe when you´re away or doing something else! Features: 1) -Activate/Deactivate Partial Close -Partial Close at X Pips -% to be closed 2) - Activate/Deactivate SL to Break even -Break even start -Break even Profit 3) -Activate/Deactivate Trailing Stop -Trailing Start -Trailing Distance 4) Auto place TP at x pips Auto place SL at x pips above/below last closed c
A professional tool for real-time monitoring of the account status and the work of Expert Advisors. Information about the account status can be sent to Telegram chats automatically at a specified interval or upon request.
From the screenshots of the open charts of the terminal, you receive upon request from your Telegram bot. Account information includes: 13:02 Trade monitoring by Telegram v.1.0 (headline) Account : 6802ххх RoboForex-Pro (account information)
Profit start: 2661 USD (profit earne

Line function : Displays the opening line, Stop Loss, Take Profit( 3:1 RR ) on the chart. Risk management : The risk calculation function calculates the volume of a new order taking into account the established risk and the size you want to risk. It allows you to set any Stop Loss size between 3 and 10 pips. Breakeven Button : Brings all open orders to Breakeven. Clear button : Clears the graph and the selected parameters. Trade Button : Execute the idea. Partials Button : Taking partials of al

This bot is designed to compliment your existing trading strategy. The Advanced Entry Bot is NOT FULLY AUTOMATED. Once the user finds an area of interest, he or she can set the bot to BUY or SELL and input their area of interest into the settings. In essence, this bot enables traders to do their analysis of the market; then utilize the Advanced Entry Bot to benefit from a mechanical and automated system that takes entries once price reaches their area of interest. I created this bot as a way to

With the 2UP Risk & Trade Management EA you will be able to enjoy seeing your positions being fulfilled all you gotta do is take the position and have the right lot size and the 2UP EA will do the rest
- You can set your risk per position so your account never losses more than what is supposed to, it will close automatically once you reach a certain % of DrawDown. - You can set your reward as well based on %, how much do you wanna grow your account in % per trade ?, it will close automatically

TTraderAssistant was developed to help ordinary traders in there journey to becoming successful and profitable traders. TTraderAssistant will/does not open trades on it's own, it's sole purpose is to work along the trader. TTraderAssistant will help you manage your trading risk with a variety of lot-sizing profiles available to open trades by your command and risk appetite. Various Trailing-Stop Features were built in such as Trailing-Start and Trailing-Step to help judge your exiting strateg
FREE

Auto Take Profit MT5 is designed to take profits in automatic way.
As a trader (manual or auto), you define your own expected profits schema. When you open one or several orders, the AutoTP program calculates profits then update into SL or TP automatically. It also re-calculates and updates accordingly for remaining open positions when a new order opened or an existing position closed. ---------------------------------- (Watch live in this DEMO ONLY signal https://www.mql5.com/en/signals

使用Pips Pop Up可以很容易地知道你的盈利和亏损,以点为单位!
当该专家顾问(EA)处于激活状态时,关闭头寸的基本信息,如符号名称、结果pips,以及以您的货币计算的利润或损失,会在您关闭头寸的那一刻在该EA所连接的图表上弹出*。
它还提供可选的参数来改变字体风格、大小、颜色、显示结果的位置、滚动的速度、显示的时间等。你可以改变它们,并按你的要求进行定制。
此外,Pips Pop Up总结了平仓的pips和利润/亏损(结果显示在你的图表上)。总的pips和利润随时打印在工具箱中的专家选项卡上,只有在添加该EA的图表处于活动状态时按Esc键(默认)。
*本EA显示结果的时间可能会延迟(在这种情况下,通常会在几秒钟或更短的时间内显示),因为市场的情况,互联网连接,在同一时间处理大量的订单,等等。在这种情况下,请按下reload_key键(默认为F5,你可以通过编辑这个输入来改变为其他键)。
链接到Pips Pop Up的说明视频: https://youtu.be/s8U32mm0KBQ
本EA中输入的说明:
输入的名称 输入的值 说明 1. start_x 数字(整

MAMMA 指标是初学者和高级交易者计算止损、交易量或风险水平的理想选择 。 您有一个驾驶舱来控制参数并使工具适应您的交易。 这个驾驶舱可以移动或简单地缩小以在您需要时放大。 有3种计算方法: 您可以根据您计划使用手数和止损大小自动计算风险 您可以根据预期风险和止损大小设置手数 您可以根据预期风险和手数设置理想的止损尺寸。 每次计算都可以让您知道确切的风险量,您还可以直接在图表上看到计划止损的位置。 为了不忘记您的计划,您可以设定一个目标和当天的最大损失。 最后,您可以综合查看当前市场的进度,或仅查看当天、本周和当月的进度。 作为奖励,您将收到每个新未平仓头寸的提醒,并提供理想的止损建议。 最后,驾驶舱可以在法语和英语之间进行编程。 您还有机会根据 3 个时区显示时间:经纪人的服务器、UTC 参考或您 PC 的时间。 MAMMA 仍然隐藏着一些宝藏,但我已将主要功能介绍给您。 当我开始交易时,MAMMA 是我最想念的工具,它可以保证我的结果稳定。 好交易 再见

这是一个订单工具服务,你可以通过市场订单卖出、买入或交叉订单,同时设置止损(SL)和止盈(TP)。有两个选项来设置SL和TP:按点或按价格。
此外,只需点击一个按钮,您就可以改变您在该专家顾问(EA)所连接的图表中显示的符号的所有头寸的止损和止盈,或将它们关闭。它还提供了一个功能,当你使用上述的修改/关闭按钮时,可以排除你的卖出或买入头寸。
** 注意 **
1. 如果您的经纪人不支持交叉盘,请不要使用CROSS-ORDER按钮。
2. 当您使用本EA的卖出、买入或CROSS-ORDER按钮获得新的头寸时,设置在您头寸上的SL和TP点可能会滑落一些点。这是因为SL和TP值是根据你点击它们时的价格来计算的,而不是在你的订单成交时。我希望你能记住这一点,特别是当主要经济指标公布后,强势突破刚刚发生时,等等。
链接到Meow Orderer的说明视频: https://youtu.be/Nl8JGI-QRVU
控制面板上的GUI组件的说明:
组件名称 组件类型 说明 1. "REPEAT" 字段 这是用来重复您的卖出、买入或交叉指令的,根据在这个字段中输入的数字,重复几次。例

介绍:Position Closer(头寸关闭)--为那些希望在达到目标利润或亏损时自动关闭所有未结头寸的交易者提供的解决方案。
使用 Position Closer 的好处:
易于使用 - 只需为所有未结头寸设置目标盈利和亏损。 只需设置一次--无需为每个交易对设置。 管理仓位的便捷方法,尤其是在无法随时监控仓位的情况下。 在后台运行,因此即使将 MT5 平台最小化也能正常工作。 额外功能:您还可以设置以小时、分钟或秒为单位关闭所有未平仓交易的具体时间。 使用 Position Closer 控制您的交易,将风险降至最低。今天就试试吧!
注意:为防止意外关闭未结头寸,请务必记住在不打算使用 Position Closer 进行交易时将其移除。
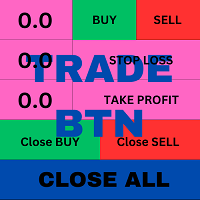
T his is an ON CHART trade management panel. In other words, ON CHART Lot Size, Buy, Sell, Stop Loss, Take Profit, Close Buy, Close Sell and Close All buttons! *IMPORTANT NOTE: Input settings are NOT usable. You can change or insert Stop Loss and Take Profit values only on the chart panel. (See the below video!) This one is MT5 version!
BUTTONS List: 1. Lot Size - (0.01) is default click on it and insert the lot size with which you want to open a trade. 2. Stop Loss - (0.0) is default click on
FREE

PROTECT YOUR FTMO Account in a simplest way Must-Have Account Protector for any Prop-trading Account and Challenge MT4 / MT5 Expert Advisor that protects your Forex Prop Trading account from an unexpected drawdown! FTMO Protector is a Tool that lets you manage trades and control your profit and loss across multiple Robots and currency pairs using a simple parameters and settings. Use as many EAs and Instruments you need, the Protector will: 1. Calculate your midnight (01:00 System time) Balan

Have you ever wanted to back-test a strategy but never wanted to risk real money? And the thought of using a demo account is exhausting as real time markets develop your skills slowly. This utility will help you develop your strategy faster and will help determine if the strategy works long-term by simulating real trading through back-tests. This will save you time as you can back-test strategies from previous price data. With the new update you can now change your lot-size add take-profit and
FREE

A depth of market product is a powerful trading tool that provides a comprehensive view of the supply and demand levels for a particular financial instrument. It provides traders with a real-time display of all the buy and sell orders that are currently available in the market, allowing them to make more informed trading decisions based on the most up-to-date information available. With Valle Depth Of Market , traders can see not only the best bid and ask prices, but also the volume of orders at
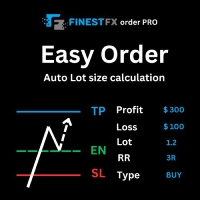
FinestFx order PRO is easy order execution and auto risk management tool developed by FinestFx official Programmer : Mohammed Rafi Just move SL,TP , Entry lines or Type SL,TP on entry columns . Lot are calculated automatically by fill out the loss cut amount. Work with all base currencies Fixed loss amount can be selected. Calculate risk rewards. Market order, limit order, and stop order are selected using buttons Supports FX, CFD, and crypto currency on MT5 Visit the owner website to see it

A simple indicator/tool to display the current timeframe in the center of the chart. The object is automatically moved to the center of the chart whenever the chart size is changed by the user.
Input Parameters :
Font (default is Arial Black) Font Size (default is 50) Font Color (default is Silver, for light theme graphics, change to black or another dark color) Font Transparency (default is 90%)
FREE
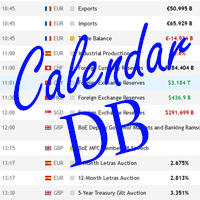
The strategy tester of the MT5 terminal does not allow robots (advisers) to read the events of the economic calendar. Therefore, news robots cannot be tested and optimized in the strategy tester. The solution to this problem is the reading of events by the robot from a previously prepared external database, in which the events of the economic calendar are recorded.
With the help of this utility, a Database File is generated from the economic calendar of the MT5 terminal. The File is created in

Trade on Binance in MT5! GRat_Crypto is a tool for manual and automated trading , including ANY available EA, ANY cryptocurrency on most popular crypto exchange Binance in the familiar MT5 environment 24/7. Features 1. ALL instruments of the 5 most popular crypto exchange Binance . 2. The ability to place ANY type of order available in MT5, both market and pending, to modify orders and positions, to delete orders and close positions (even partially), to set trailing stop and trailing profit.
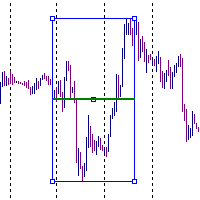
It is just an alternative fibo lines. mt4 have is a very strange drawing of fibo lines, this utilites was written for mt4, but for mt5 it may not be particularly useful. A simple Box (Rectangle) graphic element with adjustable levels binding: it is possible to specify up to 17 custom levels, all rectangles on the chart with the given prefix in their name are processed. Levels are specified in % of the height of the rectangle. A convenient graphical element for analyzing charts by growth-correct
FREE
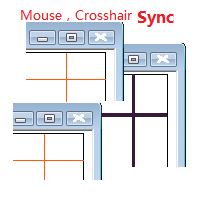
目标: 同品种多周期历史分析时候对齐时间很耗时,鼠标同步使得这一步骤可以自动完成。 使用: 1.下载程序并放在指标目录(MQL5/Indicators 或 MQL4/Indicators)里。
2.在所有需要同步的图表上加载这个指标。它就可以在同品种的图表里起作用了。 3.支持键盘的左右键,左右键在一个图表上移动时,同品种别的图表也会同步移动。
4.按下Ctrl键同时移动鼠标可以暂停或重启当前品种的同步。暂停或重启即使在所有图表关闭的状态下也是起作用的,当看见窗口没有同步时,请按住Ctrl键移动鼠标重启启动同步。 5.在未来时间区域暂停同步,工具会自动把当前品种的所有图表设置为autoscroll。在历史时间区域暂停,当前品种的所有图表会暂停在当时状态。 6.程序最大支持100个图表的鼠标和crosshair同步。
效果图如下:
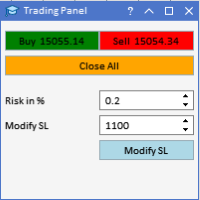
Automatic Trade Calculation Panel One-Klick-Trading Automatic calculation of Lot sice Atuomatic calulation of Stop-Loss and TakeProfit Up to 3 partial closings Trailingstop (Stop-Loss moves automatically) The lot size is calculated by the previously determined risk (e.g. 1.0% of the account size) and the distance of the Stop Loss from the entry point. The distance from the Stop Loss to the entry point results from the ATR indicator multiplied by a freely selectable factor. The Stop Loss and

You can use this tool to create as many pending orders (limit order) as you want in one button press. All inputs must be in points. You can use this useful tool when such as FED speech times. User Inputs:
MagicNumber = Magic number DeviationPoint = Deviation point number for limit orders Level = You can choise how many level do you want to create pending orders. BuyOrder = true/false SellOrder = true/false StartDistance = Distance between each level. StepDistance = Distance to be added increment
FREE

You can send MetaTrader screenshot easily to your identified telegram channel via press the send button that on the chart. TelegramBotToken: Telegram API credentials. You can create API credentials on my.telegram.org web page ChatId: Your telegram chatId. Secreenshots will be sending this channel - Please do not press the button repeatedly. This may cause your bot or ip address to be blocked. - You have to add telegram api address ( https://api.telegram.org ) in Option > Expert Advisors > Allow
FREE
您知道为什么MetaTrader市场是出售交易策略和技术指标的最佳场所吗?不需要广告或软件保护,没有支付的麻烦。一切都在MetaTrader市场提供。
您错过了交易机会:
- 免费交易应用程序
- 8,000+信号可供复制
- 探索金融市场的经济新闻
注册
登录