Nuevos indicadores técnicos para MetaTrader 5 - 14
The Brilliant Reversal Multicurrency Scanner Dashboard is a powerful tool for monitoring multiple currency pairs and timeframes using the Brilliant Reversal indicator. It organizes signals in a grid format, displaying buy/sell signals with their strength: S : Strong M : Medium W : Weak You can find the MT4 version here Brilliant Reversals MultiCurrency Scanner MT4 For detailed documentation click here Brilliant Reversal Integration: Configurable parameters include Small Bar Count, Medium Bar
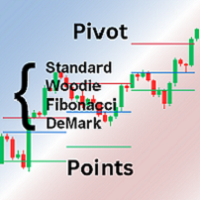
This Pivot Points Indicator can be switched between the following well-known types: Standard/Classic (7 levels) Woodie (5 levels) Fibonacci (7 levels) DeMark (3 levels) Pivot Points are calculated based on the previous day's values - according to the most common formulas on the web - and serve as an important tool for many traders, especially in day trading. They indicate possible resistance and support where increased buyer and seller interest can be expected. A common trading approach, for

Trend Following with Adaptive Weighted Average (AWA) Indicator The Adaptive Weighted Average (AWA) indicator is is a powerful technical analysis tool designed to provide highly accurate trading signals across various symbols and timeframes. This indicator leverages a unique Adaptive Weighted Average (AWA) calculation, combining multiple moving averages with user-defined weights, and incorporates advanced filtering techniques to minimize noise and whipsaw signals. The indicator is particularl
Is Zero Lag profitable? Not always, different system is for different pairs. You can play around with this indicator from Mladen, I have modified it with Bollinger Bands over T3.
You can change the period and how it calculate. MT4 version soon will be released too. Please leave a review , it helps us and we will share more indicators. .... Thank you and happy trading
FREE

Never miss a trading opportunity again and stay up-to-date with latest market developments even while on the go - welcome to The Notifier . No need to watch your charts all day: receive real-time alerts from all your favorite indicators - by push notifications and on-screen alerts. This tool notifies you on every every new (indicator) high/low, or also regularly with just a summary of the total highs/lows within the last X minutes. It also comes with its own built-in notifications that can be
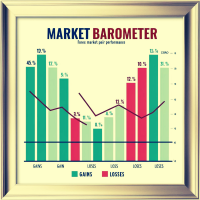
Market Barometer is a cheat code for trading, it acts as a "barometer" for market sentiment across various pairs, showcasing their changes. You can tell right away what to trade. You can trade trends or reversals. MT4 Version: https://www.mql5.com/en/market/product/127406 Market Barometer is a powerful tool designed to track and visualize the percentage changes across multiple currency pairs. By analyzing the price shifts of different forex pairs, it helps you understand how they are correla

Crypto Market Barometer is a special crypto version of Market Barometer: https://www.mql5.com/en/market/product/127467 and is a cheat code for trading cryptos, it acts as a "barometer" for market sentiment across various pairs, showcasing their changes. You can tell right away what to trade. You can trade trends or reversals. Crypto Market Barometer is a powerful tool designed to track and visualize the percentage changes across multiple crypto pairs. By analyzing the price shifts of different

Momentum Explosion Pro is an advanced trading indicator designed to help traders identify and capitalize on powerful market movements. By analyzing momentum and volatility dynamics, this tool provides clear buy and sell signals, empowering traders to make precise and timely decisions. Key Features: Momentum and Explosion Signals: Accurately detects shifts in market momentum and explosive price movements to highlight profitable opportunities. Customizable Alerts: Stay informed with notificati
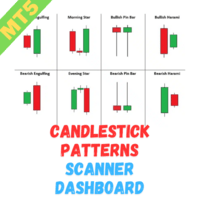
The Candlestick Pattern Scanner Dashboard MT5 is a powerful tool for monitoring candlestick patterns across multiple currency pairs and timeframes. It organizes detected patterns in a grid format, displaying the pattern's short form and how many candles ago it appeared (e.g., BUEN(3) for a Bullish Engulfing pattern detected three candles ago). You can find the MT4 version here Candlestick Pattern Multicurrency Scanner MT4 For detailed documentation click here Candlestick Pattern Detection: Id

The Ichimoku Multicurrency Scanner Dashboard MT5 is a powerful trading tool designed for monitoring multiple currency pairs and timeframes using Ichimoku Kinko Hyo. It organizes signals in a grid format, with symbols grouped by base currencies and timeframes, ranging from M1 to MN1. Traders can enable or disable specific timeframes to suit their strategies. You can find the MT4 version here Ichimoku Cloud Multicurrency Scanner MT4 For detailed documentation click here Ichimoku Integration: The
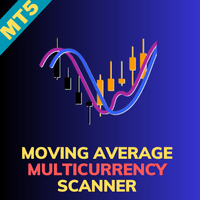
The Moving Average Multicurrency Scanner Dashboard MT5 is a powerful trading tool designed to monitor multiple currency pairs and timeframes using customizable moving averages. It organizes signals in a grid format, displaying each symbol’s status across timeframes from M1 to MN1. Traders can enable or disable specific timeframes to align with their strategies. You can find the MT4 version here Moving Average Multicurrency Scanner MT4 For detailed documentation click here
Moving Average I

The Parabolic SAR Multicurrency Scanner Dashboard MT5 is a comprehensive tool for monitoring multiple currency pairs and timeframes using the Parabolic SAR (PSAR) indicator. It organizes signals in a grid format, displaying each symbol’s status across timeframes from M1 to MN1. Traders can enable or disable specific timeframes based on their strategies. For detailed documentation click here Parabolic SAR Integration: The dashboard uses the PSAR indicator with customizable parameters for Step and
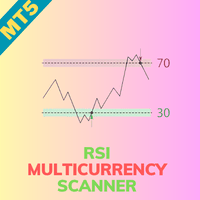
The RSI Multicurrency Scanner Dashboard MT5 is a powerful tool designed to monitor multiple currency pairs and timeframes using the Relative Strength Index (RSI). It organizes signals in a grid format, displaying each symbol’s status across timeframes from M1 to MN1. Traders can enable or disable specific timeframes to suit their strategies. You can find the MT4 version here RSI Multicurrency Scanner MT4 For detailed documentation click here RSI Indicator Integration: The dashboard supports fou
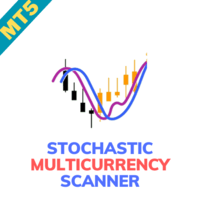
The Stochastic Multicurrency Scanner Dashboard MT5 is a powerful tool for monitoring multiple currency pairs and timeframes using the Stochastic oscillator. It organizes signals in a grid format, displaying each symbol’s status across timeframes from M1 to MN1. Traders can enable or disable specific timeframes to suit their strategies. You can find the MT4 version here Stochastic Oscillator Multicurrency Scanner MT5 For detailed documentation click here Stochastic Oscillator Integration: The
The Supertrend Multicurrency Scanner Dashboard MT5 is a powerful tool designed to monitor multiple currency pairs and timeframes using the Supertrend indicator. It organizes signals in a grid format, displaying each symbol’s trend status across timeframes from M1 to MN1. Traders can enable or disable specific timeframes to align with their strategies. You can find the MT4 version here Supertrend Multicurrency Scanner MT4 For detailed documentation click here Supertrend Integration: The d

Description:
This indicator adds customizable buttons for symbols (currency pairs) and timeframes directly onto the chart. It allows traders to quickly switch between different symbols and timeframes by simply clicking on the respective buttons. The indicator also includes a toggle button to show or hide all the symbol and timeframe buttons, providing flexibility in chart customization. Key Features: Symbol Buttons: Automatically generates buttons for symbols from the Market Watch or allows man
A professional-grade Bollinger Bands percentage analyzer.
Transform your trading strategies with the BBPCT Indicator, an advanced Bollinger Band Percentage indicator developed by iDevelop.expert. This tool is tailored to provide traders with a clear and actionable visualization of price movements relative to Bollinger Bands, along with insightful overbought and oversold signals.
Key Features: Dynamic Histogram Visualization: A dual-colored histogram for quick identification: Green bars indicat
FREE
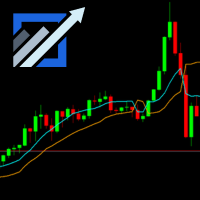
Boost your trading accuracy with the SSL Channel Indicator , designed to identify trends and precise entry points. This dynamic tool adapts to all trading instruments and timeframes. Perfect for scalpers, day traders, and swing traders, the SSL Channel Indicator simplifies market analysis, helping you trade confidently and effectively. Unlock your trading potential today! MT4 Link- https://www.mql5.com/en/market/product/127493

Do Youe use Multi Epert Advisor? You need this Indicator ...
TradeResultsByMagic Overview This indicator creates a detailed trading report in a separate window, displaying performance metrics for trades grouped by magic numbers across multiple symbols. It shows various metrics including deal counts, lot sizes, prices, profits, win rates, and exposure percentages. Key Features Tracks multiple magic numbers (up to 1024) Supports multiple symbols per magic number (up to 100 per magic) Displays cus
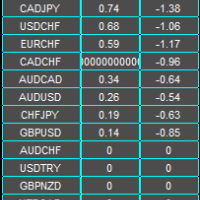
Abbeyfx Swap Dashboard displays your broker swap/interest rate. The implied swap/interest rate differential is for all currency pairs you have in your market watch. Interest rate differential: The key factor traders consider is the difference in interest rates between two currencies involved in a pair, known as the "interest rate differential Impact on currency value: A higher interest rate typically makes a currency more attractive, causing its value to rise relative to other currencies with lo

Price Position Indicator....
This indicator tells you exactly when to buy or sell in the market with alerts, it works on any time frame and with any market of your choice, it is highly accurate and is definitely worth the investment, this indicator performs well with the moving average indicator i also have for sale, be sure to check out my profile to see my products.
it gives out buy and sell signals based on where the current price is, it follows the trend as well.
【R】【Y】【M】 【R】【Y】【M】 【R】【Y】【M】
The Linear Regression Channel Indicator is a powerful technical analysis tool that helps traders capture price trends and potential reversal points. By calculating and displaying linear regression channels, bands, and future projections, this indicator offers an in-depth perspective on market dynamics. It aids in identifying overbought and oversold conditions, trend direction, and provides clear visual cues for potential future price movements.
STILL ON I
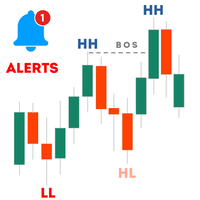
El Indicador Haven Market Structure ayuda a los traders a identificar puntos de reversión y rupturas de la estructura en cualquier marco de tiempo. Marca los máximos más altos (HH), los máximos más bajos (LH), los mínimos más altos (HL), los mínimos más bajos (LL) y resalta los niveles de ruptura de la estructura (BOS).
Otros productos -> AQUÍ Características principales: Longitud personalizable para identificar puntos de reversión: Establezca la longitud para identificar con precisión lo
FREE

El indicador Haven FVG es una herramienta para analizar mercados que permite identificar áreas de ineficiencia (Fair Value Gaps, FVG) en el gráfico, proporcionando a los traders niveles clave para el análisis de precios y la toma de decisiones comerciales. Otros productos -> AQUÍ Características principales: Configuraciones de colores individuales: Color para FVG alcista (Bullish FVG Color). Color para FVG bajista (Bearish FVG Color). Visualización flexible de FVG: Cantidad máxima de v
FREE
Special offer : ALL TOOLS , just $35 each! New tools will be $30 for the first week or the first 3 purchases ! Trading Tools Channel on MQL5 : Join my MQL5 channel to update the latest news from me Descripción general
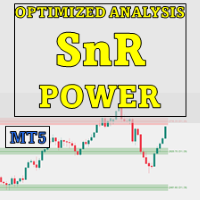
OA SnR Power es una herramienta poderosa diseñada para ayudar a los traders a identificar y evaluar la fortaleza de los niveles de soporte y resistencia. Al incorporar factores clave como el volumen de operaciones, la frecuencia de rebote y el recuento de pruebas, es
FREE

Arrow Micro Scalper es un indicador diseñado para especulación y comercio a corto plazo, integrado en cualquier gráfico e instrumento financiero (monedas, criptomonedas, acciones, metales).
En su trabajo utiliza análisis de ondas y un filtro de dirección de tendencia. Recomendado para usar en marcos de tiempo de M1 a H4.
Cómo trabajar con el indicador.
El indicador contiene 2 parámetros externos para cambiar la configuración, el resto ya está configurado de forma predeterminada. Las flechas gr

Indicador Slope Channel para MetaTrader
¿Buscas una herramienta para analizar tendencias del mercado que se adapte a cualquier estilo de trading? Slope Channel – ¡Tu asistente confiable para identificar movimientos de precios y niveles clave del mercado! ¿Qué es Slope Channel? Slope Channel es un indicador innovador que construye un canal inclinado en el gráfico, calculando automáticamente sus parámetros basados en extremos locales. Esta herramienta destaca la opción óptima del canal, pe
FREE

BoomCrash Turbo
"¡Comercio con máxima velocidad y precisión!" BoomCrash Turbo es un poderoso indicador semiautomático diseñado específicamente para operar con los índices Boom y Crash en la plataforma MetaTrader 5. Es ideal para traders que buscan mejorar sus resultados y aprovechar al máximo las oportunidades del mercado. Características del indicador:
Señales precisas: Notificaciones en tiempo real para entradas y salidas de operaciones.
Toma de decisiones acelerada: Perfecto para re

Gráfico combinado "Pillar Candles" Si prefiere operar sin indicadores, entonces este indicador será el único en su arsenal. Transformará su gráfico y hará que su análisis del mercado sea más claro.
¿Qué problema resuelve este indicador? Lo más importante para operar con éxito es ver claramente los valores OHLC. La mayoría de los operadores utilizan el tipo de gráfico de velas japonesas. Pero tiene una desventaja significativa. Debido al diferente grosor de los cuerpos y sombras, el ojo human

Includes almost all the concepts related to Volume Profile: POC , Value Area , Developing POC , Anchored VWAP , Volume Delta ; since the “Total” in its name. It is fast in its calculations and simple to work with.
Features:
1. Selectable calculation timeframe to find most traded levels.
2. Capable of calculating Volume Profile based on tick data
3. Adjustable histogram bars by their count.
4. Adjustable histogram bars by their height (price range).
5. Showing Value Area (VA

Trend Indicator with Adaptive Color Change: The Perfect Tool for Effective Trading! Looking to determine the trend direction with maximum precision? Meet our trend indicator , which dynamically changes the color of its moving average based on the current market direction. This tool is suitable for both beginners and experienced traders, helping you make informed decisions with clear, actionable signals. What You’ll Get: Adaptive Trend Analysis : The moving average changes its color according to

Trend Lines Supports and Resistances is an indicator that analyses the market structure, identifies Pivot Points, displays active Support/Resistance zones and trend levels.
Main Features: Defining and displaying Pivot Points. Analyse Pivot Points to build and display trend lines. Setting up visual display of trend lines. Setting up trend lines broken notifications. Analyse Pivot Points to define and display support and resistance levels. Setting up visual display of support and resistance leve
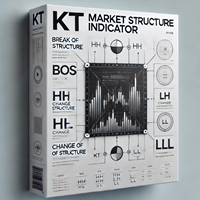
The KT Market Structure intelligently detects and displays Break of Structure (BOS) , Change of Character (CHoCH) , Equal Highs/Lows (EQL) , and various significant swing high/low points using our proprietary algorithm for accurate pattern detection. It also offers advanced pattern analysis by effectively demonstrating the captured profit for each pattern. A fully automated EA based on this indicator is available here: KT Market Structure EA MT5
Features
Accurate Pattern Detection: Our advance

The Simple ICT Concepts Indicator is a powerful tool designed to help traders apply the principles of the Inner Circle Trader (ICT) methodology. This indicator focuses on identifying key zones such as liquidity levels, support and resistance, and market structure, making it an invaluable asset for price action and smart money concept traders. Key Features Market Structure : Market structure labels are constructed from price breaking a prior swing point. This allows a user to determine the curr
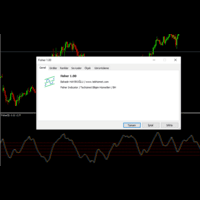
With Fisher level indicator. Many settings can be changed by the user, indicator created with original calculation. You can adjust the levels you create according to yourself and provide more stable displays. What is Fisher indicator: It transforms data that does not normally show a normal distribution, such as market prices. In essence, the transformation helps to better identify price reversals on a chart by making peak swings relatively rare events.
FREE
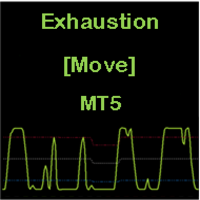
CONSTITUTION Exhaustion [Move] is an indicator consisting of an oscillator and three dynamic levels (upper, middler, lower). The inputs can be used to adjust the oscillator, dynamic levels and warning signals. It is designed for the MT5 platform only. APPLICATION This indicator should be used with a trend filter [e.g. moving averages, MA 200]. It detects the exhaustion of correction movements within a trend, thus giving entry points for new trades. It is usually used in the RENKO chart for SCA

iExposure Fox Wave – Comprehensive Position Monitoring Indicator iExposure Fox Wave is an advanced MetaTrader indicator designed to provide detailed monitoring of all open trading positions in a clear, tabular format. This tool is perfect for traders who want all essential trade information in one place. Key Features: Symbol: Displays the instruments (currency pairs or other symbols) with open positions. Deals: Number of open trades (transactions) for each symbol. Buy lots & Buy price: Total vol
Indicador com regra de coloração para estratégias que utilizam Inside Bar! Quando rompe a barra inside, se for para cima, compra e posiciona o stop loss na mínima da barra inside. Se romper para baixo, vende e posiciona o stop loss na máxima da barra inside. Pode ser aliada a tendências de outros tempos gráficos e outros filtros.
Grupo de sinais gratuito no telegram: https://t.me/InsideBarRST
FREE
Rinse and Repeat indicator for 3 day/session/week setups. Indicator daily features: Daily close/high/low Weekly open/high/low/close Month open/high/low/close Daily breakouts Daily failed breakouts Asia/London/New York sessions Inside days Outside days Green days Red days
Indicator weekly features:
Weekly breakouts Week dividers Indicator other features: Dashboard with bar end countdown and running PnL
FREE

Safe travel is possible only on a road with good markings and correct road signs . Due to the very active use of my indicator on MT4 , I decided to switch it to MT5 . The indicator shows : - pulse waves ( bold sloping lines ) ; - corrective waves ( thin inclined waves ) ; - Series of waves up ( blue ) ; - wave series down ( purple ) ; - wave series lengths ( numbers near the zigzag vertices ) ; - breakdown levels of a series of waves ( short green and red lines ) ; - profit targets ( Fibonacci g
This is the Super Trend Dashboard MT5. This dashboard will scan multiple timeframes in MT5 platform, from M1 chart to D1 chart. It will send the buy/sell signals by alert on the platform or sending notification to your phone or message you via a email.
The buy signal is generated when the super trend line flip from SELL to BUY. The sell signal is is generated when the super trend line flip from BUY to SELL.
The up trend color will be displayed depending on the current Super Trend value.
This is the Heiken Ashi Dashboard MT5. This dashboard will scan multiple timeframes and symbols in MT5 platform, from M1 chart to D1 chart. It will send the buy/sell signals by alert on the platform or sending notification to your phone or message you via a email.
The buy signal is generated when the heiken ashi bar changes its color from red to white. The sell signal is is generated when the heiken ashi bar changes its color from white to red. The up/down trend color will be displayed depend
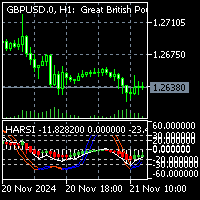
To get access to MT4 version please click here . This is the exact conversion from TradingView:"Heikin Ashi RSI Oscillator" by "jayRogers" The screenshot shows similar results from tradingview and Metatrader when tested on ICMarkets on both platforms. This is a light-load processing indicator. It is a non-repaint indicator. I removed colored areas option to fit into metatrader graphics. Buffers are available for processing in EAs. You can message in private chat for further changes you need.
The MACD Divergence Indicator is a powerful tool designed to identify Classical (Normal) Divergences on the MACD, which can signal potential market reversals or continuation trends. Divergences occur when the price and the indicator move in opposing directions, highlighting potential shifts in momentum. What is a Classical (Normal) Divergence? Classical Divergences are categorized into two main types: Bullish Divergence: Occurs when the price forms lower lows, but the MACD forms higher lows. Thi
This is the ADX Dashboard MT5. This dashboard will scan multiple timeframes in MT5 platform, from M1 chart to D1 chart. It will send the buy/sell signals by alert on the platform or sending notification to your phone or message you via a email.
The buy signal is the cross over of DI+ and DI- The sell signal is the cross under of DI+ and DI-.
The up trend color will be displayed when DI+ is greater than DI- The down trend color will be displayed when DI+ is less than DI- The value of ADX value wi

This indicator combines two tools: MACD and OsMA . MACD is displayed as two lines: The black line represents the main MACD line. The orange line represents the MACD signal line. OsMA Histogram is shown in two colors: Green bars indicate growth. Red bars indicate decline. You can customize the line colors and thickness in the settings. This indicator serves as an addition to the Combo View Impulse System indicator but can also be used independently. Parameters: Fast EMA

FTU Qs Buy Sell Arrow MT5
The indicator is for MT5 platform, can be used stand alone but best combined with other indicators or strategies. Many arrow changes at certain times, so best to filter the signals using minimum one concept or strategy Combines various indicators such as stochastic, rsi and moving average to draw an arrow for suggestion of entry or change in trend
Indicator Features: Sell and Buy arrows with settings Visual and sound alert Colour change, more features coming soon Ne

This indicator combines several functionalities: Value Zone Displays two exponential moving averages (EMAs): 13-period EMA in red. 22-period EMA in blue. Impulse System (based on Dr. Alexander Elder's methodology) Candles are color-coded to indicate trade restrictions: Red candles prohibit buying. Green candles prohibit selling. Blue candles allow both buying and selling. Recommended for use on two timeframes for enhanced analysis. 3x ATR Channel A channel based on 3 times the AT

Description: The "Supports and Resistances with Daily Pivots v2" indicator is a comprehensive tool that displays pivot points and support/resistance levels on the chart. It provides both daily, weekly, and monthly pivot levels, helping traders identify potential turning points and support/resistance areas. The indicator also includes alerts to notify traders when the price reaches these levels.
Key Features Pivot Point Types: Standard Pivot: Calculates pivot points using the standard method. F
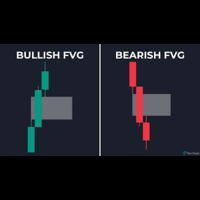
It identifies fair value gaps which are currently valid. Settings: Bullish FVG Color: To set the color of bearish FVGs. Bearish FVG Color: To set the color of bearish FVGs. Minimum Size: For filtering the signals. The restricts a minimum size for the FVG to be considered valid. For custom additions you can reach out to developer here MT4 Version available here

Introducing PivotWave – your ultimate trading companion that redefines precision and market analysis. Designed with traders in mind, PivotWave is more than just an indicator; it’s a powerful tool that captures the pulse of the market, identifying key turning points and trends with pinpoint accuracy. PivotWave leverages advanced algorithms to provide clear visual signals for optimal entry and exit points, making it easier for traders to navigate volatile market conditions. Whether you are a begin
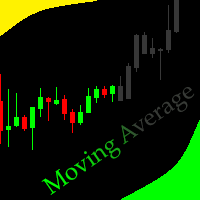
this Moving Average indicator is like no other, making trading easier for you,the settings are preset and can't be changed but don't let that stop you because it's highly accurate.
If the candle closes above the line you enter buys and below then you go for sells, this is build to help beginner traders on their journey to becoming profitable
Easy and quick to understand
FREE

RXTL indicator Indicator is based on ATR to calculate trend and direction bias Works on all timeframes
Required for the other EA to work accordingly Download and ensure it is placed in the Indicator folder Do inbox me for any questions
installing instructions 1) Download RXTL indicator 2) If indicator does not appear, refresh indicator tab 3) Drag indicator to active chart 4) Use it alongside with other EA
FREE

Индикатор собирает данные из биржевого стакана, суммируя отложенные ордера на покупку или продажу. Далее, по сумме ордеров определяется общее направление, куда смотрят участники рынка. Если суммарные покупки/продажи превышают определенный коэффициент, то производится сигнал. Настройки: Timer=5 // указывается как часто обновлять данные по рынку в секундах. Чаще чем раз в 10 секунд ставить не рекомендуется. X-size =700 // размер окна по оси Х. Y-size=650// размер окна по оси Y. Only "Market Watch"

Swing Points Pro v2 – Enhanced Highs and Lows Indicator with Push Notifications Overview :
The Swing Points Pro v2 indicator is a powerful and reliable tool designed to help traders identify critical swing highs and lows on their charts. Whether you trade Forex, Stocks, or Crypto, this updated version provides advanced features to enhance your market analysis, with real-time push notifications for key market movements. Key Features : Accurate Swing Identification : Pinpoints major swing highs a

Special offer : ALL TOOLS , just $35 each! New tools will be $30 for the first week or the first 3 purchases ! Trading Tools Channel on MQL5 : Join my MQL5 channel to update the latest news from me ¡Descubre el poder del concepto de Inversion Fair Value Gap (IFVG) de ICT con el Inversion Fair Value Gaps Indicator ! Esta herramienta de última generación lleva los Fair Value Gaps (FVG) al siguiente nivel al identificar y mostrar zonas de FVG invertidas, que son áreas clave de soporte

Pro Thunder V10: ¡El Indicador Definitivo para Operaciones de Opciones Binarias! Lleva tu trading al siguiente nivel con Pro Thunder V10 , el pináculo de las operaciones con opciones binarias. Impulsado por tecnología avanzada de Redes Neuronales con IA , este indicador revolucionario está diseñado para ofrecer precisión y confiabilidad incomparables. Desde señales en tiempo real que no se repintan hasta un rendimiento impecable en condiciones de mercado volátiles, Pro Thunder V10 es t
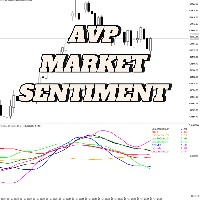
AVP Market Sentiment es una herramienta desarrollada para analizar la relación entre varios activos en la misma ventana de subgráfico. Es especialmente útil para comparar tickers con una interrelación bien estudiada (como los índices futuros versus el VIX, por ejemplo). Es muy útil cuando se desea monitorear varios tickers simultáneamente para la toma de decisiones en uno o más de ellos. La herramienta permite a los usuarios elegir los tipos de medias móviles utilizadas en la plataforma, así com
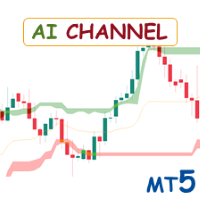
Special offer : ALL TOOLS , just $35 each! New tools will be $30 for the first week or the first 3 purchases ! Trading Tools Channel on MQL5 : Join my MQL5 channel to update the latest news from me El indicador AI Channels utiliza el clúster K-means deslizante , una poderosa técnica de aprendizaje automático en el análisis de clústeres, para ofrecer información en tiempo real sobre las tendencias de precios subyacentes. Este indicador crea canales adaptativos basados en datos de pr
FREE
MLD RSI MT5: Potencia al Máximo el RSI con Alertas Personalizadas Introducción El indicador MLD RSI para MT5 incorpora funcionalidades avanzadas al clásico Índice de Fuerza Relativa (RSI), incluidas alertas personalizables y confirmación de tendencias. Esta herramienta es ideal tanto para principiantes como para traders experimentados y es compatible con múltiples mercados, incluidos Forex, acciones, criptomonedas e índices sintéticos. ¿Qué es el RSI? El Índice de Fuerza Relativa (RSI) mide el i
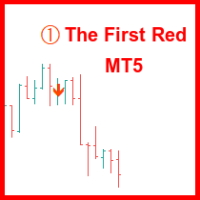
El indicador "The First Red", basado en la estrategia creada por Dariusz Dargo, está diseñado para identificar y marcar velas en el gráfico que cumplan con las condiciones de la estrategia "The First Red" y sus extensiones, como "Second Red", "First Green" y "Second Green". La estrategia se centra en analizar extremos locales y señales del oscilador MACD. Primera vela roja (First Red Candle): Una vela se marca como "First Red" cuando establece un máximo local y el histograma del MACD cambia de

¡Desata el poder de Fibonacci con el Adaptive Fibonacci Trend Ribbon (AFTR)! ¿Estás listo para revolucionar tu estrategia de trading? AFTR no es solo otro indicador; es tu herramienta definitiva para detectar tendencias, analizar reversiones y tomar decisiones precisas con una claridad inigualable. Con la alineación de las secuencias de Fibonacci y un conjunto de medias móviles avanzadas, este indicador está diseñado para los traders que exigen precisión y flexibilidad. Características clave qu

Desbloquea el poder de la inteligencia artificial con Neural FX Indicator de SS7Trader, una herramienta avanzada basada en redes neuronales diseñada para optimizar tu trading en múltiples mercados. Ya sea que operes en Forex, acciones, criptomonedas, índices o XAUUSD, este potente indicador ofrece señales de compra y venta claras y no repintadas que permanecen sin cambios, permitiéndote tomar decisiones seguras en tiempo real. El Neural FX Indicator está disponible exclusivamente para MetaTrader
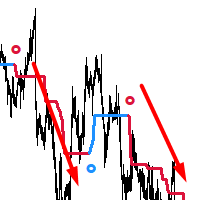
AdaptiveTrendHunter - Indicador de Detección Adaptativa de Tendencias
Características principales: Identificación sencilla de tendencias mediante códigos de color (azul para tendencias alcistas, rojo para tendencias bajistas) Señales claras de entrada marcadas con flechas Ajuste inteligente a la volatilidad del mercado Configuración personalizable de confirmación de tendencia Alertas opcionales para nuevas señales de trading Cómo utilizarlo: Seguimiento de tendencias: Observe las líneas azules q

Smart Volume Box is designed to give MetaTrader users a powerful, analytical tool for uncovering the hidden dynamics in the market. This precision-built tool, complete with user-friendly settings, integrates essential volume insights and advanced features like Volume Profile, VWAP (Volume Weighted Average Price), and Point of Control (POC) levels. Unlike typical indicators, Smart Volume Box doesn’t provide specific trade signals but instead offers a clearer perspective on market trends, makin

El indicador de riesgo de tendencia PRT encuentra partes de tendencia del movimiento de precios e indica la presencia de la tendencia mediante un valor en el buffer. Puede utilizarse para operaciones planas para deshabilitar las operaciones cuando existe la posibilidad de que el precio salga del canal (recomendado para D1) en el que se realizan las operaciones.
Tiene dos parámetros de entrada:
• Rango de bandas: rango de cálculo de bandas • Desviación: valor de desviación (el ancho del canal

Gold XAUUSD Scalping Indicator The Gold XAUUSD Scalping Indicator is a powerful trend-following tool crafted for traders who specialize in scalping. This indicator is optimized for the M5 timeframe , ensuring precise signals, but it is also versatile enough to be used on M1 and M15 charts to suit various trading strategies. Key Features Trend-Following Accuracy : Identifies high-probability buy and sell opportunities by analyzing trend direction effectively. Multi-Timeframe Compatibility : Best
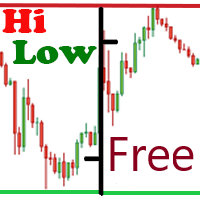
The free version of the Hi Low Last Day indicator . The Hi Low Levels Last Day indicator shows the high and low of the last trading day . The ability to change the color of the lines is available . Try the full version of the Hi Low Last Day indicator , in which additional indicator features are available : Displaying the minimum and maximum of the second last day Displaying the minimum and maximum of the previous week Sound alert when crossing max . and min . levels Selecting an arbitrary audio
FREE

Makuchaku Super Order Block
Introducing the "Makuchaku Super Order Block" – an all-in-one, powerhouse trading tool that combines the market’s most effective indicators in one, intuitive interface. This is more than just an indicator; it's a comprehensive market intelligence solution. Engineered for peak performance and precision, OBFVG is the best indicator of 2024 and a must-have for every serious trader. Let's dive into the key features of this indicator and how each can enhance your trading

Introducing the Fair Value Gap Indicator : A Simple and Effective Trading Tool The Fair Value Gap Indicator is designed to help traders easily identify and utilize Fair Value Gaps (FVGs) in their trading strategies. FVGs highlight price imbalances that the market often revisits, offering potential trade entry or exit opportunities. Whether you're a beginner or an experienced trader, this indicator simplifies the process of spotting these valuable zones, allowing you to trade with clarity and co
FREE
El Mercado MetaTrader es la única tienda donde se puede descargar la versión demo de un robot comercial y ponerla a prueba, e incluso optimizarla según los datos históricos.
Lea la descripción y los comentarios de los compradores sobre el producto que le interese, descárguelo directamente al terminal y compruebe cómo testar el robot comercial antes de la compra. Sólo con nosotros podrá hacerse una idea sobre el programa, sin pagar por ello.
Está perdiendo oportunidades comerciales:
- Aplicaciones de trading gratuitas
- 8 000+ señales para copiar
- Noticias económicas para analizar los mercados financieros
Registro
Entrada
Si no tiene cuenta de usuario, regístrese
Para iniciar sesión y usar el sitio web MQL5.com es necesario permitir el uso de Сookies.
Por favor, active este ajuste en su navegador, de lo contrario, no podrá iniciar sesión.