MetaTrader 5용 새 기술 지표 - 14
MLD RSI MT5: 사용자 지정 알림으로 RSI의 잠재력을 최대한 활용하세요 소개
MLD RSI 지표는 MetaTrader 5용으로 개발된 강력한 도구로, 전통적인 RSI(상대 강도 지수)의 기능을 사용자 지정 경고와 트렌드 확인 기능과 결합합니다. 이 지표는 모든 수준의 트레이더가 사용할 수 있으며, 외환, 주식, 암호화폐, 합성 지수 등 다양한 시장에 적용할 수 있습니다. RSI란 무엇인가요?
RSI(상대 강도 지수)는 가격의 모멘텀을 0에서 100 사이의 값으로 나타내는 기술적 지표입니다. 70 이상의 값은 과매수 상태를 나타냅니다. 30 이하의 값은 과매도 상태를 나타냅니다. 그러나 강한 트렌드가 발생하는 시장에서는 기존 RSI 신호가 오히려 혼란을 줄 수 있습니다. MLD RSI는 이러한 신호를 보다 효과적으로 해석하여 잘못된 신호를 피하고 최적의 진입점을 찾도록 돕습니다. MLD RSI MT5의 주요 기능과 이점 중요 RSI 레벨에 대한 사용자 지정 알림 : 과매수
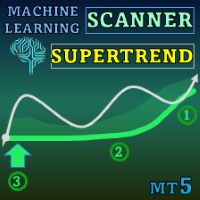
Special offer : ALL TOOLS , just $35 each! New tools will be $30 for the first week or the first 3 purchases ! Trading Tools Channel on MQL5 : Join my MQL5 channel to update the latest news from me 시장 변화에 원활하게 적응하도록 설계된 첨단 지표 Machine Learning Adaptive SuperTrend 로 고급 머신러닝의 강력한 기능을 활용해 보세요. k-평균 군집화를 SuperTrend 방법론과 결합하여, 이 지표는 정확한 트렌드 식별과 변동성 평가를 가능하게 하며, 역동적인 시장에서 트레이더에게 소중한 이점을 제공합니다. MT4 버전 더 보기: Machine Learning Adaptive SuperTrend MT4 다른 제품 보기: 모든 제품 머신러닝과 적응형 SuperTrend의
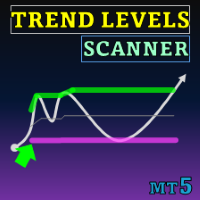
Special offer : ALL TOOLS , just $35 each! New tools will be $30 for the first week or the first 3 purchases ! Trading Tools Channel on MQL5 : Join my MQL5 channel to update the latest news from me 트렌드 레벨 (Trend Levels) 인디케이터는 시장 움직임 중 중요한 트렌드 레벨 — 최고, 중간, 최저 — 을 정확히 식별하도록 세심하게 설계되었습니다. 사용자 정의 가능한 회귀 기간 동안의 최고, 최저, 중간값에 기반한 실시간 계산을 통해 이 도구는 트레이더에게 진행 중인 트렌드의 역학 및 강도에 대한 구조적인 관점을 제공하여 정밀하고 정보에 기반한 거래 결정을 내리는 데 도움을 줍니다. MT4 버전 더 보기: Trend Levels MT4 다른 제품 보기: 모든 제품 트렌드 레벨 인디케이터의

피보나치의 힘을 해방하세요! Adaptive Fibonacci Trend Ribbon (AFTR)! 거래 전략을 혁신할 준비가 되셨나요? AFTR은 단순한 인디케이터가 아닙니다. 트렌드를 포착하고, 반전을 분석하며 탁월한 명확성으로 정밀한 결정을 내릴 수 있는 궁극의 도구입니다. 강력한 피보나치 수열과 고급 이동 평균을 결합하여 정확성과 유연성을 요구하는 트레이더를 위해 설계되었습니다. 당신을 돋보이게 하는 주요 기능: 피보나치 정밀도를 갖춘 다중 이동 평균 직관적인 트렌드 감지 역동적인 컬러 트렌드 영역 모든 시장 상황에 맞게 완벽히 커스터마이징 가능 트렌드 리본은 이동 평균 사이의 공간을 채우며, 트렌드 강도에 따라 색상이 변경됩니다. 주요 수준과 반전 포인트를 쉽게 파악하고 자신 있게 거래 기회를 포착할 수 있는 시각적 확인을 제공합니다. 거래를 향상시키는 통찰력: 피보나치 기반의 시장 통달. 자신 있게 트렌드와 반전을 식별하세요. 직관적이고 빠른 의사 결정. AFTR로 거

SS7Trader의 Neural FX Indicator 로 AI의 강력함을 경험하세요. 이 고급 신경망 기반 도구는 다양한 시장에서의 거래를 최적화하도록 설계되었습니다. 외환(Forex), 주식, 암호화폐, 지수, XAUUSD(금) 등 어떤 시장에서 거래하든, 이 강력한 지표는 변경되지 않는 안정적인 매수 및 매도 신호를 제공하여 실시간으로 자신감 있는 결정을 내릴 수 있도록 지원합니다. Neural FX Indicator 는 MetaTrader 5(MT5)에서만 사용할 수 있으며, 세계에서 가장 신뢰받는 거래 플랫폼 중 하나와 완벽히 호환됩니다. 모든 시간 프레임을 지원하며 다양한 거래 스타일에 원활하게 적응해 어떠한 시장 상황에서도 성공할 수 있는 유연성을 제공합니다. 주요 특징: 다중 시장 호환성: 외환, 주식, 암호화폐, 지수, XAUUSD 등에서 작동. 비재도색 기술: 안정적이고 신뢰할 수 있는 신호를 제공하여 정확한 결정을 지원. AI 기반: 첨단 신경망 알고리즘으로 높은
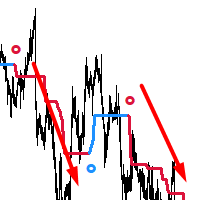
AdaptiveTrendHunter - 적응형 트렌드 감지 지표
주요 특징: 색상 코딩을 통한 쉬운 트렌드 식별 (상승 트렌드는 파란색, 하락 트렌드는 빨간색) 화살표로 표시되는 명확한 진입 신호 시장 변동성에 대한 스마트한 적응 사용자 정의 가능한 트렌드 확인 설정 새로운 거래 신호에 대한 선택적 알림 사용 방법: 트렌드 추종: 잠재적 상승 트렌드를 나타내는 파란색 라인 관찰 잠재적 하락 트렌드를 나타내는 빨간색 라인 관찰 트렌드 반전 확인을 위한 색상 변화 대기 진입 신호: 위쪽 화살표는 매수하기 좋은 시점을 제시 아래쪽 화살표는 매도하기 좋은 시점을 제시 항상 화살표가 주요 트렌드 라인의 색상과 일치하는지 확인 거래 관리: 트렌드 라인을 동적 지지/저항 레벨로 활용 잠재적 트렌드 반전을 위한 색상 변화 모니터링 자체 청산 전략 및 리스크 관리 규칙과 결합하여 사용 중요 참고사항: 신호는 현재 봉에서 형성되며, 봉이 발달함에 따라 재그림이 될 수 있습니다 항상 적절한 리스크 관리
추세 위험 지표 PRT는 가격 움직임의 유행 부분을 찾아 버퍼의 값으로 추세 존재를 나타냅니다. 가격이 채널에서 벗어날 가능성이 있을 때 거래를 비활성화하기 위해 플랫 거래에 사용할 수 있습니다(D1에 권장). 이 거래에서는 거래가 수행됩니다.
두 가지 입력 매개변수가 있습니다.
• 밴드 범위 - 밴드 계산 범위 • 편차 - 편차 값(허용된 채널의 너비) Trend Risk Indicator PRT finds trendy parts of the price movement and indicates the trend presence by a value in the buffer. Can be used for flat trading to disable trading when there is a possibility of price exiting the channel (recommended for D1) , in which trades are performed. It has two
ADX-Based Candle Color Indicator for MT5
Description: Enhance your trading experience with the ADX-Based Candle Color Indicator for MT5! This powerful tool colors candlesticks based on the Average Directional Index (ADX) indicator, helping you quickly assess market strength and direction at a glance.
Key Features: - Color-Coded Candles: - Green (Bullish) when D+ > D-. - Red (Bearish) when D- > D+. - Intensity Mapping: The color intensity reflects the ADX value—stronger col
FREE
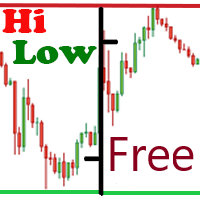
The free version of the Hi Low Last Day indicator . The Hi Low Levels Last Day indicator shows the high and low of the last trading day . The ability to change the color of the lines is available . Try the full version of the Hi Low Last Day indicator , in which additional indicator features are available : Displaying the minimum and maximum of the second last day Displaying the minimum and maximum of the previous week Sound alert when crossing max . and min . levels Selecting an arbitrary audio
FREE

Makuchaku Super Order Block
Introducing the "Makuchaku Super Order Block" – an all-in-one, powerhouse trading tool that combines the market’s most effective indicators in one, intuitive interface. This is more than just an indicator; it's a comprehensive market intelligence solution. Engineered for peak performance and precision, OBFVG is the best indicator of 2024 and a must-have for every serious trader. Let's dive into the key features of this indicator and how each can enhance your trading
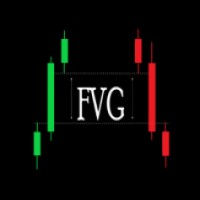
Introducing the Fair Value Gap Indicator : A Simple and Effective Trading Tool The Fair Value Gap Indicator is designed to help traders easily identify and utilize Fair Value Gaps (FVGs) in their trading strategies. FVGs highlight price imbalances that the market often revisits, offering potential trade entry or exit opportunities. Whether you're a beginner or an experienced trader, this indicator simplifies the process of spotting these valuable zones, allowing you to trade with clarity and co
FREE
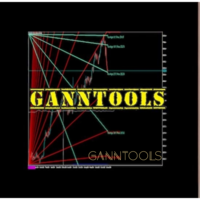
GannTools Indicator
The GannTools Indicator is a powerful trading tool inspired by W.D. Gann's strategies. This indicator provides traders with dynamic support and resistance levels, trend analysis, and key price patterns using Gann angles and cycles. Key Features: Customizable Gann Fans, Angles, and Cycles for precise market analysis. Automatic identification of key price levels and trend directions. Works on all timeframes and instruments for flexible trading strategies. Integrated visualiza
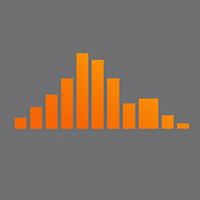
The indicator shows the price change of the current or any other instrument since the beginning of the day / week . You can choose to display it in points or as a percentage relative to the opening price of the beginning of the period . The indicator is made in the form of a histogram with two colors , for ascending and descending price changes . You can also choose which tool to show the data for . The data will be displayed on the current chart .
FREE

This indicate will set the global variable GlobalVariableSet(" G_News ",1); when there is news. You can add this indicator to any char, it is not necessary that the char has your EA
Just add this code to your EA ( file mq5) to identify when there is news
int news=0; if(GlobalVariableGet("G_News")==1) {news=1;}
This is the identification code when there is news, how to handle it is up to you You can customize the pause time, customize the country you want to get news from...
FREE

Description :
The "MVRV by Age Approximation" indicator offers traders a unique on-chart visualization of the Market Value to Realized Value (MVRV) ratio, segmented by holding periods, or "age cohorts." This indicator is designed to approximate the MVRV metric by categorizing assets into short-term, mid-term, and long-term holders, providing a clear view of the relative unrealized profit or loss across different holding periods. Using simple moving averages over adjustable periods, this indicato

Fibo Daily Channel Indicator The Indicator is a powerful tool for traders, providing precise daily support and resistance levels based on Fibonacci retracement and extension calculations. This indicator automatically draws key pivot points (PP, R1, R2, S1, S2) as well as additional extension levels (R3, R4, S3, S4), helping traders identify potential reversal and breakout zones with ease. It includes customizable alerts and push notifications, allowing traders to receive updates whenever the pr

Sliding Average with Bollinger Bands General Information: The indicator combines two popular technical analysis tools: Moving Averages (Simple Moving Average and Smoothed Moving Average) to assess the trend. Bollinger Bands to analyze market volatility. Main Components: SMA (Simple Moving Average): The simple moving average is calculated as the arithmetic mean of prices over a specified period. Formula: = (1 + 2 + ⋯ + ) / Where: 1, 2, …, are the closing prices for p
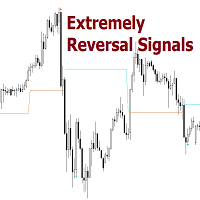
Reversal Signals [AlgoAlpha] – Master Market Reversals with Precision!
Elevate your trading strategy with the Reversal Signals indicator by AlgoAlpha. This advanced tool is designed to pinpoint potential bullish and bearish reversals by analyzing price action and, optionally, volume confirmations. It seamlessly combines reversal detection with trend analysis, giving you a comprehensive view of market dynamics to make informed trading decisions.
Key Features
Price Action Reve
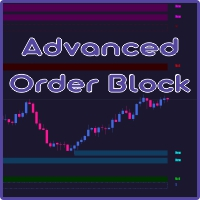
A2 Trade proudly present to you, Advanced and FULLY CUSTOMIZABLE Order Block to assist the traders for find the Supply and Demand or Support and Resistance Levels. The traders could customize of each areas to make it different from another areas, and the traders also can set the Supply and Demand or Support and Resistance timeframes themselves. hope you'll enjoy it.

GTrendDetector Индикатор GTrendDetector предоставляет сигналы на покупку и продажу. Индикатор рассчитывает границы канала по рекурсивному методу, а также среднее, полученное из этих границ. Выход цены закрытия за границы канала генерирует сигналы на покупку/продажу. Индикатор рисуте границы канала, окрашивает область между средней и ценой закрытия, и выводит на график значки в местах смены тенденции. Входные параметры: Source - тип цены для расчета границ канала. Length - количество баров для ра
Here I bring you the Binary Boss OT1.0 MT5 indicator that provides signals for trading the rise or fall, higher or lower, call or put and more different options on the binary brokers.
This arrow indicator uses the technical trading rules, the candle patterns .The arrow appears at the opening of the candle for quick entries and the indicator provides multiple signals a day for more chances.
Instructions: On Deriv or Iqoptions, set time duration between 40 sec and 5 minutes.(According to your
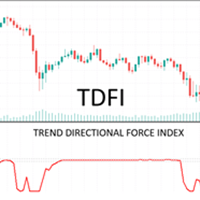
Trade Directional Force Index (TDFI) v1.0 One of the greatest challenges for trend traders lies in effectively timing entries and exits during periods of consolidation. These phases are often characterized by lower-than-average trading volume, making them tricky to navigate. In markets where volume data is unavailable, such as forex, the Trend Direction and Force Index (TDFI) serves as a reliable substitute. This is because volatility and volume are closely intertwined. What if you had an indica

The Optimized MACD Divergence indicator is a powerful tool designed to identify potential trading opportunities by detecting divergences between price action and the MACD indicator. It combines classic divergence analysis with candlestick pattern recognition and volume filtering to provide more accurate and reliable signals. How it Works The indicator operates on the following principles: MACD Calculation: It calculates the MACD indicator using user-defined parameters for fast EMA, slow EMA,

Golden Trend indicator is The best indicator for predicting trend movement this indicator never lags and never repaints and never back paints and give arrow buy and sell before the candle appear and it will help you and will make your trading decisions clearer its work on all currencies and gold and crypto and all time frame This unique indicator uses very secret algorithms to catch the trends, so you can trade using this indicator and see the trend clear on charts manual guide and
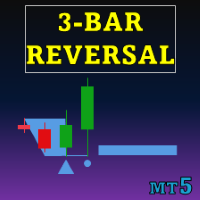
Special offer : ALL TOOLS , just $35 each! New tools will be $30 for the first week or the first 3 purchases ! Trading Tools Channel on MQL5 : Join my MQL5 channel to update the latest news from me 삼중 반전 패턴 지표 는 트레이더들에게 강력한 도구를 제공하여 가격 차트에 삼중 반전 패턴을 자동으로 식별하고 강조 표시합니다. 이 지표는 잠재적인 트렌드 반전을 탐지하는 데 유용하며, 통합된 트렌드 지표를 통해 신호 정확도를 향상시킬 수 있습니다. MT4 버전 보기: Three Bar Reversal Pattern MT4 다른 제품 보기: 모든 제품 주요 특징 자동 패턴 감지: 이 지표는 삼중 반전 패턴을 스캔하며, 명확한 시각적 신호로 표시하여 잠재적인 트렌드 반전 포인트를 인식하는 데 도움을 줍니다.

Berma Bands(BBs) 지표는 시장 동향을 파악하고 이를 활용하려는 트레이더에게 귀중한 도구입니다. 가격과 BBs 간의 관계를 분석함으로써 트레이더는 시장이 추세 단계인지 범위 단계인지를 분별할 수 있습니다. 자세한 내용을 알아보려면 [ Berma Home Blog ]를 방문하세요. 버마 밴드는 세 개의 뚜렷한 선으로 구성되어 있습니다. 어퍼 버마 밴드, 미들 버마 밴드, 로어 버마 밴드입니다. 이 선들은 가격 주위에 그려져 전체 추세에 대한 가격 움직임을 시각적으로 표현합니다. 이 밴드들 사이의 거리는 변동성과 잠재적인 추세 반전에 대한 통찰력을 제공할 수 있습니다.
버마 밴드 라인이 각각에서 분리될 때, 그것은 종종 시장이 횡보 또는 범위 이동 기간에 접어들고 있음을 시사합니다. 이는 명확한 방향 편향이 없음을 나타냅니다. 트레이더는 이러한 기간 동안 추세를 파악하기 어려울 수 있으며 더 명확한 추세가 나타날 때까지 기다릴 수 있습니다.
버마 밴드 라인이 단일 라인으로

ProEngulfing 무료 버전은 QualifiedEngulfing으로, 하루에 하나의 신호로 제한되며 기능이 적습니다. 모든 Koala 제품에 대한 최신 정보를 확인하려면 mql5 커뮤니티에서 Koala Trading Solution 채널에 가입하세요. 가입 링크는 아래와 같습니다: https ://www .mql5 .com /en /channels /koalatradingsolution 이 제품의 MT4 버전은 아래 링크에서 다운로드 가능합니다: https ://www .mql5 .com /en /market /product /52023 ProEngulfing 소개 – MT4용 전문가 수준의 Engulf 패턴 지표
정확성을 극대화한 ProEngulfing을 소개합니다. 이 최신 지표는 포렉스 시장에서 신뢰할 수 있는 Engulf 패턴을 식별하고 강조하는 데 중점을 둔 제품입니다. MetaTrader 4에 맞게 개발된 ProEngulfing은 신뢰도 높은 신호를 제공하기 위해
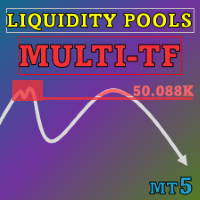
Special offer : ALL TOOLS , just $35 each! New tools will be $30 for the first week or the first 3 purchases ! Trading Tools Channel on MQL5 : Join my MQL5 channel to update the latest news from me Liquidity Pools 지표는 고급 도구로, 빈번하게 윅이 닿는 고점 및 저점을 분석하고 각 구역에서 거래된 재방문 횟수와 거래량을 분석하여 잠재적인 유동성 구역을 차트에 식별하고 표시합니다. 이 도구는 거래자에게 유동성이 쌓이는 시장 역학에 대한 종합적인 뷰를 제공하여 잠재적인 전환점을 예측하고 주요 지지 및 저항 수준을 식별하는 데 도움을 줍니다. MT4 버전 보기: Liquidity Pools MT4 다른 제품 보기: 모든 제품 주요 특징 및 혜택 1. 정확한 유동성 구역 식별 고영향 구역 강조

이 Gann Candles 지표는 W.D. Gann의 여러 전략을 단일 거래 지표로 통합합니다. Gann은 1878년부터 1955년까지 살았던 전설적인 거래자였습니다. 그는 면화 농부로 시작하여 1902년 24세의 나이에 거래를 시작했습니다. 그의 전략에는 기하학, 천문학, 점성술, 시간 주기 및 고대 수학이 포함되었습니다. Gann은 여러 권의 책을 썼지만 그 중 어느 책에도 그의 모든 전략이 포함되어 있지 않아 이를 배우려면 수년간 공부해야 합니다. 그는 또한 성경과 고대 그리스 및 이집트 문화에 대한 독실한 학자였으며 스코틀랜드 의례의 33도 프리메이슨이었습니다.
저는 Gann의 전략 중 최고라고 믿는 것을 단순화하기 위해 이러한 전략을 동기화되거나 동기화되지 않을 때 기존 가격 막대에 색상을 지정하는 하나의 지표로 줄였습니다. 이렇게 하면 잠재적인 차트 혼란이 크게 줄어듭니다. 또한 입력 설정의 수를 두 가지로 줄였습니다.
FastFilter, 및 SlowFilter F
FREE
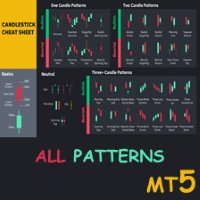
Special offer : ALL TOOLS , just $35 each! New tools will be $30 for the first week or the first 3 purchases ! Trading Tools Channel on MQL5 : Join my MQL5 channel to update the latest news from me 캔들스틱 패턴을 마스터하는 것은 시장에서 신중한 결정을 내리고자 하는 모든 트레이더에게 필수입니다. All Candlestick Patterns 를 소개합니다 – 기술 분석을 강화하고 시장 동향 및 잠재적인 반전에 대한 강력한 인사이트를 제공하도록 설계된 포괄적인 도구입니다. 이 종합 솔루션은 주요한 모든 캔들스틱 패턴을 식별하여 가격 움직임을 예측하고 전략을 정밀하게 조정하는 것을 더 쉽게 만듭니다. 캔들스틱 패턴 및 의미를 확인하십시오: All Candlestick Patterns - Meaning and
TW Volume Signal Pro MT5 는 고급 AI 기술과 독점 스마트 알고리즘을 활용하여 금 시장에서 더 큰 자신감을 가지고 거래할 수 있게 해주며, 독특하고 비할 데 없는 거래 경험을 제공합니다. 금 시장에서 높은 정확성과 뛰어난 거래 신호를 찾고 계신가요? TW Volume Signal Pro MT5로 전문 트레이더가 되어 금 시장에서 큰 성공을 거둘 수 있습니다. 지금 무료로 사용해 보세요!
TW Volume Signal Pro MT5의 주요 특징:
정확하고 신뢰할 수 있는 신호: 신호, 이익 실현(TP) 및 손절매(SL)는 전혀 변경되지 않아 완전히 신뢰할 수 있습니다.
정확한 추세 탐지: TW Volume Signal Pro MT5는 거래량을 분석하여 시장 추세 변화 를 정확하게 식별하고 최적의 타이밍에 거래에 진입할 수 있도록 도와줍니다.
스마트 알림:

Imbalance DOM Crypto: 암호화폐 주문서의 불균형으로 거래를 강화하세요 작은 가격 변동의 기회
Imbalance DOM Crypto는 암호화폐의 주문 흐름을 다루는 분석가에게 필수적인 도구입니다. 스캘퍼에게 완벽하게 적합하며, 작은 가격 변동을 높은 정확도로 활용하고자 하는 트레이더를 위해 개발되었습니다. 고급 계산을 통해 이 지표는 주문서의 불균형을 식별하고 빠른 진입 및 탈출을 위한 귀중한 신호를 제공합니다. 중요: Binance 데이터 수집 스크립트 및 설정
Imbalance DOM Crypto가 제대로 작동하려면 Book Data Binance 스크립트를 로드해야 합니다. 이 스크립트는 Binance에서 직접 주문서 데이터를 가져와 지표가 실시간으로 구매 및 판매 정보를 액세스하여 정확한 계산을 생성할 수 있도록 합니다. 스크립트가 활성화되어 있고 올바르게 구성되어 있는지 확인하여 지표가 실시간으로 주문서의 불균형을 캡처할 수 있도록 해야

Times and Sales Crypto: Times and Sales로 암호화폐 거래를 강화하세요 작은 가격 변동을 정밀하게 활용 Times and Sales Crypto 는 암호화폐의 주문 흐름을 거래하는 데 필수적인 도구입니다. 스캘퍼에게 적합하며, 작은 가격 변동을 높은 정확도로 활용하고자 하는 트레이더를 위해 설계되었습니다. 고급 계산을 통해 이 지표는 times and sales 데이터를 활용하여 빠른 진입과 퇴장을 위한 귀중한 신호를 제공합니다. 중요: Binance 데이터 수집 스크립트 설정 Times and Sales Crypto 가 정상적으로 작동하려면 Volume Flow Binance 스크립트를 로드해야 합니다. 이 스크립트는 Binance에서 times and sales 데이터를 직접 수집하여 지표가 실시간 거래 데이터를 가져와 정확한 계산을 할 수 있도록 합니다. 스크립트가 활성화되어 있고 올바르게 설정되었는지 확인하여 지표가 실시간 거래

ICT Liquidity Levels 는 정밀한 거래를 위해 기관 수준의 가격대를 사용하는 트레이더를 위해 설계된 고급 지표입니다. 이 지표는 중요한 일일 및 세션별 가격 수준을 표시하여 ICT Silver Bullet 전략에 맞춘 명확하고 구조적인 시각을 제공합니다. 특징: 포괄적인 주요 수준: 지표는 전략적 거래를 지원하는 중요한 가격 수준을 표시하며, 다음을 포함합니다: 일일 최고 및 최저가 (현재 및 이전 일자) 런던 세션의 최고 및 최저가 (현재 및 이전 일자) 뉴욕 오전 및 오후 세션의 최고 및 최저가 (현재 및 이전 일자) 뉴욕 자정 개장가 ICT Silver Bullet 기간 내에서의 목표 표시: 주요 수준은 Silver Bullet 기간 동안에만 표시되어 차트의 복잡성을 줄이며, 트레이더가 목표 수준을 명확하게 확장할 수 있도록 합니다. 프리미엄 및 할인 구역: 각 세션은 뉴욕 자정 개장가를 기준으로 프리미엄 및 할인 구역을 색상으로 구분하여 높은 확률의

지표에 대하여 이 지표는 금융 상품의 종가에 대한 몬테카를로 시뮬레이션을 기반으로 합니다. 몬테카를로는 통계적 기법으로, 이전에 관찰된 결과에 기반한 랜덤 숫자를 사용하여 다양한 결과가 나올 확률을 모델링하는 데 사용됩니다.
어떻게 작동하나요? 이 지표는 과거 데이터를 바탕으로 시간에 따른 랜덤 가격 변화를 모델링하여 특정 종목에 대한 여러 가격 시나리오를 생성합니다. 각 시뮬레이션은 종가 변동을 반영하기 위해 랜덤 변수를 사용하여, 주어진 기간 동안 미래 시장 움직임을 효과적으로 모방합니다.
몬테카를로 시뮬레이션의 장점 - 몬테카를로 시뮬레이션은 다양한 미래 시나리오에 대한 테스트를 통해 여러 거래 전략의 리스크를 분석하는 데 도움을 줍니다. - 희귀한 극단적 사건(꼬리 위험)을 포함하여 다양한 시장 상황에서 전략의 성과를 확인할 수 있습니다. - 단일 예측에 의존하지 않고, 몬테카를로는 관련 확률과 함께 잠재적 결과의 범위를 제공합니다. 이는 수익 또는 손실 가능성을 이해하는

Nro Lines 지표는 선 플로팅을 통해 주요 가격 수준의 정확하고 동적인 시각화를 제공합니다.
이 기능을 통해 트레이더는 최적화된 기술 분석을 수행할 수 있으며, 이는 효과적인 거래 전략 개발과 시장 진입 및 퇴출에 대한 확실한 결정을 내리는 데 필수적입니다.
주요 기능:
- 시장 변화에 따라 조정되는 동적 참조선으로, 트레이더에게 업데이트되고 관련성 있는 시각적 표현을 제공합니다.
- 관련 수준의 자동 계산으로 사용자가 차트 해석에만 집중할 수 있게 합니다.
- 여러 글로벌 시장과의 호환성으로, 전 세계 다양한 금융 시장에서 활동하는 트레이더를 위한 다용도 도구가 됩니다.
- 다양한 시장 세션에 대한 일정 사용자 지정 기능으로, 다양한 시간대에서 운영하거나 특정 거래 시간을 가진 시장을 전문으로 하는 트레이더에게 중요합니다.
- 색상, 스타일, 선의 두께를 사용자 지정할 수 있어 각 트레이더가 자신의 시각적 선호도와 분석 요구에

The indicator colors the candles relative to their volume delta. The calculation of the candles delta is based on the tick history or on the deals tape history (see below for a description of the input variable "Volumes").
Coloring is performed by two parameters : by delta sign, as candle color, by delta value, as candle color contrast against chart window background color.
In addition to coloring the candles, the indicator also displays the delta profile on the interval specified by the user

The Market Sessions indicator is a popular tool among forex and stock traders for visually representing global trading sessions on a price chart. It highlights the time periods for major trading sessions — such as the Asian (Tokyo) , European (London) , and American (New York) sessions — directly on the chart. This helps traders identify when markets open and close, allowing for better decision-making based on session-specific trading behavior. - Asian Session (Default: 00:00-09:00) - London Se
FREE

G-Labs Market Maker Dashboard - Exclusive Seasonal Offer Elevate your trading with the original G-Labs Market Maker Dashboard, available for a limited time at just $70 USD. Ideal for starter traders, this dashboard has been enhanced with new features and now includes a comprehensive training video. This indicator is for people trading the market makers method and is the entry level dashboard for that strategy is available for both mt4 and mt5. its a market scanner in real time showing peak forma
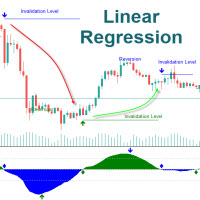
The Linear Regression Oscillator (LRO) is a technical indicator based on linear regression analysis, commonly used in financial markets to assess the momentum and direction of price trends. It measures the distance between the current price and the value predicted by a linear regression line, which is essentially the best-fit line over a specified period. Here’s a breakdown of how it works and its components: Key Components of the Linear Regression Oscillator Linear Regression Line (Best-Fit Lin
20 Sources, Non-Repainting, Fast Performance
Introducing the All-In-One Supertrend: my first attempt at creating the ultimate trading tool. Designed with flexibility and customization in mind, each source is fully adjustable and integrates seamlessly with the others, allowing you to craft a strategy that fits your unique trading style, without compromising on speed or performance.
General settings (applicable across all sources):
ATR Period ATR Multiplier Change ATR Calculation [when switched
Candlestick coloring indicator based on the crossing of two moving averages. The crossing of the fast average with the slow average defines a possible beginning of the trend and the indicator will color the candles according to the trend, high or low.
It is possible to define the period, calculation method, offset, and price of the two moving averages, which makes the indicator very customizable.
FREE

Hurst Cycles Diamonds Description This indicator is an alternative version inspired by the pioneering work of David Hickson and the Hurst Cycles Notes indicator developed by Grafton. The main objective is to provide a clear and intuitive view of the Hurst cycles. Credits Original Concept : David Hickson - Hurst Cycles Theory Inspiration : Grafton - Hurst Diamond Notation Pivots Alternative Version : Fillipe dos Santos Main Features Identifies and displays pivots in multiple time cycles Visual t

Please Good Review on this indicator, and i will maybe produce more indicators, Coming soon, EA base on this indicators
Linear Weighted Moving Average with HLCC applied price, and Bollinger bands with LWMA as applied price. Interesing Buy and Sell arrow based on this indicator , non Lag indicator as arrow will appear 1 candle after crossed...............
FREE

The First Dawn indicator uses a unique mechanism to search and plot signals.
This keeps searching for signals, making it a great indicator for scaping and identification of changes in direction, swing trading and trend trading.
The First Dawn helps you get early signals. The backtest gives the true picture of how the indicator works with real/demo accounts.
Although this is a tiny indicator it is packed with advantageous settings that will help you whether you desire to: Snap the Peaks a

If you find this indicator useful, please take a moment to leave a review and a comment! Your feedback helps improve the product and keeps it free for everyone. Thank you! This code is a custom indicator designed for MetaTrader 5 that visually displays the main trading sessions (Sydney, Tokyo, London, and New York) on the chart. Here's a comprehensive explanation of its functionality: 1. Main Objectives of the Indicator Display Trading Sessions : The indicator marks and displays the time period
FREE
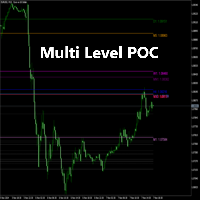
Detailed Description:
The Multi Level POC Indicator is designed for traders who want to identify critical price levels based on volume analysis across multiple timeframes. Key Features:
Multi-Timeframe POC Calculation: Automatically calculates and displays the POC from multiple timeframes, including M1, M5, H1, D1, and more. Intermediate Levels Display: In addition to the primary POC levels, the indicator also plots intermediate levels based on the POC. Custom Precision and Depth Settings: Us
FREE
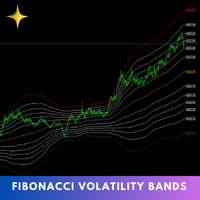
The Fibonacci Volatility Bands indicator is a refined tool designed to enhance your market analysis by integrating Fibonacci retracements with the Bollinger Bands concept. This indicator visually highlights potential areas of support and resistance, providing traders with a clearer understanding of price fluctuations and volatility. MT4 Version - https://www.mql5.com/en/market/product/126421/ The core of the Fibonacci Volatility Bands is built around a Volume Weighted Moving Average (VWMA) that
FREE
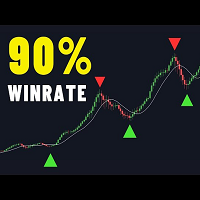
There are many linear regression indicators out there, most of them draw lines or channels, but this one actually draws a chart. This indicator also alow user show MA line on chart. So buy signal is when red candle and crossdown with MA line and vice versal. Following MA type is supported: SMA EMA RMA WMA This simple mineset but powerfull KISS - Keep it simple, stupid :D

This indicator identifies and visually displays Support and Resistance zones on a financial chart, providing traders with critical insights into market structure and potential price action areas. Here's how it operates: Key Features: Zone Identification: Detects Support Zones (price levels where buying pressure is historically strong). Detects Resistance Zones (price levels where selling pressure is historically strong). Categorizes zones into: Weak Zones Untested Zones Turncoat Zones (previousl
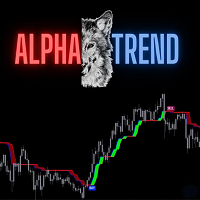
AlphaTrend is a brand new indicator which inspired by Trend Magic. In Magic Trend we had some problems, Alpha Trend tries to solve those problems such as:
1-To minimize stop losses and overcome sideways market conditions.
2-To have more accurate BUY/SELL signals during trending market conditions.
3- To have significant support and resistance levels.
4- To bring together indicators from different categories that are compatible with each other and make a meaningful combination regarding momen
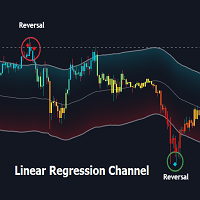
Overview:
The Linear Regression Channel Indicator is a versatile tool designed for Metatrader to help traders visualize price trends and potential reversal points. By calculating and plotting linear regression channels, bands, and future projections, this indicator provides comprehensive insights into market dynamics. It can highlight overbought and oversold conditions, identify trend direction, and offer visual cues for future price movements.
Key Features:
Linear Regression Bands: ( figur

Advanced Volume Flow Indicator A professional volume analysis tool that helps traders identify potential market reversals and trend confirmations through advanced volume flow calculations and smart filtering algorithms. Main Features Advanced volume analysis with precision filtering Real-time trade signals with price levels Smart alert system for automated trade detection Clear visual representation with color-coded volume bars Multi-timeframe optimization Professional-grade calculat
FREE

Real Spread Monitor is a powerful indicator that is designed to accurately measure and analyze real spreads, giving traders the ability to compare trading conditions of different brokers. This product is also available for MetaTrader 4 => https://www.mql5.com/en/market/product/125769 Key Features of Real Spread Monitor:
1. Two modes of operation: Write mode : In this mode the indicator collects data on real spreads of the selected trading instrument and records them in a file. The spread is r
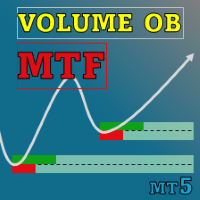
Special offer : ALL TOOLS , just $35 each! New tools will be $30 for the first week or the first 3 purchases ! Trading Tools Channel on MQL5 : Join my MQL5 channel to update the latest news from me 다중 시간 프레임의 체적 주문 블록 지표는 주요 시장 참가자들이 주문을 축적하는 중요한 가격 영역을 식별하여 시장 행동에 대한 더 깊은 통찰을 원하는 트레이더들을 위해 설계된 강력한 도구입니다. 이 영역들은 체적 주문 블록으로 알려져 있으며, 잠재적 지지 및 저항 구역으로 작용해 정보에 입각한 거래 결정에 중요한 이점을 제공합니다. MT4 버전 보기: Volumetric Order Blocks MT4 Multi Timeframe See more products at: https://www.mql5.com

The latest version of Indicator is fully integrated into an all-in-one package, including: Fair Value Gaps (FVG). See more => How to trade with FVG Implied Fair Value Gap (IFVG). See more => How to trade with IFVG OrderBlock (OB). See more => How to trade with OrderBlock The options in the settings section are relatively easy to navigate, and you can even use them right away upon activation without encountering difficulties when using the default configuration. The indicator utilizes an alg

안녕하세요 여러분 The Rangers Fx입니다 우리는 Boom 1000 Index, Boom 500 Index 및 Boom 300 Index에서 스파이크를 잡기 위한 지표를 만들었습니다. 실제로 이 지표 단어는 사용 가능한 모든 Boom과 앞으로도 계속될 다른 Boom에 대한 것입니다. 이 지표를 사용하는 방법 우선, 귀하는 귀하의 기간을 M1/M5 기간으로 설정해야 합니다. 이 지표는 언제 매수 거래를 해야 하는지, 언제 거래를 종료/청산해야 하는지(X)에 대한 경고를 보내며 거래를 개시할 때 두려워하지 마십시오. 이 표시기가 종료하라는 표시(X)를 표시하지 않는 한 손실을 입은 것입니다. 이는 귀하가 여전히 시장의 올바른 방향에 있다는 것을 의미합니다. 이 표시기는 다시 칠하지 않고 튜토리얼에서 본 것만 표시합니다. Mql5 또는 whatsApp에서 이 표시기를 자유롭게 테스트하여 얻거나 간단히 mql5에서 구매하세요. 왓츠앱 +27786420491 annyeonghasey

안녕하세요 여러분, 저는 The Rangers Fx입니다. 우리는 Crash 1000 Index, Crash 500 Index 및 Crash 300 Index에서 실제로 사용 가능한 모든 충돌과 앞으로도 계속될 다른 충돌에 대한 이 표시기 단어를 포착하기 위한 표시기를 만들었습니다. 이 지표를 사용하는 방법 우선 기간을 M1/M5 기간으로 설정해야 합니다. 이 지표는 매도 거래를 수행할 시기와 거래를 청산/청산할 시기(X)에 대한 경고를 보내며, 언제 두려워하지 마십시오. 당신은 거래를 개시하고 이 표시기가 종료할 기호(X)를 표시하지 않는 한 손실을 입게 됩니다. 이는 당신이 여전히 시장의 올바른 방향에 있다는 것을 의미합니다. 이 표시기는 다시 칠하지 않고 당신이 보는 것만 보여줄 것입니다. 튜토리얼에서는 더 이상 Mql5에서 이 표시기를 테스트하거나 whatsApp에서 이 표시기를 얻거나 간단히 mql5에서 구매할 수 있습니다. annyeonghaseyo yeoleobun,
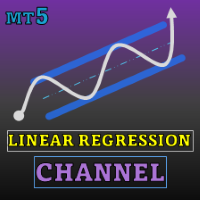
Special offer : ALL TOOLS , just $35 each! New tools will be $30 for the first week or the first 3 purchases ! Trading Tools Channel on MQL5 : Join my MQL5 channel to update the latest news from me 선형 회귀 채널 지표 는 가격 추세와 잠재적인 반전 지점을 포착하는 데 도움을 주는 강력한 기술적 분석 도구입니다. 선형 회귀 채널, 밴드 및 미래 예측을 계산하여 시장 역학에 대한 깊은 통찰력을 제공합니다. 이 지표는 과매수 및 과매도 상태, 추세 방향을 식별하는 데 도움을 주며, 향후 가격 움직임에 대한 명확한 시각적 신호를 제공합니다. MT4 버전은 여기를 참조하십시오: Linear Regression Channel MT4 See more products at: https://www.mql5.co
OVERVIEW
A Lorentzian Distance Classifier (LDC) is a Machine Learning classification algorithm capable of categorizing historical data from a multi-dimensional feature space. This indicator demonstrates how Lorentzian Classification can also be used to predict the direction of future price movements when used as the distance metric for a novel implementation of an Approximate Nearest Neighbors (ANN) algorithm. This indicator provide signal as buffer, so very easy for create EA from this indi
The Supertrend Indicator is a powerful trend-following tool designed for traders who seek clarity in identifying bullish and bearish market trends. Built for MQL5, it provides real-time analysis and helps users make informed trading decisions by highlighting entry and exit points. With customizable settings, this indicator adapts to various market conditions, ensuring flexibility and accuracy in trading strategies.

Overview The Smart Money Structure Markup Indicator for MetaTrader 5 is a powerful tool designed to help traders identify key market structures based on popular Smart Money Concepts (SMC) strategies. This indicator detects micro-market structures, providing insights into price movements and potential trend changes. It highlights important elements such as valid Break of Structure (BOS), Change of Character (CHoCH), and Inducement (IDM), helping traders to make informed decisions. Key Features Ma
FREE

Daily VWAP Indicator (Volume Weighted Average Price) Special Deal! Leave a review and get the indicator Long & Short Cointegration Analyzer for free — just send me a message!
Description The Daily VWAP (Volume Weighted Average Price) indicator is an essential tool for traders seeking to identify the true average price of an asset throughout the day, adjusted by traded volume. Primarily used by institutional and professional traders, the daily VWAP serves as a reference point to identify the av
FREE

This indicator is based on Bollinger Bands and moving averages, and uses ADX to get the turning point of the market trend and display a sign.
It is basically intended for use with currency pairs and futures with high volatility. In our tests we use it on XAUUSD, 5m and 15m. Win rate is more than 80% with 50 pips stop loss and 50 pips gain or more.
The indicator is also a simple indicator that allows you to enable or disable alerts and change the color of the arrows from the indicator settings
FREE

Ratio Indicator - User Guide
Special Deal! Leave a review and get the indicator Long & Short Cointegration Analyzer for free — just send me a message!
This Ratio indicator between assets allows you to monitor and trade the price relationship between two assets selected by the user. It calculates the ratio between the prices of two assets, referred to as Asset1 and Asset2 (e.g., "GBPUSD" and "EURUSD"), and plots a moving average of the ratio along with Bollinger Bands . These bands are used to
FREE
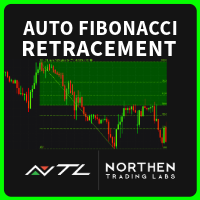
AutoFib: Advanced Fibonacci Retracement for MetaTrader 5 Automate Fibonacci Analysis for Smarter Trading Decisions AutoFib simplifies Fibonacci retracement analysis by automatically identifying key levels of support and resistance directly on your MT5 charts. Whether you're new to Fibonacci analysis or an advanced trader, AutoFib enhances your ability to identify potential reversals, continuations, and critical price levels. Key Features: Automatic Fibonacci Levels – Identify retracement and ext

This is an advanced trend indicator designed to accurately identify reversals and the beginning of trend movements. With this tool, you will be able to receive high-quality signals for entering and exiting the market, minimizing false entry points and increasing the profitability of transactions. The indicator is suitable for any assets (currency pairs, stocks, indices) and time intervals, from minute to daily charts.

# Indicador Daily High - Danilo Monteiro - MT5
## Descrição O Daily High/Low Labels é um indicador personalizado para MetaTrader 5 que exibe automaticamente as máximas e mínimas diárias no gráfico, facilitando a identificação rápida dos níveis importantes de preço. O indicador marca os preços com etiquetas e linhas horizontais, permitindo uma visualização clara dos níveis críticos do dia atual e anterior.
## Principais Características
### 1. Marcação Automática - Exibe automaticamente as máxi
FREE

This indicator will help you track performance of your trades, even scalping trades. You can use it with the Arab, and many other traders.
This indicator displays essential trading account information directly on your chart. It positions itself in one of the four corners of the screen and showcases details such as: Symbol: The symbol of the asset currently displayed on the chart. Profit/Loss: The total profit or loss in dollars for the current symbol. Pips: The total number of pips gained or
FREE

SuperTrend Indicator Code Description This code defines a custom indicator for the MetaTrader 5 platform called SuperTrend. The indicator is based on the Average True Range (ATR) to identify upward and downward trends in the market. Code Sections: Indicator Information: Defines the indicator's name, copyright, link, version, etc. Configures the indicator to be displayed in a separate window and have 9 internal buffers and 2 visible plots. Sets the properties of the plots (name, drawing type, col
FREE
트레이딩 전략과 기술 지표를 판매하기에 가장 좋은 장소가 왜 MetaTrader 마켓인지 알고 계십니까? 광고나 소프트웨어 보호가 필요 없고, 지불 문제도 없습니다. 모든 것이 MetaTrader 마켓에서 제공됩니다.
트레이딩 기회를 놓치고 있어요:
- 무료 트레이딩 앱
- 복사용 8,000 이상의 시그널
- 금융 시장 개척을 위한 경제 뉴스
등록
로그인
계정이 없으시면, 가입하십시오
MQL5.com 웹사이트에 로그인을 하기 위해 쿠키를 허용하십시오.
브라우저에서 필요한 설정을 활성화하시지 않으면, 로그인할 수 없습니다.