适用于MetaTrader 4的EA交易和指标 - 58

Simple indicator that shows external ( outside ) bars. In certain cases, external bars can be seen as strong trend bars instead of range bars. This can be observed when a with-trend external bar occurs at a reversal from a strong trend. It will help you notice more easily different patterns like - Inside-outside-inside, Inside- Inside -inside, outside - Inside -outside, etc. Works perfectly with my other free indicators Internal bar and Shadows
Inputs: How many history bars to calculate on l
FREE
With the Chart Group indicator, you can link chart so that changing the symbol on one chart changes it on all linked charts. How to use: Attach the indicator to each chart you wish to link. The Group ID number appears in the bottom left corner of the chart. Charts sharing the same Group ID are interconnected as a single group. You can create multiple chart groups by assigning different Group ID numbers to charts. Tip: Combine this tool with a symbol navigator tool to smoothly navigate through m
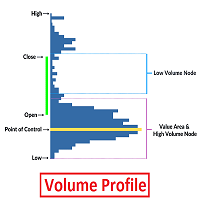
Volume Profile is an advanced charting study that displays trading activity over a specified time period at specified price levels. The study (accounting for user defined parameters such as number of rows and time period) plots a histogram on the chart meant to reveal dominant and/or significant price levels based on volume. Essentially, Volume Profile takes the total volume traded at a specific price level during the specified time period and divides the total volume into either buy volume or s
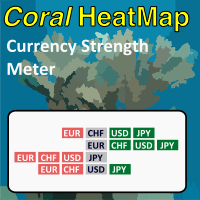
Coral Heatmap is a currency strength meter based on the ATR values for the selected timeframe. There are two main view modes: All Currencies (default) - see the ranked strength of all currencies in a single view Selected Currency - see the relative strength of all other currencies compared to a selected currency You can optionally display the timeframe selection toolbar; timeframe is always synchronized to the current chart timeframe. Use keyboard shortcuts to quickly navigate currencies (up/d

The Linker charts master utility links all open chart windows and switches them to one instrument. All the operations in the window on which the indicator is running are copied to all the linked ones. It is a great aid for those trading based on support and resistance levels. For instance, a level drawn for D1 will be drawn in other windows. The utility responds to the change of the style, color of objects and selection of the timeframes to display the objects. The utility copies the settings fr
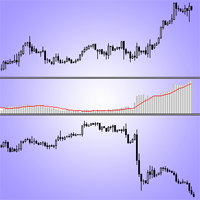
This is an indicator of trading instruments' correlation. It shows the difference of price values of two symbols. The increase in price divergence and the reduction of price divergence can be seen as signals to transactions. The indicator can be used for hedge strategies. The indicator sends Alerts and Push-notifications to the mobile app about the crossing of the moving averages of Envelopes. The indicator has a simple setup. You need to put him in the window of the traded instrument and choose
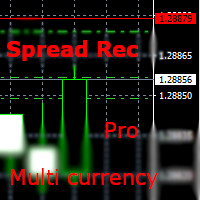
With this EA you are able to record the spread of any currency pair you place in the input parameter. Just drag and drop the EA to one currency. You can record all currencies from ONE chart. There is no need to open multiple charts! But fill the market watch with all specified symbols! Double click on the background of the panel. So you can move it to another position. parameters: RunEA >>> Rec yes/no right from the beginning Export Folder Export Filename Appendix >>> None / Date / Day of Week U
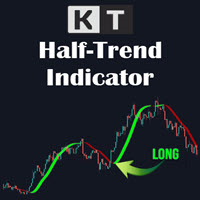
The KT HalfTrend is a moving average-based trend indicator that draws zones. It marks a trend shift by drawing bearish and bullish invalidation zones on the chart. It also displays the trend buy-sell strength with arrows on the main chart. The indicator will be flat if no trend indicates accumulation, temporary price, or distribution zones. If there is a trend, there will be a slope in that direction. The trend signals are substantial if the slope is steep, either to the upside or the downside.

Tax Buddy creates a simple, sortable trading report which you can send to your local tax authorities alongside your annual declaration. I've been using this kind of report for the German Finanzamt in order to declare my capital gains ("Kapitalerträge") in a readily comprehensible manner. For testing purposes, the Demo version places random trades in the Strategy Tester on the symbol of your choice and creates a demo report for them.
Conveniently, all reports are stored in the common path for a

Close all your trades or some of them with this script. If you have multiple trades open on a symbol and you want to close all of them just drag the script onto the chart and close the trades without delay. The Script will ask you how many trades you want to remain open... In case you want to close all trades just click OK Say you want to leave 1 position open out of 7, just type in 1 and click ok. Script closes trades faster than EA because it does not wait for the market to move but rather

First of all, it is worth highlighting here that this Trading Indicator is Non Repainting, Non Redrawing and Non Lagging, which makes it ideal for manual trading. Never repaint and recalculate Once an arrow appears it never disappears, the signal comes at the opening of the new candle You will now be more profitable with this indicator The indicator will alert you when an arrow appears You can do swing trading or scalping trading The indicator helps you identify the trend Can be optimized acros

MT5 Version SMT Divergences MT4
SMT Divergences is one of the most innovative indicators in the market. It offers the possibility of analyzing price divergences between 2 pairs. These divergences highlight and help to foresee what banks and institutions are planning to do. SMT divergences also provides you with a kill zones indicator and the possibility of filtering divergences occurring during these kill zones. The strategy tester is limited in MT4. Contact the author to get your Demo Version

Certainly! An EA Exponential Moving Average (EMA) strategy is a trading or investment approach used in financial markets, particularly in the context of stocks, cryptocurrencies, and other assets. Here's an explanation in English: An Exponential Moving Average (EMA) strategy is a popular method employed by traders and investors to analyze price trends in financial markets. It's a technical analysis tool that helps identify potential buying or selling opportunities based on historical price data.

Gold Trend Following Expert Advisor (EA) is a sophisticated, fully-automated trading algorithm designed to maximize profitability in the gold market (XAUUSD). Optimized for a 1-minute timeframe, this EA is perfect for high-frequency traders and those who prefer to automate their trading activities. This EA implements a robust trend-following strategy, combining multiple technical indicators to make informed trading decisions. It utilizes the Moving Average Convergence Divergence (MACD), Exponent

This utility ensures a real-time synchronization of multiple charts. Any event of a graphical object creation/modification/deletion, chart scrolling and zooming is copied from the current source chart to one or more receiving charts. Note: demo-version of this product doesn't work in the backtester! ______________________________________________________________ Settings: Synchronize with - select the receivers: Same symbol - all charts with the same symbol; Same symbol - all charts with the same

The indicator detects and displays М. Gartley's Butterfly pattern. The pattern is plotted by the extreme values of the ZigZag indicator (included in the resources, no need to install). After detecting the pattern, the indicator notifies of that by the pop-up window, a mobile notification and an email. The pattern and wave parameters are displayed on the screenshots. The default parameters are used for demonstration purposes only in order to increase the amount of detected patterns.
Parameters

EA Black Wolf initiate a cycle of buy or sell depending of the trend of a built-in indicator, thus the EA works according to the "Trend Follow" strategy, which means following the trend. Recommend pairs EURUSD,GBP USD, EURAUD,AUDJPY,GBPAUD,CADJPY
Time Frame M15
Recommend deposit 1000 usd or 1000 cents Recommend settings Default SETTINGS Lot type - lot type calculation (can be Constant, based on risk or Constant size per 1000) Lot size - lot size Trade Buy - allow the adviser to buy Trad

This is a volume profile that shows the volume with a fixed constant time frame that you set. The indicator also shows the maximum volume value (VPOC - VOLUME POINT OF CONTROL) and the average value, colors and settings you can adjust as you like, there are many possibilities. If you need an indicator that shows the variable volume range frames there is ...HERE... Volume Profile is an advanced charting study that displays trading activity over a specified time period at specified price leve

The Relative Momentum Index (RMI) was developed by Roger Altman, and introduced in his Feb 1993 article in Technical Analysis of Stocks & Commodities magazine. As its name suggests, Relative Momentum Index adds a momentum component to the traditional RSI, designed to increase reliability by decreasing spurious oscillations between defined overbought and oversold levels. This Relative Momentum Index indicator has 2 components. A change in RMI line color provides a warning signal for an upward or
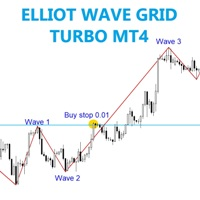
The EA trades will pending order when break price of wave 1 and run wave 3 . Best time frame 1h , Any pair any broker no limited, recommend minimum deposit 500$
SETTING Symbole - Set symbol to trade. Wave_depth - Set the wave size. Wave_deviation - Set wide of the wave. Lots - start lot. Multiple_lots - Multiply lot for next order. Max_lots - maximum lot. Grid_boost - Frequency of opening position (Less more order). Grid_minimum_pips - Check distance grid from last order. TP_pips - take

Welcome to the world of advanced trading with the RSI Multicurrency Scanner! Maximize your trading experience with our powerful MT4 indicator designed for seamless analysis and real-time insights. Key Features: Effortless RSI Scanning: Unlock the full potential of the RSI Multicurrency Scanner by effortlessly scanning multiple currency pairs. Receive instant alerts when specific Relative Strength Index (RSI) conditions are met, ensuring you stay ahead of market movements. Comprehensive Dashboar

Short Term Scalper EA is an Expert Advisor works in the short-term direction and always uses a tight stop loss invisible to the broker. Only one order per currency pair can be opened at a time. When the short-term trend changes, the EA changes the type of the pending order, deletes the old one and places a new order. The pending order follows the price in anticipation of when the market begins its short-term movement. This scalper does not work in a flat, therefore it should be used on highly v
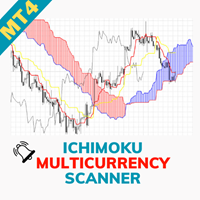
Welcome to the world of advanced trading with the Ichimoku Multicurrency Scanner! Maximize your trading experience with our powerful MT4 indicator designed for seamless analysis and real-time insights. Key Features: Effortless Ichimoku Scanning: Unlock the full potential of the Ichimoku Multicurrency Scanner by effortlessly scanning multiple currency pairs. Receive instant alerts when specific Ichimoku Cloud conditions are met, ensuring you stay ahead of market movements. Comprehensive Dashboar
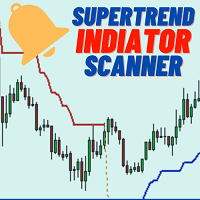
Welcome to the world of advanced trading with the Supertrend Indicator Scanner! Maximize your trading experience with our powerful MT4 indicator designed for seamless analysis and real-time insights. Key Features: Effortless Supertrend Scanning: Unlock the full potential of the Supertrend Indicator Scanner by effortlessly scanning multiple currency pairs. Receive instant alerts when specific Supertrend conditions are met, ensuring you stay ahead of market movements. Comprehensive Dashboard Insi
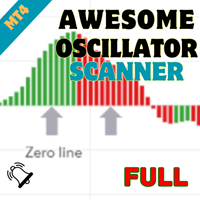
Welcome to the world of advanced trading with the Awesome Oscillator Scanner! Maximize your trading experience with our powerful MT4 indicator designed for seamless analysis and real-time insights. Key Features: Effortless Awesome Oscillator Scanning: Unlock the full potential of the Awesome Oscillator Scanner by effortlessly scanning multiple currency pairs. Receive instant alerts when specific Awesome Oscillator conditions are met, ensuring you stay ahead of market movements. Comprehensive Da

The EA opens Buy and Sell orders when the price moves in one direction, orders with a positive profit are buried at TakeprofitSELL or TakeprofitBUY, orders with a negative profit are opened with a double lot. iDistance - the initial minimum distance for opening and closing an order. iSlippge - slippage. IncreaseBUY - extension of the Stoploss Buy order. IncreaseSell - extension of the Stoploss of the SELL order. TakeprofitSELL - close all Sell orders by Takeprofit. TakeprofitBUY - close all BUY
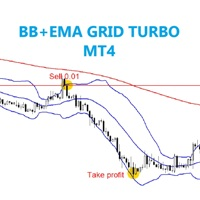
The EA trades on candles breakout from above or below BB, then be checked trend by MA to confirm order position. SETTING Symbole - Set symbol to trade. BB_period - Set BB period. BB_deviation - Set BB deviation. MA_period - Set MA period. Lots - start lot. Multiple_lots - Multiply lot for next order. Max_lots - maximum lot. Grid_boost - Frequency of opening position (Less = more order). Grid_minimum_pips - Check distance grid from last order. TP_pips - take profit, in pips. SL_money - Stop l

Daily supply and demand levels for breakouts or reversals. Use on 1 Hour charts No nonsense, for the confident trader who trades price action supply and demand levels with daily projections without the fluff using 1 Hour charts. MT5 Version: https://www.mql5.com/en/market/product/108522 The Bank Trader Indicator is a sophisticated tool employed by institutional traders, particularly those in banking institutions, to navigate the complex world of forex markets. Rooted in the principles of daily

What is this EA about? This EA is right for you if you use martingale or grid systems without own recovery. Why? Using Martingale or grid systems are pretty good on one hand because the give steady little return. But if the trend goes against the used system, more and more trades are opened. It can burn your whole account. During a trend normally there are some pullbacks. This EA is taking advantage of these pullbacks. It takes the oldest and and all trades with profit to calculate the average p

The Breakout Line in technical analysis serves as a crucial tool for understanding market dynamics and potential shifts in price direction. It's designed to highlight rapid accelerations or declines in the market's trajectory. Unconventional Analysis : The Breakout Line is not your typical technical indicator; it's tailored to capture swift market movements, offering a unique perspective on price trends. Angle of the Breakout Line : The sharper the angle formed by the Breakout Line, the stro

The Quick trade report separately by symbols script will be useful for simultaneous trading on multiple instruments. It provides the ability to assess the effectiveness of trading on each symbol separately. It is possible to set a time period for making the reports. The report visualizes the changes in the balance for deals on each symbol. Also, the following key trading parameters are calculated for each instrument: Total net profit - the financial result of all trades. This parameter represent

Better Support & Resistance shows the best support and resistance lines and zones. It is based on Fractals with the factor of your choice. All fractals are assembled, weighted, extended and merged into a clear set of support and resistance lines. The immediate nearby lines are shown as zones when price is in that zone. Better Support & Resistance gives you the best overview of the important price levels.
Settings Better Support & Resistance's default settings are good enough most of the time.

Wicks Trade Panel Premium It's a Trade Panel include Order Management & Risk Management for serious trader. Especially for those traders who pay attention to important events like the CPI, NFP, and ADP. A one-of-a-kind faster technique to fix the Entry Price by simply pointing the mouse pointer at it. This is what I enjoy about it. Automatically closing 50% order size lots when setting TRUE on Breakeven Status. It's especially useful when trading on significant economic events like the CPI, NF

Breakout Experts Advisor
Main strategy of this Experts Advisor is based on Daily High and Daily Low. If today's price break yesterday's high or low, this Experts will open trade. Please consider that is Experts are Martingale. But, their distance already set on the EA's program. FYI, distance for every order (on martingale) is also based on Fibonacci Retracement. It'll make every order not too close or too far. It's also help when the market are ranging/sideways. And, our maximum opened trade

Box martingale system is an indicator designed to trade martingale. This indicator sends a signal from the highest point where the trend is likely to return. With these signals the user starts the trades. These signals appear in the form of a box. The user can see from which point the signal is given. The important thing in trading martingale is to find a good starting point. This indicator provides this starting point.
Trade rules Start processing when the first trade signal arrives. The impo
Volume Volatility Dashboard is a great tool for quickest possible analysis of multiple currency pairs in terms of extremely high and extremely low accumulation to distribution ratio in comparison to values from past. The number of displayed symbols is 30 and the name of each symbol can be edited in the parameters, so we are able to analyze not only predetermined currency pairs, but also other ones, commodities, equities, indices, currency pairs with prefixes and suffixes etc... This analyzer is

Pivot trend indicator is a trend indicator that uses standard pivot calculation and some indicators. The purpose of the indicator is to calculate the possible trends using the pivot point. And to give the user an idea about trend direction. You can use this display as a trend indicator. Or with other indicators suitable for your strategy.
Features The green bar represents the upward trend. The red bar represents the downward trend. The blue pivot point represents the upward trend. The yellow p

My Intraday trading session indicator. SL Session Strength 28 Pair https://www.mql5.com/en/market/product/57585 This strategy is even used by the Banks to make profits. They take a strong currency and pitch against a weak currency This indicator allows you to analyze the hidden trends and correlations between the 8 most traded currencies via unique strength meter which creates multiple charts in a single window based on the price action of each currency in relation to all other currenci

Contact me after payment to send you the user manual PDF file. Introduction The moving average indicator is the most well-known and one of the most popular indicators among traders. It is very simple to work with, but a basic question has always become a big challenge among traders: What is the most optimal setting of the moving average for each chart-time frame? The answer to this question is very difficult, you have to try different settings of the moving average indicator for different chart

Description: The indicator shows the TDI indicator in a separate window, and with the RSI component, the indicator finds possible divergences with M or W patterns. KEY LINKS: How to Install - Frequent Questions - All Products Functions: Finds Market Makers patterns. Finds extremes or exhaustion into the market. Looks for a trend continuation. Content: TDI Indicator Divergence and M or W Signals Note 1: This indicator should only be considered as a part of any trading strategy. You shoul
テクニカル指標開発の第一人者であるトム・デマークが考案した TDシーケンシャルは、 トレンドの転換点を判断するのに有用なインディケータです。このインディケータは TDシーケンシャルを裁量およびEAで実際に利用してきた私自身の経験から、より手軽に、かつ効果的に活用できるよう作成された裁量トレード用サインツールです。
強いトレンドが生じている際に多くのだましが生じるのはTDシーケンシャルの弱点と思われますが、これを克服するために強力なフィルターを装備しています。また、最も有効と思われるセットアップ9に絞ってサインを発信します。
全通貨ペア、全タイムフレームで利用できます。勝敗判定機能により、このインディケータの直近の相場環境に対する有効性を確認できます。
設定項目は下記のとおりです。 Enable Protect Mode...強いトレンドが発生した際の連敗を回避します Box Filter...下で設定する3つのタイムフレームでの移動平均でパーフェクト・オーダーが発生していない状態をボックス相場と判定し、サインを限定します Moving Average Time Frame1
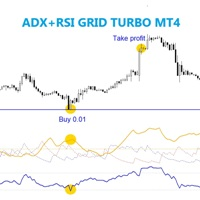
The EA trades on price which over bought and over sold of RSI indicator meanwhile check over limit ADX value level. Best time frame 30 mins, Any pair any broker no limited, recommend minimum deposit 500$
SETTING Symbole - Set symbol to trade. ADX_period - Set ADX period. ADX_value - Set ADX level. RSI_period - Set RSI period. RSI_upper_level - Set RSI high level. RSI_lower_level - Set RSI low level. Bar_history - Set bar to confirm trade. Lots - start lot. Multiple_lots - Multiply lot for n

KT MACD Alerts is a personal implementation of the standard MACD indicator available in Metatrader. It provides alerts and also draws vertical lines for the below two events: When MACD crosses above the zero line. When MACD crosses below the zero line.
Features It comes with an inbuilt MTF scanner, which shows the MACD direction on every time frame. A perfect choice for traders who speculate the MACD crossovers above/below the zero line. Along with the alerts, it also draws the vertical line
Introduction
This indicator marks Pin Bars (bars with an unusually long upper or lower candle wick) on your chart. It will also send alerts when one forms, including via e-mail or push notification to your phone . It's ideal for when you want to be notified of a Pin Bar set-up but don't want to have to sit in front of your chart all day.
You can configure all the settings including: What proportion of the bar should be made up of the wick How big or small the total size of the Pin Bar has
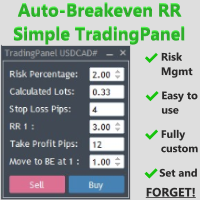
The Auto-Breakeven RR Simple TradingPanel EA is a simple and intuitive tool that will be an asset to your trading arsenal. Have you ever missed the perfect entry because you were busy calculating the lot size?
I have. Many times. Which is why I created this EA to simplify and automate risk management as much as I could.
A true SET AND FORGET tool - execute your trade and walk away to prevent micromanaging your trade. This tool secures the trade at your specified Risk-to-Reward (RR) level.
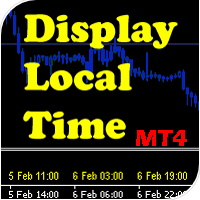
DLT (Display Local Time) is an INDICATOR which displays local time using GMT timezone that can be easily switched. Support non standard timezones eg. -3:30, +4:45 Useful when you trade in your local market hours, or to evaluate candles in different time zone. This is for MT4 version. For MT5 version click here: https://www.mql5.com/en/market/product/71656 There is very useful info for candle: Range, Upperwick, Body, Lowerwick. You can get this when custom crosshair is enabled. Sessions will

A tall upper shadow occurs when the price moves during the period, but goes back down, which is a bearish signal. A tall lower shadow forms when bears push the price down, but bulls pull it back up, which leaves a long line or shadow. This is considered a bullish signal.
Some technical analysts believe a tall or long shadow means the stock will turn or reverse. Some believe a short or lower shadow means a price rise is coming. In other words, a tall upper shadow means a downturn is coming, whil
The indicator plots the Up and Down arrows on every price swing made by the classic Zigzag indicator. When Zigzag makes a new swing low, a green arrow is plotted. Likewise, a red arrow is plotted when Zigzag makes a new swing high.
Features
Compared to the classic ZigZag, it marks the swing points more effectively. It helps to identify the forming chart patterns in advance. It comes with a Multi-Timeframe scanner which shows the Zigzag direction on each timeframe. All Metatrader alerts includ

Полностью автоматическая торговая система. Vik Plan B Mini - это укороченная версия советника Vik Plan B, с минимальными настройками. Для входа в сделку использует свечной анализ. Входные параметры: UseDayProfitStop - если сегодня был профит, больше не торгуем FixLot - фиксированный лот StartHour - старт торговли StopHour - стоп торговли UseCloseAllProfit - вкл/откл закрытие всех ордеров по заданому профиту USD_Profit - профит для закрытие всех ордеров UseCloseAllStop - вкл/откл закрытие

With this indicator you'll have a general reading of the market's range using Gann's calculating modes. Gann's swing is used to have a quick reading to the market latest movements at first glance. The foundation of this swing calculation is in the count of candles in relation to the break-up and break-down of the price. When the price breaks-up the last maximum, the swing will get traced if a certain number of candles is exceeded from the last minimum. It can be used a "pure Gann" or not: If set
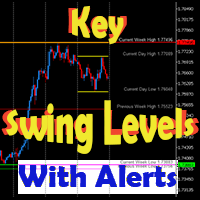
This dynamic indicator will draw the Key Swing High and Low Levels for any symbol on any timeframe!
User may Hide or Show any Level or Label and also Receive Alerts when price returns to that key level via Pop-Up, Push, Email or Sound.
Levels include Current Day High/Low, Previous Day High/Low, Current Week High/Low, Previous Week High/Low and Monthly High/Low.
The Key Levels are labeled with the Price Point Data Listed next to it for quick easy reference.
You can change the Style,

TeconLab Indicator User Guide Overview The TeconLab Indicator is a tool for MetaTrader 4 (MT4) users, fine-tuned to gather price information, including Date, Time, Open, High, Low, Close, and Volume, and update this data in real-time. Uniquely, this indicator autonomously refreshes the CSV file every minute or less, meaning there's no need for manual restarts—just activate it once, and it will continuously collect data as long as MT4 is running. It maintains the latest data according to the size

Ka Ching EA is a fully automatic robot that has the level of a professional trader. The robot uses a completely new and unknown strategy. During real trading, it does not look towards history and acts according to circumstances. The algorithm of the adviser is based on determining the strength of the market and the formation of pivot points. Orders are closed by Take Profit, Trailing or Stop Loss. Expert Advisor settings optimized for the Icmarket broker. Minor optimization of input parameter

If you like trading by candle patterns and want to reinforce this approach by modern technologies, this indicator and other related tools are for you. In fact, this indicator is a part of a toolbox, that includes a neural network engine implementing Self-Organizing Map (SOM) for candle patterns recognition, prediction, and provides you with an option to explore input and resulting data. The toolbox contains: SOMFX1Builder - a script for training neural networks; it builds a file with generalize

YOU CAN NOW DOWNLOAD FREE VERSIONS OF OUR PAID INDICATORS . IT'S OUR WAY OF GIVING BACK TO THE COMMUNITY ! >>> GO HERE TO DOWNLOAD
Momentum channel is a simple momentum based system yet with a great degree of accuracy in detecting turning points. The market momentum are defined by Average True Range Channels . When price breaks these channels most times , it is an indication of a shift in market momentum and thus a possible new trend formation. The system can be traded on any time frame an
FREE

This indicator is based on the Weis wave principle of wave volume. Below are few features of the indicator It draws the wave on the chart while the accumulated volume per wave in a different window at the bottom of the chart You can configure the turning point move It displays the accumulated volume (in thousands, eg for 15000 volume it will show 15) at the end of each wave You can also configure to show number of candles in the wave along with the wave volume The indicator calculates the distin

KT Volume Profile shows the volume accumulation data as a histogram on the y-axis providing an ability to find out the trading activity over specified time periods and price levels.
Point of Control (POC) in a Volume Profile
POC represents a price level that coincides with the highest traded volume within the whole volume profile histogram. POC is mostly used as a support/resistance or as an essential price level where market retest before going in a specific direction.
Features Very easy
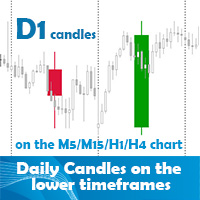
Daily candles on the lower timeframes indicator allows the user to display the daily timeframe on the lower timeframe chart. The indicator shows the daily candles on the chart from yesterday. It does not represent the today's daily candle. You can position and color the candles with or without price labels (High/Low/Open/Close of the day) and High/Low lines. It can help to see the bigger picture if you are a day trader or scalper. Obviously the best use is on the lower than daily timeframes. The

Free Scalping is a comprehensive manual system developed for the most efficient trading at any market conditions and time scale.
The system is based on two main blocks:
1. The block of trend determination that calculates dynamic support and resistance. The function of auto-optimization is available for this block.
2. The block of price deviation from its median based on the big set of regressions to get the statistically-valid result. Entry rules For buys:
1. The trend goes up
2. The pr
FREE
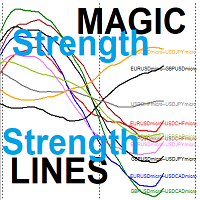
the MAGIC Smooth Strength lines for Currencies couples Each line represents the relative strength of two couples out of 5 user input symbols -> 10 indicator lines Your Strategy is based on selecting the weaker strength line and wait for a reversal sign OR Your Strategy is based on selecting the stronger strength line and wait for a reversal sign When reversal occurs you will trade on the two symbols represented by this line like the strength relative line for EURUSD and USDCAD when it is th

This is the multi-time frame Fisher Divergence indicator for MetaTrader 4, with signal arrows and a Signals panel which is freely movable showing the last signals and their time in color. The indicator draws some lines based on signal time. On the time frames below H4, the indicator scans for H4 divergence signals and draws it on chart with thick trend lines, and also it draws arrows for them. And also it scans the current time frame and draws a line at divergence location and places signal arro

交易实用必备工具指标 波浪自动计算指标,通道趋势交易 完美的趋势-波浪自动计算通道计算 , MT4版本 完美的趋势-波浪自动计算通道计算 , MT5版本 本地跟单复制交易 Easy And Fast Copy , MT4版本 Easy And Fast Copy , MT5版本 本地跟单复制交易 模拟试用 Easy And Fast Copy , MT4 模拟账号运行 Easy And Fast Copy , MT5 模拟账号运行 MACD称为异同移动平均线 ,是从双指数移动平均线发展而来的,由快的指数移动平均线(EMA12)减去慢的指数移动平均线(EMA26)得到快线DIF,再用2×(快线DIF-DIF的9日加权移动均线DEA)得到MACD柱。MACD的意义和双移动平均线基本相同, 即由快、慢均线的离散、聚合表征当前的多空状态和股价可能的发展变化趋势,但阅读起来更方便。MACD的变化代表着市场趋势的变化,不同K线级别的MACD代表当前级别周期中的买卖趋势。
1.本指标增加MACD的双线显示, 2.并且对能量柱进行4色不同的渐变! 强烈推荐趋势指标, 波浪的标准自动计算 和
FREE

Hola Traders. Lot - lot size for pending orders. Martingale - double lot size of pending orders. *(No Martingale = 1.00) TotalGridEachSide - unit each side of pending orders. ( 1 pip = 10 points for a 5-digit broker ) SpaceOfFirstOrder - distance for the first order in points. ( 1 pip = 10 points for a 5-digit broker ) Take Profit - profit in points. ( 1 pip = 10 points for a 5-digit broker ) Stop Loss - loss in points. ( 1 pip = 10 points for a 5-digit broker )
and you can open order BUYS

このインディケータはボリンジャーバンドを裁量およびEAで実際に利用してきた私自身の経験から、より手軽に、かつ効果的に活用できるよう作成された裁量トレード用サインツールです。 ブレイクアウトでの順張り、リバウンドでの逆張りの両面で利用でき、各種のフィルター機能でより精度の高いサインを発信します 勝敗判定機能により、このインディケータの直近の相場環境に対する有効性を確認できます 全通貨ペア、全タイムフレームで利用できます。リペイントはしません
設定項目は以下の通りです。 Bollinger Bands Period
Bollinger Bands Deviation
Bollinger Bands Shift
Entry Mode ...ボリンジャーバンドにタッチしてからのBreakout(順張り), Rebound(逆張り)のどちらかを指定 Plus Filter ...独自アルゴリズムによるフィルターでシグナルの精度を高めます(Reboundモード専用) Trend Filter ...下で設定する移動平均のトレンド方向でのシグナルに限定します Moving Aver

This Expert Advisor is a night scalper. It works at the end of the American session and at the beginning of the Asian session. The working timeframe is M15. It uses standard indicators for market entries and exits. Take profit and a protective stop loss are set for each order. However, orders are most often closed based on indicator signals. See the Comments page for ready .set files for traded currency pairs. The EA has an optional news filter which is based on a news indicator. IMPORTANT : Par
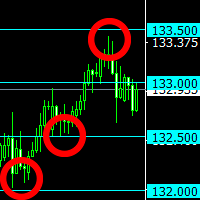
The indicator plots "round" levels, the step of which is specified in the settings.
Perfect as an addition to any trading systems.
Very low price - only $ 30! Round levels often become price support or resistance. MT5-version: https://www.mql5.com/en/market/product/67255
This allows you to either fix a profit, or open a position after a breakdown of the level, work towards a rebound in price. The indicator will be an excellent tool in a trader's arsenal!

Risk Calculator Pro is a simple and useful utility for MT4 to calculate your stop loss risk and open orders with accurate lot size . --- Contact me in messages for free gift after purchase! ---
How It Work?
Determine your entry price manually OR tick "current Price" . Determine your Stop Loss price. Determine your Risk Percentage (based on your account balance). Finally your Lot Size show on the green box. Advantage of Risk Calculator Pro: Simple & clean dashboard Diagnose wide SL & big r

该指标建立了趋势线的扇形(在单击某个蜡烛之后),类似于经典的江恩角。该指标的特点是它不仅在固定比例上构建角度,而且还使用一定数量柱线的平均价格(可选)。
有两种方法可以计算指标中角度的平均价格(可选):
1) 计算从高到低的平均价格变动(对于一定数量的柱);
2) 计算从开盘到收盘的平均价格变动;
选项:
1.Method——构造角的方法;
2. FixedScale - 固定比例(如果在Method中选择了Fixed_Scale);
3. SecondaryAngles - 控制绘制次角的权限;
4. RayRight - 为趋势线设置射线;
5. DrawBackground - 画线作为背景;
6. AnglesQuantity——角度数;
7. Bars_To_Process - 周期,柱的数量,在此基础上确定平均价格,角度的“速度”。如果为零或更低,则根据所有历史数据计算;
8. RisingMainAnglesClr、RisingSecondaryAnglesClr、FallingMainAngle

这个指标用变色柱子来显示趋势。简单易用。 使用方法: 如果柱子从青色变成紫红色,意味着趋势向上了。 如果柱子从紫红色变成青色,意味着趋势向下了。 参数: MaPeriods: 移动均线周期。 f1: 内层通道扩展系数。 f2: 外层通道扩展系数。 Popup Window Alert Email Alert Mobile Push Alert
报警: 当趋势发生改变后,从多头改成空头,或者空头改成多头 当价格从下向上穿越最上边的外层通道时,报警平多单 当价格从上向下穿越最下边的外层通道时,报警平空单 MT5版本: Gamma Bands
简单易用,回调是加仓做多,反弹是加仓做空.可以根据内层通道设置较小的止损,可以达到以以小博大的目的. 我们知道,没有完美的指标,需要配合你的策略,最终是依赖资金管理. 盈亏比和胜率就像鱼和熊掌不可兼得, 也就是盈亏比和胜率你只能搞定其中之一.

50% discount for one week only
An expert based on artificial intelligence and neural network
99% of this expert's strategy is in charge of artificial intelligence
A complex neural network with multiple filters
Experience multiple experts in one expert
I have provided you with several months of artificial intelligence training with powerful new and advanced computers (and several years of programming effort) at the lowest price.
Features of this expert:
Can be used:
in several dif
MetaTrader市场提供了一个方便,安全的购买MetaTrader平台应用程序的场所。直接从您的程序端免费下载EA交易和指标的试用版在测试策略中进行测试。
在不同模式下测试应用程序来监视性能和为您想要使用MQL5.community支付系统的产品进行付款。
您错过了交易机会:
- 免费交易应用程序
- 8,000+信号可供复制
- 探索金融市场的经济新闻
注册
登录