适用于MetaTrader 4的EA交易和指标 - 56

Wavetrend Oscillator – Indicator Description The Wavetrend Oscillator is a momentum-based technical indicator that helps traders identify overbought and oversold conditions , trend strength, and potential trade entry/exit points . It is particularly effective for scalping and swing trading , as it incorporates multi-timeframe (MTF) analysis by integrating higher timeframe trend confirmation. Key Features ️ WT1 & WT2 Crossover System – Identifies momentum shifts and potential trade signals.
FREE

在您的平台上提供新版 MT4 标准指标的目的,是在子窗口里显示多时间帧的相同指标。参看下面例中的图片。 但是它的显示不像简单的多时间帧指标。它是指标在其时间帧的实际显示。 在 FFx 指标里提供了一些选项: 选择显示的时间帧 (M1 至 每月) 定义每个时间帧箱体的宽度 (柱线数量) 提示弹出/声音/邮件/推送 (RSI 穿进/出超买超卖 (OBOS) 区域) 直接在图表上激活/停用提示 修改所有颜色 ... 当然还有所有标准指标的常用设置 如何设置提示: 在弹出的参数设置 : 选择您希望的提示和模式 (弹出、声音、邮件或推送通知) 之后在图表上 : 选择铃铛图标 (双击) 然后将其拖拽到任意位置。在下一个报价来临,它将恢复它的原始位置,但用不同颜色信号改变它的状态。红到绿意为它现在已激活 … 绿到红意为它现在未激活。
FREE
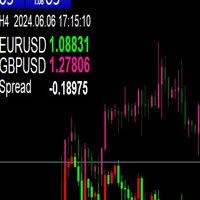
该指标可用于在当前品种的图表上添加另一个品种的K线图。 1.图表高低会自动调整 2.如果切换当前图标周期,另一品种的K也会切换到相应的周期 3.在图表的左上角会显示当前所用的周期,当前时间,以及两个标的的当前价格,价差。 4.当切换周期时,由于有大量数据调取,偶尔会比较慢,可以切换试试,或者稍等一会儿。 5.两个品种的价差尽量以左上角显示为准。 。。。。。。。。。。。。。。。。。。。。。。。。。。。。。。。。。。。。。。。 。。。。。。。。。。。。。。。。。。。。。。。。。。。。。。。。。。。。。。。。 。。。。。。。。。。。。。。。。。。。。。。。。。。。。。。。。。。。。。。。。 。。。。。。。。。。。。。。。。。。。。。。。。。。。。。。。。。。
FREE

The programmable signal panel analyzes the charts of all available symbols and timeframes and sends a notification about the appearance of a trading signal. You can program all the necessary signals using the free binding indicator "Signal Collection". The binding indicator is provided with open source code. Thus, it is possible to program all the necessary signals for subsequent use in conjunction with the signal panel. The signal panel can not only analyze charts, but also manage these chart
FREE
MA intersection indicator.
At a selected period, the indicator finds the best of the periods MAs on profit with considering the ratio of losses and profits. (Auto-optimizing MA) Entering a long position is the cross of fast MA from the bottom to up through long MA.
For a short position - vice versa.
The best of the periods is displayed. MAs are also drawn.
In the settings, it is possible to select the period of bars / candles for find better solution.
Also, the time period of the update, a
FREE

Tired of using the same technical indicators? The "Tekno RSI" is an innovative tool designed to make the interpretation of the Relative Strength Index (RSI) more intuitive and accessible to traders of all levels. It displays the RSI as a 3-color histogram, providing a clear and intuitive visual representation of market conditions.
1)Key Features 3-Color Histogram: RSI is a versatile indicator providing insights into market direction and potential reversal points. However, when analyzing the cha
FREE
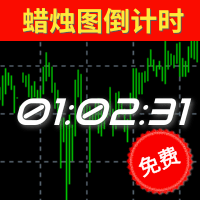
倒计时指标功能介绍 类别
解释
备注
预计结束倒计时 计算当前周期蜡烛图的结束时间(可应用于所有周期),其考虑了蜡烛图可能会因为日常休市而提前结束的情况; 如果该蜡烛图包含多个休市和开市的情况下,以最后的休市或者蜡烛图收盘时间为准。 值得特别注意的是:本指标并没有将平台额外公布的节假日休市、修改休市或者开市时间等因素纳入考虑范围,它仅仅是基于MT4所公开的交易时间做计算,无法100%确保本品种的收盘或者开盘时间无误 ,故使用者需提前明确该品种交易时间情况。
预计开盘倒计时 仅限于状态为"休市中"的提示,根据MT4上公开显示开市时间进行预估大约还有多久时间开盘; 和预计结束倒计时类似,并没有将额外公布的时间纳入考量。由于W1和MN1周期中包含多次的开盘和收盘,所以该两周期无休市提示。
【状态】 颜色 状态 备注 绿色 正常 一切正常 黄色 服务器无报价 服务器实际上传送到MT4并非是毫无中断的,可能是1分钟之内出现多次,甚至是连续较长的时间无报价,取决于您所处的网络延迟、服务器的情况等等。
本品种已有X秒无报价 MT4上并不是所有的品种的报价都是最新的,有可能某个品种长期无
FREE

MQLTA Support Resistance Lines is an indicator that calculates the historical levels of Support and Resistance and display them as Lines on chart. It will also Alert you if the price is in a Safe or Dangerous zone to trade and show you the distance to the next level. The indicator is ideal to be used in other Expert Advisor through the iCustom function. This DEMO only works with AUDNZD, the full product can be found at https://www.mql5.com/en/market/product/26328
How does it work? The indicator
FREE

经过7年的时间,我决定免费发布一些我自己的指标和EA。
如果您觉得它们有用,请 通过五星评级表达支持!您的反馈将继续带来免费工具! 也查看我的其他免费工具 这里
_________________________________ %B 指标用于外汇交易高级分析 %B 指标在 MQL4 中巧妙编写,是一款旨在改变外汇分析方式的动态工具 。通过利用布林带的强大功能,为市场趋势和交易机会提供准确及时的洞察。 主要特点: 精确计算 : 使用公式 %B = (当前价格 - 下带) / (上带 - 下带) 进行深入市场分析。 市场洞察 : 有效识别超买 (>100) 和超卖 (<0) 条件,为市场反转提供早期信号。 趋势分析 : 帮助交易者判断市场趋势的强度,约 50 的值表明市场平衡。 发现差异 ️: 标记价格运动与 %B 值之间的差异,这是潜在趋势变化的关键指标。 无论您是经验丰富的交易者还是刚开始入行,%B 指标都是您工具箱中不可或缺的增补 。其设计用户友好,提供清晰、可操作的数据以指导您的交易决策。 想了解更多关于该指标的信息,请观看
FREE

UzFx 本地货币转换器-MT4 是一款功能强大、简单易用的指标,专为希望以美元和本地货币跟踪浮动和每日损益(P&L)的交易者设计。该工具使用用户定义的汇率提供实时转换,帮助交易者更有效地直观了解自己的交易表现。
(访问简介并查看所有其他 MT4/MT5 产品) (请不要忘记给予评论)
主要功能
以美元和当地货币显示运行盈亏。 每日盈亏计算 - 跟踪当日平仓交易的盈亏情况。 将损益转换为您所需的当地货币(如巴基斯坦卢比、印度卢比、阿联酋迪拉姆等) 汇率自定义 - 手动设置汇率,实现准确转换。 每日损失限额监控 - 当达到每日损失限额时发出警报。 午夜自动重置 - 每个交易日自动重置每日损益。 可调整用户界面位置 - 可修改字体大小、颜色和在图表上的位置。
为什么使用该指标?
避免不必要的手动转换和计算错误。 提供清晰、结构化的运行和关闭交易利润视图。 通过跟踪每日损失限额确保更好的风险管理。
注:该指标不执行交易;纯粹用于损益监控和货币转换。
FREE

淫妖是一个普遍的专家顾问。
它的主要优点是最高的输入精度,90%的交易及以上。
专家顾问参数根据用户需要的功能分为类别。 所有功能都可以禁用。
Ea交易旨在分散中小型存款。
主:
TakeProfit-以盈利结束交易的点数
止损-关闭亏损交易的点数
滑点-滑点
魔术顾问ID
手数-交易量
动态手数设置:
动态-启用/禁用事务量的动态计算
风险-风险系数。
布洛克马丁*盖尔经典 每个方向一次只能开一笔交易。 在亏损的情况下,下一个交易将是一个交易量乘数。
马丁-启用/禁用鞅
乘数马丁-手数乘数
淫妖专家顾问也可以构建网格。
Setka-启用/禁用网格
距离Setka-网格中订单之间的距离
乘数Setka-乘数
当然,不是没有顾问拖网的存在。 如果需要,您可以启用它,如果你不使用网格。
智能止损
智能步停止-束缚步
有一个按时交易的功能。 如果00:00和23:59被设置为默认值,则禁用它。
开始-交易开始时间
交易结束
交易之间的停顿是必要的,这样当我们收到一个信号时,我们只交易一次。
Pause_orders-启用/禁用订单之间的
FREE

iCC in iMA is indicator to change color in iMA if iCCI crosses level up (up trend) or crosses level down (down trend). It is a useful tool to track when the upside and the downside iCCI on iMA.
You can to get source code from here .
Parameters MA_Periods —Period for iMA. MA_Method — Method for iMA. CCI_Periods —Period for iCCI. CCI_ApliedPrice — Price used for iCCI. CCI_LevelsUp — Level iCCI for up trend. CCI_LevelsDN — Level iCCI for down trend. BarsCount — How many bars will show the line. R
FREE
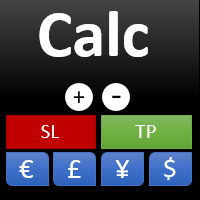
This indicator is designed to provide all useful information about symbol, account, positions and profit. It is developed for improving trader's money management.
Parameters Calc can be divided to separate blocks. Each block is possible to hide, set its own color and other properties. Block symbol: This block displays information about actual SPREAD, POINT VALUE (in deposit currency for 1 lot), SWAP LONG and SHORT. Show symbol info - display/hide this block Color of symbol info - color of this
FREE
The Breakout EA trades fully automatically He doesn't use dangerous strategies like martingale or gritter etc. With this EA you can set a lot according to your wishes or according to my set. In addition, it has a news filter, it pauses the trades during the set time. In addition, it automatically increases the lots size if desired.
The backtest and trades were done with Fusion Markets: Leverage 1:500 Zero account Account opening with this link: https://fusionmarkets.com/en?cxd=45701_1642076&cx
FREE

Just a panel for drawing levels. Minimal but very useful thing. This is a reimagining of Color Levels Pro. ---- 4 types of customized levels. support for rectangle and line levels. The indicator parameters are very simple and are divided into blocks. For any update idea please contact me here. ---- don't suffer don't suffer ---- Enjoy your work!!!!!!!! ----
FREE

Trade Receiver Free is a free tool to copy trades/signals from multiple MT4/MT5 accounts. The provider account must use copier EA to send the signal. This version can be used on MT4 accounts only. For MT5 accounts, you must use Trade Receiver Free for MT5 . Reference: - For MT4 receiver, please download Trade Receiver Free .
- For MT5 receiver, please download Trade Receiver Free MT5 .
- For cTrader receiver, please download Trade Receiver Free cTrader .
- If you only need copy from MT4 acco
FREE

简介:
此法则很简单,当一个交易单的浮动盈利大于某个数值时,会自动设置止损价到开仓价位。
设置说明:
Enter your order ID - 第一列的订单号
When Open Profit is over ($)_ , reset SL - 比如设置为100,意为当此交易单的未结利润达到$100时,自动设置止损价到此单的开仓价
注意事项及建议:
1. 请将此EA应用于活动订单,而不是待定订单。
2. 未结利润不应定得太小。
风险提示:
外汇/股票/大宗商品交易,尤其是杠杆交易有风险,交易请务必谨慎。
本法则的任何业绩结果均代表过去的业绩,并不是对未来业绩的保证。
本法则仅供学习交流使用,对于本法则造成的任何获利或者损失,本人不具有权力和义务。
FREE
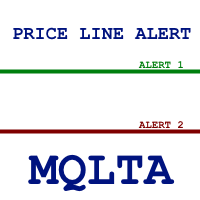
The Price Line Alert Indicator will allow you to set price level that will alert you when hit, the price level will be shown in the chart as lines. Useful to get notified at specific prices, support, resistance, round numbers and so forth. If you want to a similar utility that will automatically close your position at a specific price check https://www.mql5.com/en/market/product/23113
How does it work? You can set several Price Lines and configured them to notify you if the price goes above or
FREE
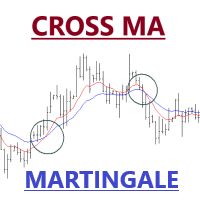
Expert Advisor of Cross two moving averages accompanied by stop loss, take profit, martingale and multi timeframes on each moving averages. You can change all the parameters contained in the moving averages
Please use as appropriate, hopefully can be useful and assist you in the transaction Don't forget to give a review if this product helps you
MA Method 0 = simple 1 = exponential 2 = smoothed 3 = LW
FREE

The script sets Fibonacci levels on the chart using maximums and minimums visible on the chart. The script names Fibo with such timeframe on which it has been launched (Fibo D1 or Fibo M30, etc.), therefore preserving previously constructed levels on different time charts. This instrument will be useful for those who start studying Fibonacci levels and those who need to form these levels in a speedy fashion. The script does not have additional settings. Fibonacci lines can be amended in standard
FREE

VANEXIO USES THE TREND WAVE INDICATOR AND IT CAN IDENTIFY THE BEGINNING AND THE END OF A NEW WAVE TREND MOVEMENT.
AS AN OSCILLATOR, THE INDICATOR IDENTIFIES THE OVERBOUGHT AND OVERSOLD ZONES.
IT WORKS GREAT TO CATCH THE SHORT TERM PRICE REVERSALS AND USES A MARTINGALE STRATEGY TO CLOSE ALL TRADES IN PROFIT.
USE DEFAULT SETTINGS ON H1 OR HIGHER TIME FRAME ON ANY PAIR FOR MORE ACCURATE TRADES
WHY THIS EA :
Smart entries calculated by 5 great strategies The EA can be run on even a $20000 acco
FREE

Investment Castle Support and Resistance Indicator has the following features: 1. Dictates the direction of Buy or Sell trades based on Support and Resistance Levels automatically . 2. Candles stick colors will change to Red for Sell and Blue for Buy (Default settings, user can change from the inputs). 3. This indicator is built-in the Support & Resistance based Investment Castle EA which works with Psychological Key Levels "Support & Resistance".
FREE
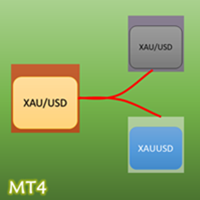
- The Symbol Changer Utility for MetaTrader is a tool that enables traders to switch between various symbols on the MetaTrader trading platform easily and quickly. - It is designed to change the symbol of the current and all open chart windows and the timeframe of the current chart window (by clicking the button). - The tool retrieves symbols from the Market Watch, displaying only the necessary symbols in the market watch.
FREE

"Giant" is a flexible system in relation to trading strategies. It consists of two high-quality indicators that are installed on five different timeframes of the same currency pair (see screenshot). It monitors the trend and gives signals to open. The system passed a large number of checks and showed high accuracy. Indicators are sold separately. The second word in the main name is the indicator itself. This issue sells the indicator "Nicely" .
FREE
Highly configurable MFI indicator. Features: Highly customizable alert functions (at levels, crosses, direction changes via email, push, sound, popup) Multi timeframe ability Color customization (at levels, crosses, direction changes) Linear interpolation and histogram mode options Works on strategy tester in multi timeframe mode (at weekend without ticks also) Adjustable Levels Parameters:
MFI Timeframe: You can set the current or a higher timeframes for MFI. MFI Bar Shift: you can set the
FREE

With the MACD Multi Time Frame indicator, you can spot divergences of higher timeframes while you are searching for pinpointed entries on lower timeframes. This FREE version of the indicator works only on EURUSD and GBPUSD. The full version of the indicator can be found here: MACD Multi Time Frame This blog post gives you REAL-TIME MACD Divergence Analysis for FREE and tips how to trade the divergences: REAL-TIME MACD Divergence Analysis The MACD Multi Time Frame gives you a very good overview o
FREE

Indicator overview Trend indicator usage Moving averages. Highest quality alerts that need no introduction. It is completely loyal to the original algorithm and uses other useful features.
Easy to trade Carry out all kinds of notifications It's not a new paint and it's not a back paint. Setting Indicator SMA50 in Time frame H1 for any pair currency and Gold Spot. EMA200 in Time frame H1 for any pair currency and more than EMA250 for Gold spot. Using it for maximum benefit Set up notification
FREE

Long Term trend analyzer according to proprierty Algorithm and multiple EMA. Works best on H1-H4 Time Frame. We are using this indicator in our Main Fund. Ready to use.
- Setup in any Pair, Equity - H1-H4 Timeframe - Best during main Trading times like Asian-European-American Time - NON REPAINTING
Analyze long term trend. Comes with Alarm, Notifications, Push Signals. Get a signal and enter the Markets.
FREE

你好!
我是Tatsuron,日本个人投资者。 我在外汇市场经营超过 10 亿日元。 所以,让我介绍一个我使用的非常有用的指标。
环境确认类型指标。 我们已将世界市场所知道的支点缩小到每日和每月两个支点。 Daily 是每日交易的指南,而 Monthly 是快攻市场中突破或逆转的材料。
作为积累证据的基础非常有用,例如当它与自信的趋势线重叠时! 与其他指标一起使用!
请检查指标实际运行的视频。 Jpivot 大约在 1:48 开始。
Hello!
I'm Tatsuron, a Japanese individual investor. I was operating over 1 billion yen in Forex. So, let me introduce a very useful indicator that I use.
Environmental confirmation type indicator. We have narrowed down the pivots that the world market is aware of to tw
FREE
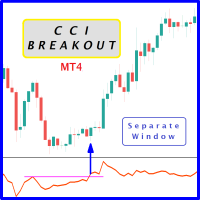
Probability emerges to record higher prices when Commodity Channel Index breaks out oscillator historical resistance level when exhibit overbought values. Since, oscillator breakout of support and resistance have similar effect as price breaks support and resistance levels, therefore, its highly advised to confirm price breakout with oscillator breakout; certainly, will have the same output in short trades. Concept is based on find swing levels which based on number of bars by each side of peak
FREE
============ FREE =============
Objective: To properly manage risks and quickly execute trades Works on all timeframes and currency pairs Quickly place a trade
Prevents bad entries when executing a trade by limiting max spread Set your entry and stop loss at better price Set fixed risk amount/percentage per trade Automatically calculate position/lot size based on risk amount/percentage Set proper stop loss level by setting min and max pips Other Tools: https://www.mql5.com/en/market/product/
FREE

The indicator shows entry points with Risk-Reward-Ratio 1 to 5. Main timeframe H1. Works on every pair. The main logic - is to find a reversal level, and then track the price reaction to this level. Doesn't need any settings. As a standard, it paint 5 levels of the same take-profit (red / blue for sellers and buys) and 1 stop-loss level - orange. ATTENTION! Test version of the indicator. Works only on the USDCAD pair! The full version can be bought here https://www.mql5.com/en/market/product/61
FREE

After 7 years I decided to release some of my own indicators and EAs for free.
If you find them useful please Show support with a 5-star rating! Your feedback keeps the free tools coming! See other my free tools as well here
_________________________________ Volume Moving Average (Volume MA) Indicator for Advanced Forex Market Analysis Introducing the Volume Moving Average (Volume MA) Indicator, meticulously developed in MQL4, a pivotal tool for enhancing your forex trading strat
FREE

The product Divergence Cci Force Stddev Ac Atr is designed to find the differences between indicators and price. It allows you to open orders or set trends using these differences. The indicator has 4 different divergence features.
Divergence types Class A Divergence Class B Divergence Class C Divergence Hidden Divergence
Product Features and Rec ommendations There are 5 indicators on the indicator Indicators = CCI, Force, Stdandard Deviation, Acelereator, Atr 4 different divergence type
FREE

Discover our brand new trading robot, IT Fractals EA , a revolution in the world of automated trading. Our EA pushes the boundaries by utilizing the fractals indicator for exceptional performance.
Key Features :
Fractals Strategy : IT Fractals EA stands out by adopting an innovative strategy based on the fractals indicator. This clever approach allows you to pinpoint market reversal points with precision, thus identifying optimal trading opportunities. Advanced Management : Our EA comes equip
FREE
This expert advisor is very simple and easy to understand, it is based on the single Moving Average. The indicator settings is fully customized.
Recommended Pairs: - EURUSD - GBPUSD - AUDUSD - NZDUSD Expert Advisor Inputs: - Timeframe : Default value = current - Ma_Period : Default value = 50 - Ma_Method : Default value = MODE_SMA - Ma_Applied_Price : Default value = PRICE_CLOSE - Ma_Shift : Default value = 10 - Shift : Default value = 0 - Buffer_Candle : Default value = 1 - Auto_Lot : De
FREE
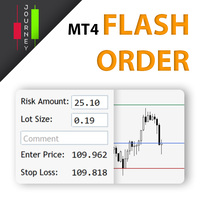
Trading has never been easier! Let's check this out! MT5 version: https://www.mql5.com/en/market/product/72120 The story: How I boost up my trading speed without any "Invalid SL or TP" error
NOW ALL YOU NEED TO DO IS Drag the lines Press Open Order button Enjoy! With this tool, you will no longer have to enter prices manually, which can cause many mistakes and you could miss the trade! From the board, we have: Risk Amount : the risk you want to apply for your trade Risk Unit : USD : If sele
FREE

工作在当前TF。 认为马2,14,30,120和480。 秋天的生长速度,2-14,14-30,30-120和120-480之间的差异。
在这个EA中实现了最大利润的计算,并且根据收盘价格,如果最大利润达到200点,那么不考虑任何事情,如果从200到300,那么如果收盘价低于最大利润的1.1倍(价格下降了10%),如果从300到1500,那么如果收盘价低于最大利润的1.5倍(价格下降了30%),那么关闭。 如果从1500到2500然后关闭,如果价格下降了20%的最大利润,如果超过2500然后关闭,如果价格下降了10%以上。 这使得可以从开始时的20点下降到2500的250点。 在跌落或上涨的MA2,14,30,120的情况下,第一个柱线的MA2和MA14之间的差小于20,零柱线收盘价高于或低于MA14,在这种情况下,收盘价等于卖出价。 通过第一条和第二条之间的速度,可以考虑到平均值下降的增长。
大脑调整后的Eurodollar时间TF。 在一月至四月2019显示30%的利润。 截至2018年8月-2019年4月40%的利润。
新版本根据MA移动平均线的参数添加了用于下订单的
FREE

Retracement Reversal and Support and Resistance Pro is based on a formula used by Proprietary trading firms and other big institutions on WallStreet including on my Company and used by my traders here in the capital of the world. This indicator will create Red and Green arrows on a possible mayor Retracement level, Reversal Level and future Support and Resistance levels and Yellow arrows on a possible m i nor Retracement level, Reversal Level and future Support and Resistance levels . This in
FREE

MQLTA Candle Timer is an indicator that can show you the details about a symbol/pair and alert you before the close of a candle. Used in swing trading and not only, it can help your strategies knowing and be ready before the close of a candle.
How does it work Simply add the indicator to the chart and set the notifications options. You can load a minimalistic interface or a full interface. The alert will be sent once per candle.
Parameters All the parameters, that you can see in the picture, a
FREE
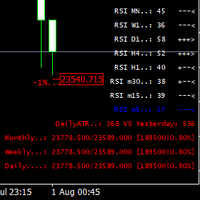
This indicator was created most for personal use. I decided to look up the last 3 bars of RSI, it is good for scalping or for weekly trading and looks as universal fx-toy. In menu you can turn on daily percentage gain info, it is good for crypto as for me, weekly and monthly gains also included as informers. Short ATR helps to determine when price was stopped and entry for pulse pump/dump. The filter of numbers of RSI can be tuned for overbought/oversold values with colors you needed. Exam
FREE

This indicator is stand alone version from MP Pivot Levels (All in one) containing Woodie Pivots. Woodie’s pivot points are made up of multiple key levels, calculated from past price points, in order to frame trades in a simplistic manner. The key levels include the ‘pivot’ itself, and multiple support and resistance levels (usually up to three each). Traders use these levels as a guide for future price movements when setting up trades.
The pivot : (Previous high + previous low + 2 x previous
FREE
The Ergodic is an oscillator based on William Blau's True Strength Index, which is based on Momentum to which double smoothing has been applied. 100* EMA(EMA(Momentum) / EMA(EMA( |Momentum|)) The Ergodic adds a moving average to the TSI which will act as a Signal Line. This oscillator can be used to identify trend reversal zones, or trend continuation phases.
VERY USEFUL WHEN USED IN CONJUNCTION WITH THE CURRENCY INDEX.
L' Ergodic è un oscillatore basato sul True Strenght Index di William Bla
FREE

Rua Pinbar This is an indicator to help you quickly identify pinbar candles in the chart. Can be used on any currency pair and any time frame you want. This indicator is often used to determine entry points. You can refer to the product here: https://www.mql5.com/en/users/phamruacoder/seller
A product of Ruacoder Get code indicator and robot (EA) as required.
FREE

Panoramica Pending Order Assistant è progettato per automatizzare la creazione di ordini pendenti Buy Stop e Sell Stop su coppie di valute specifiche ( EURUSD, GBPUSD, AUDUSD ). Questo EA consente ai trader di impostare facilmente livelli di entrata strategici senza dover posizionare manualmente gli ordini.
Funzionalità Principali Creazione Automatica di Ordini Pendenti L'EA genera automaticamente 4 ordini Buy Stop e 4 ordini Sell Stop appena viene attivato sul grafico. Gli ordini sono distanzi
FREE

MetaTrader 4(MT4)的 "两条移动平均线交叉 "指标是一个技术分析工具,显示两条移动平均线并在移动平均线相互交叉时发出通知。 该指标计算并绘制两条移动平均线,其中一条较快,另一条较慢。当较快的移动平均线穿过较慢的移动平均线时,它被认为是一个看涨信号,表明潜在的趋势逆转或新的上升趋势的开始。相反,当较快的移动平均线穿过较慢的移动平均线下方时,它是一个看跌信号,表明潜在的趋势逆转或新的下降趋势的开始。 该指标可以自定义使用不同类型的移动平均线,如简单移动平均线(SMA),指数移动平均线(EMA),平滑移动平均线(SMMA),或线性加权移动平均线(LWMA)。交易者还可以调整每条移动平均线的周期,以适应他们的交易风格和偏好。 除了绘制移动平均线外,该指标在发生交叉时还会产生警报。交易者可以设置声音或视觉警报,或者在交叉发生时收到电子邮件或推送通知。这一功能可以帮助交易者保持对潜在交易机会的了解,即使他们没有积极监测图表。 两条移动平均线交叉 "指标是一个多功能和易于使用的工具,对新手和有经验的交易者都有价值。它可以用来识别趋势,发现潜在的进入和退出点,并产生交易信号。
特点

经过7年的时间,我决定免费发布一些我自己的指标和EA。
如果您觉得它们有用,请 通过五星评级表达支持!您的反馈将继续带来免费工具! 也查看我的其他免费工具 这里
_________________________________ 波林格带宽度指标——高级市场波动性分析工具 在MQL4中精心开发的波林格带宽度指标,是一款先进的工具,旨在提升外汇交易分析的水平。它利用波林格带测量波动性的能力,为交易者提供关于市场动态和潜在交易场景的关键洞见。 喜欢这个免费指标吗?请用五星评价来表示支持!您的反馈是我们提供免费工具的动力! 主要特点: 精准波动性测量 : 计算波林格带宽度(上带 - 下带)/ 中带,准确评估市场波动性。 市场状况洞见 : 识别战略性交易所需的高波动性(潜在突破)和低波动性(市场整合)时期。 全面趋势背景 : 加强对市场趋势的理解,较宽的带表明更大的波动性和潜在趋势强度。 与交易策略集成 ️: 作为各种交易策略的有价值组成部分,尤其是与其他指标结合时,用于细致分析。 使用和信号解读: 设置 ️: 轻松将波林格
FREE

This is a simple Bollinger Band EA This works by activating a trade whenever the input parameters are met, including the Bollinger Band parameters The Bollinger Band Parameters determines when a buy or sell trade is opened: If the price is outside the lower bounds of the activated bollinger bands, a buy trade is opened (given that all other criteria are met) If the price is outside the upper bounds of the activated bollinger bands, a selltrade is opened (given that all other criteria are met)
K
FREE

Abiroid Multi Slope indicator allows you to calculate a Slope Histogram for any line of any indicator . Histogram is for 1 slope line only, but slope values can be calculated for 3 lines total. To have multiple histograms, add as many Slope indicators for custom indicators as you like on chart. You just need to provide the Indicator name, buffer value, slope's period and max number of bars back. By default it has slope calculation for TDI_v4.ex4 indicator. There is no way to specify parameters f
FREE

1. Make sure you trade only with GBP/USD on an 1h chart as this model is built specifically for the hourly Cable trading. 2. If you are backtesting the EA during weekends, make sure to specify a reasonable spread (such as 30 or 50) instead of using current spread because the market is not trading and the current spread may be some awkward number. During weekdays, feel free to use current spread as it is the correct current spread value. 3. If you want to have an even more stable-performing EA,
FREE
ChartOverlay indicator has two main functions 1. mirroring - i.e. for example, it will make USDEUR from EURUSD 2. displaying the price chart of the selected financial instrument (with selected period) in the subwindow of the main chart. This tool allows traders to easily analyze the relationship between different currency pairs and assets, offering unique customization and visualization features.
Key Features: Price Chart Display: The indicator displays the price chart of the selected instrume
FREE
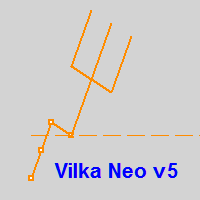
Вилка Нео v5, разрабатывалась для торговой системы "Оракул", но постепенно дополнялась, например - углами Ганна и другими опциями...
Можно создавать графические объекты с заданным цветом, стилем и толщиной, такие как: прямоугольники с заливкой и без, отрезки трендлиний и нестандартный инструмент - "вилка Нео" в виде трезубца, так же есть возможность интерактивно настраивать цветовую палитру прямо с графика, настраивать видимость объектов для разных ТФ, толщину и стили... Панель переключается кла
FREE

Dear Friend ... I hope and Wish a happy new year to all of you .. as i told you < this is a simple Utility EA can helps you in your trading . he helps you to ensure that your decision is correct to enter the market . it is work on all currency pairs , stocks ,indices and crypto . its easy to install . no complicated inputs. this EA works as follows : it's main work is to detect the highest price and the lowest price on H4 & H1 time frame and draw resistance and support and trend every line has
FREE

Индикатор "Trend zone" Помощник трейдеру, показывает на графике текущую тенденцию. Он надеюсь станет незаменимым индикатором в ваше трейдинге. Индикатор не перерисовывается и не меняет свои значения про переключение временных периодов The "Trend zone" indicator is a trader's assistant, shows the current trend on the chart. I hope it will become an indispensable indicator in your trading. The indicator does not redraw and does not change its values about switching time periods
FREE

In the indicator there are EUR, USD, CAD, AUD, NZD,JPY, GBP ,CHF.
The Currency Index Project is Forex study. Many people do not know the theoretical basis that drives currency exchange rates to move on the market. With this set of tools you will be able to have a more complete view of the entire market by analyzing not only the single currency of an exchange, but all the exchange rates that make up that currency by looking at a single window! The study assumes that all forex currencies are lin
FREE

Sometimes a trader needs to know when a candle will close and a new one appears to make the right decisions, this indicator calculates and displays the remaining of current candle time . It is simple to use, just drag it on the chart. Please use and express your opinion, expressing your opinions will promote the products. To see other free products, please visit my page.
FREE
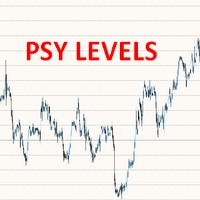
This free MT4 indicator allows you to automatically display psychological price levels on your chart It's very powerful when you combine it with other tools such as Fibs levels, Supports & Resistance levels, Moving Averages, Wyckoff schematics, etc. For example, you can use this indi to display horizontal levels every 100 points on your GER40 chart, or 500 points on your BTC chart, etc. ***Please comment, rate and share it to your friends if you like it***
FREE

This is a simple indicator that shows the spread in points. It is useful for those like trade scalper, in addition to be customizable. Functions: Color - I don't need to explain :) Font type - I don't need to explain :) Font size - I don't need to explain :) Aditional text - aditional text after the spread number. Corner - specify the corner where the spread will be written. X position - horizontal distance from the edge. Y position - vertical distance from the edge. Check out our others indicat
FREE

The Point-Percent Price Channel (PPPC or PP Price Channel) indicator is designed to display on the chart a channel whose width is specified both as a percentage of the current price and in points. Its appearance is presented on slide 1. When the market moves up, the upper border of the channel is built at the price of High candles. In this case, the lower boundary follows the upper one at a strictly specified distance. When the price touches the lower border of the channe
FREE

This Expert Advisor is our latest trading system and it is designed to work with EURUSD and GBPUSD . This EA produces good results with medium spreads. It opens a market order following the market trend and then it opens Market Orders with different amount of lots to close all orders or single order in profit with small amounts. To close trades, it uses a cumulated closing function or a closing function for each trade opened. It works with all time frames, better with lower TF, and you can us
FREE
ZZ BreakOut AI
A new generation of Breakout EA. It will wait for sharp entry and then enter the market. Using really smart grid orders to cover losses if the price goes opposite direction. * Live signal: https://www.mql5.com/en/signals/2296370
**Inputs: Default inputs are for EU - M15 Please contact me to get set files after purchasing. ** Pairs: EU/GU/NU/UCHF/AU/ECHF/UCAD/AN ** Capital: Minimum 1000 USD/Cent per pair.
** Recommendation : + Although this EA was designed to avoid
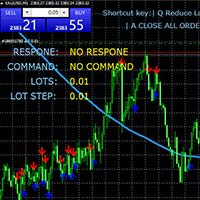
键盘交易 使用键盘快捷键进行交易,适用于剥头皮等快速快捷交易 可以自定义动态变更每次开仓头寸数量,且可以设定开仓订单止盈止损位置 使用说明 Q 减少手数 E 增加手数 W 买入 S 卖出 A 关闭所有订单 D 变更每次更改手数的数量 参数说明 open_lots 设定开仓手数 input_lots_step 设定 每次更改手数的数量步长 take profit in pips 设定止盈点数 Stop Loss in pips 设定止损点数 Slippage 设定开仓接受的滑点数 text_font 图表字体样式 introductory display 快捷键提示显示开关 text Size 文字大小 X distance for text 图表字体X轴位置 Y distance for text 图表字体Y轴位置 Text corner 图表字体展示位置
FREE
The indicator determines overbought/oversold zones on various timeframes. Arrows show market trend in various time sessions: if the market leaves the overbought zone, the arrow will indicate an ascending trend (arrow up), if the market leaves the oversold zone, the arrow will indicate a descending trend (arrow down). Situation on the timeframe, where the indicator is located, is displayed in the lower right window. Information on the market location (overbought or oversold zone), as well as the
FREE

Trendfinder SMA With Zone and Alert are Colored candlesticks showing the trend based on two SMA as Signal and two SMA as a Buy and Sell Zone and the slope of the slow moving average. This indicator will give you the color change on the next bar on the confirmation candle and will provide alert on Buy and sell signal, when it enters the buy and sell zone and when the market test the buy or sell zones as support or resistance and will never repaint . This indicator has the following: 2 SMA for th
FREE

The RMI Scalper EA is a fully automated Expert Advisor that trades pullbacks from the major trend using RMI and limited averaging. The EA trades using market orders and uses averaging to safely turn otherwise negative trades positive. This EA works best on USDJPY, EURUSD, GBPUSD, USDCAD, USDCHF, AUDJPY, EURCAD, EURGBP and EURJPY using the M30 timeframe and has the option to trade multiple pairs but only one pair at any one time to increase trade frequency without increasing draw down.
Please not
FREE
Counterattack EA is a fully automatic Grid Expert Advisor for Trend Scalping Trading on XAUUSD timeframe M1 but also in others.
Recommendations The Expert is programmed to work on XAUUSD M1, but you can use all others timeframes also. An ECN broker is always recommended A low latency VPS is always recommended. The recommended Leverage is 1:100 or more. The recommended capital is 10000 ($/cent) per 0.01 Lots or more. For higher Lots please test by yourself Please test Demo before you b
FREE

NotAI MT4 - MetaTrader 4 的高级交易策略 概述: NotAI MT4 是一款专为 MetaTrader 4 设计的高级智能交易系统(EA),提供一套先进的交易策略来提升您的交易体验。该 EA 结合了多种策略,包括 Pin Bar、射击之星、突破和区间交易,以适应不同的市场条件。正如其名称所示,NotAI MT4 并未引入人工智能,而是专注于经过验证的交易策略。 尽管已通过严格的回测以避免过度拟合,不同经纪商之间的测试可能会有所差异。因此,EA 内置了两个参数集,供您根据经纪商进行选择和测试。优化是基于约 8 年的数据完成的,这使得该 EA 专为长期使用而设计。 主要功能: 多种交易策略: Pin Bar 策略: 使用 Pin Bar 模式检测潜在的价格反转。 射击之星和倒锤子线策略: 识别看跌和看涨反转信号。 突破策略: 通过捕捉关键水平的突破来抓住市场动量。 区间交易策略: 利用价格在指定区间内的波动进行交易。 灵活的手数设置: 支持固定手数或基于账户余额百分比计算的手数,轻松管理风险。 简单切换策略的启用与禁用。 根据您的交易风格调整风险比例、手数及策略参数

RangeMasterFX combines trend analysis and technical indicators based on multiple timeframes. Multi-Timeframe Analysis: Analyze trends on three timeframes: daily (D1), 4-hour (H4), and 1-hour (H1). RSI Filter: Uses the RSI (Relative Strength Index) to identify overbought and oversold market conditions and filter entries. Trailing Stop: Apply trailing stops when positions move in your favor to maximize profits. Dynamic Stop Loss and Take Profit: Dynamic stop loss and take profit depending on marke
FREE
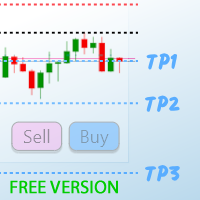
TP1 TP2 TP3 panel free is a simple tool designed for manual trading. It helps you to follow free or paid forex signals with multiple take profit (TP1 TP2 TP3). Fill the fields (volume, SL, TP1, TP2, TP3) in pips or price, press the ‘Sell’ or ‘Buy’ buttons and the program opens 1 to 3 identical orders. It also adds TP1 and TP2 lines on chart. The program alerts you when TP1 and TP2 are reached or if stop lost and TP3 are almost reached so you can close your orders and move stop losses according t
FREE

A reversed engineered and improved version of the extremely popular AFSID scalper ( afs-id.com ). Includes re-modeled versions of these 2 well received scalping programs: " AF-Fibo ", and " AF-TrendKiller". Take note that this is a high risk scalper Though improvements have been made to mitigate some of the risks, the risks inherent to martingale scalpers still exists, so use it at your own risk.
afsida Scalper (improved AFSID)
This is a simple martingale scalper which works on any pair (1
FREE
MetaTrader 市场 - 在您的交易程序端可以直接使用为交易者提供的自动交易和技术指标。
MQL5.community 支付系统 提供给MQL5.com 网站所有已注册用户用于MetaTrade服务方面的事务。您可以使用WebMoney,PayPal 或银行卡进行存取款。
您错过了交易机会:
- 免费交易应用程序
- 8,000+信号可供复制
- 探索金融市场的经济新闻
注册
登录